
Video•Mar 1, 2026
High Volatility + Reversals: The Real Reason Leveraged ETFs Underperform
The video examines why leveraged exchange‑traded funds (ETFs) tend to underperform during turbulent markets, focusing on the empirical link between volatility and serial correlation rather than volatility alone. The presenter challenges the common narrative that volatility is inherently detrimental, showing that high‑volatility episodes also generate pronounced return reversals, which exacerbate the daily rebalancing drag inherent to leveraged products. Data analysis reveals two critical forces: underlying stock returns typically weaken in high‑volatility regimes, and those regimes also experience a surge in reversal patterns. Because leveraged ETFs must reset exposure each day, they incur higher transaction costs and compounding losses when reversals dominate, a phenomenon the speaker labels “volatility decay.” The key driver is the serial covariance—the product of volatility magnitude and the strength of serial correlation—rather than volatility in isolation. The speaker underscores this point by contrasting real‑world observations with textbook models such as geometric Brownian motion, which assume independent, identically distributed returns and would predict no link between volatility and reversals. He notes, “Volatility acts as an amplifier for whatever serial correlation you have,” highlighting that the observed reversal spikes are the true source of performance erosion. For investors and product designers, the implication is clear: monitoring serial correlation and its interaction with volatility is essential for assessing leveraged ETF risk. Strategies that ignore this serial covariance may underestimate rebalancing costs, leading to unexpected losses during market turbulence.
By Rational Reminder
Video•Mar 1, 2026
Why I Trade 25 Strategies After 17 Years of Trading (Dave Mabe)
Dave Mabe, a veteran day trader with roughly two decades of experience, explains why he now operates 25 fully automated strategies every market day. After an early career of swing and discretionary trading, he transitioned to systematic approaches, recognizing that...
By Desire To Trade (Etienne Crete)
Video•Feb 28, 2026
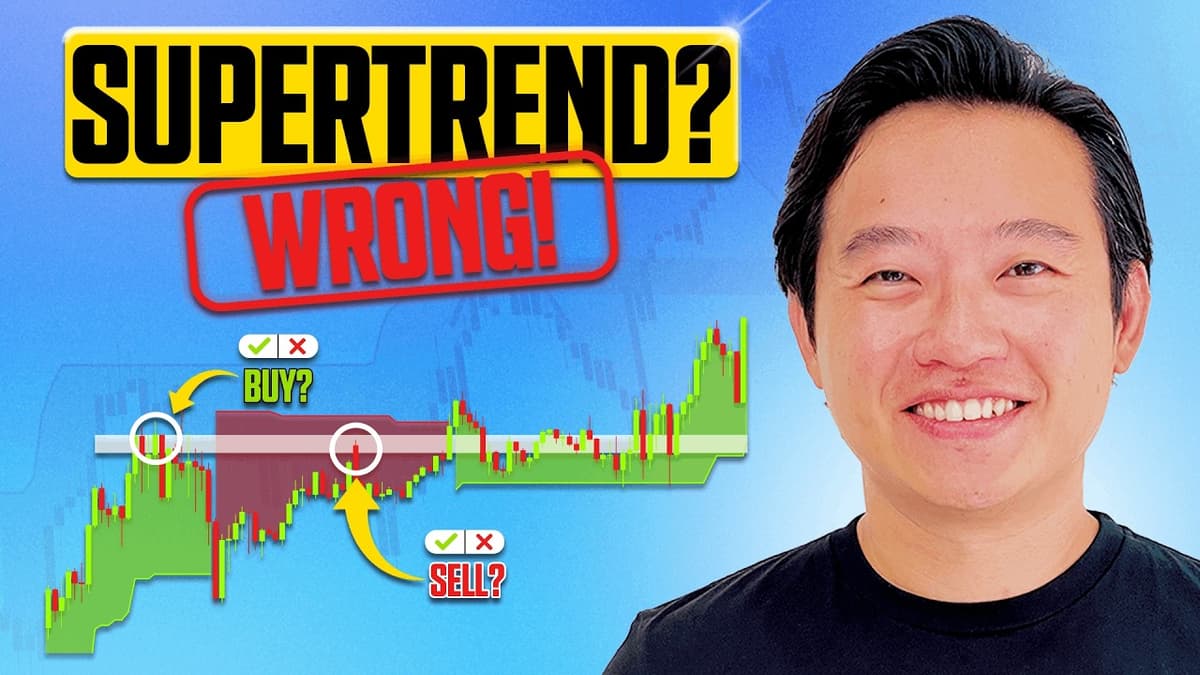
I Use This Supertrend Indicator Strategy (Most Traders Use It Wrong)
In this video Ezekiel Chiu explains why most traders misuse the SuperTrend indicator, treating its color changes as a simple buy‑or‑sell switch. He argues that the indicator was designed to grant "trade permission"—signaling when market conditions justify a bullish or...
By Asia Forex Mentor (Ezekiel Chew)
Video•Feb 28, 2026
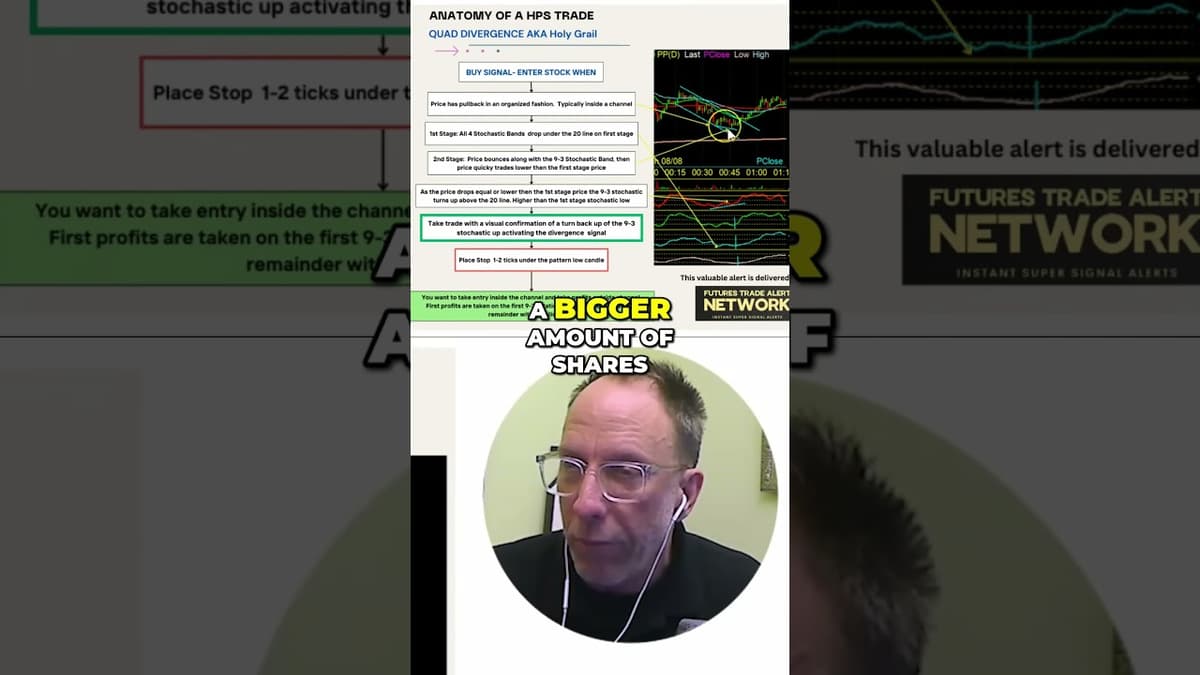
The 95% Win Rate Scalping Trade Setup
Video presenter markets a “quad divergence” scalping method as a near‑holy‑grail, promising a 95% win rate on CME futures such as MES and ES. He describes the pattern as a combination of a quad rotation on higher time frames and...
By Desire To Trade (Etienne Crete)

Video•Feb 28, 2026
Consolidation = No Trades? Think Again 👀🔥
The video challenges the notion that consolidation periods are trade‑free, arguing that disciplined traders can still capture profit. The presenter explains he employs a suite of strategies—some for trending markets, others for sideways ranges. He demonstrates advanced harmonic‑like patterns (X‑A‑B‑C‑D) on...
By Akil Stokes (Tier One Trading)

Video•Feb 28, 2026
Stock Market Today: NVDA & CRWV Weakness, WBD Bidding War Ending, XYZ Rallies #shorts
Today's market recap showed all major indices slipping over 1% this week, with the Dow and Russell leading declines. Tech heavyweights Nvidia and CoreWeave bore the brunt of investor anxiety over looming hyperscale capex, despite Nvidia's record‑breaking revenue and strong...
By Schwab Network
Video•Feb 27, 2026
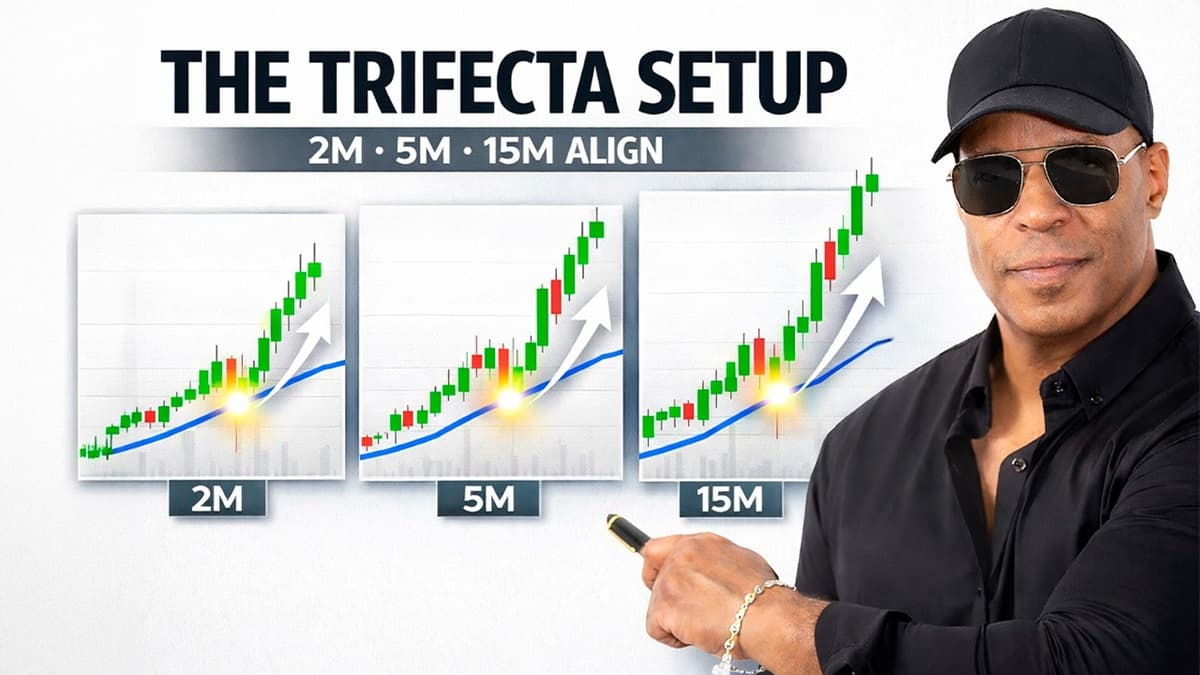
This 3-Timeframe Setup Changes Everything
The video introduces the "trifecta" setup – a three‑timeframe intraday pattern where a stock simultaneously breaks above its 20‑period moving average on the 2‑minute, 5‑minute and 15‑minute charts. The presenter stresses that each timeframe’s 20‑MA is distinct, so alignment across...
By Oliver Velez Trading
Video•Feb 27, 2026
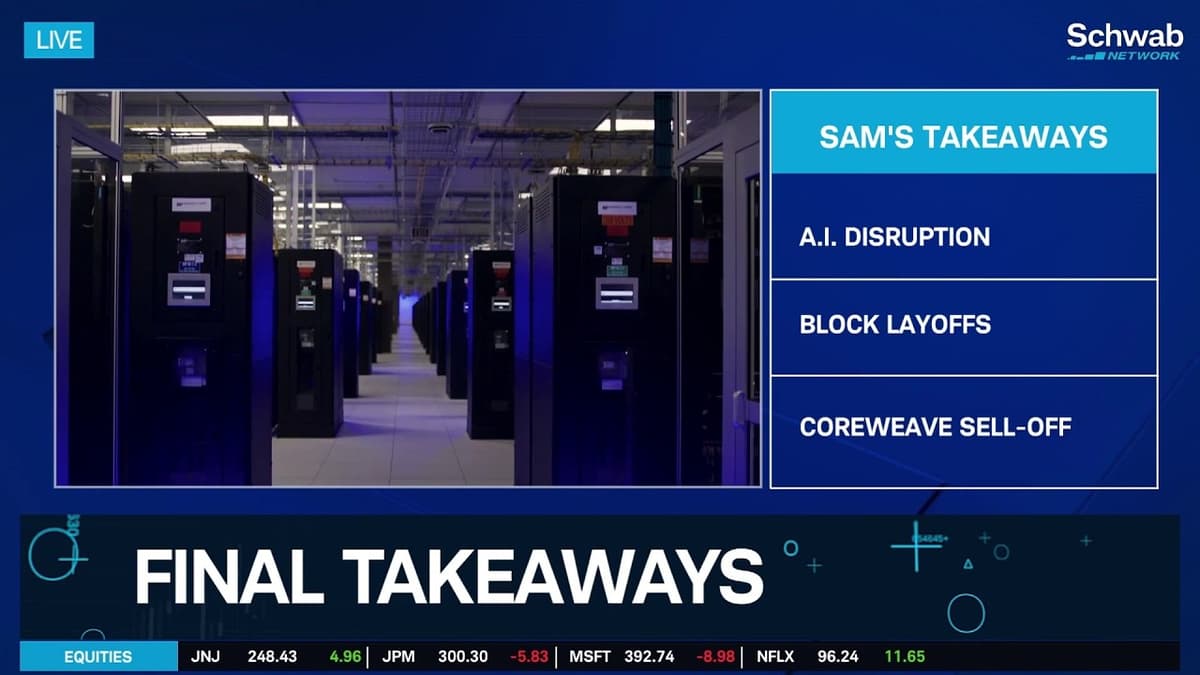
Friday's Final Takeaways: Two Sides of AI Disruption in CRWV & XYZ
Market on Close wrapped the week with a stark contrast in AI’s impact. Block’s decision to cut nearly half its workforce, citing AI efficiencies, sent its shares sharply higher, while the broader software sector suffered sell‑offs as investors worry about...
By Schwab Network
Video•Feb 27, 2026
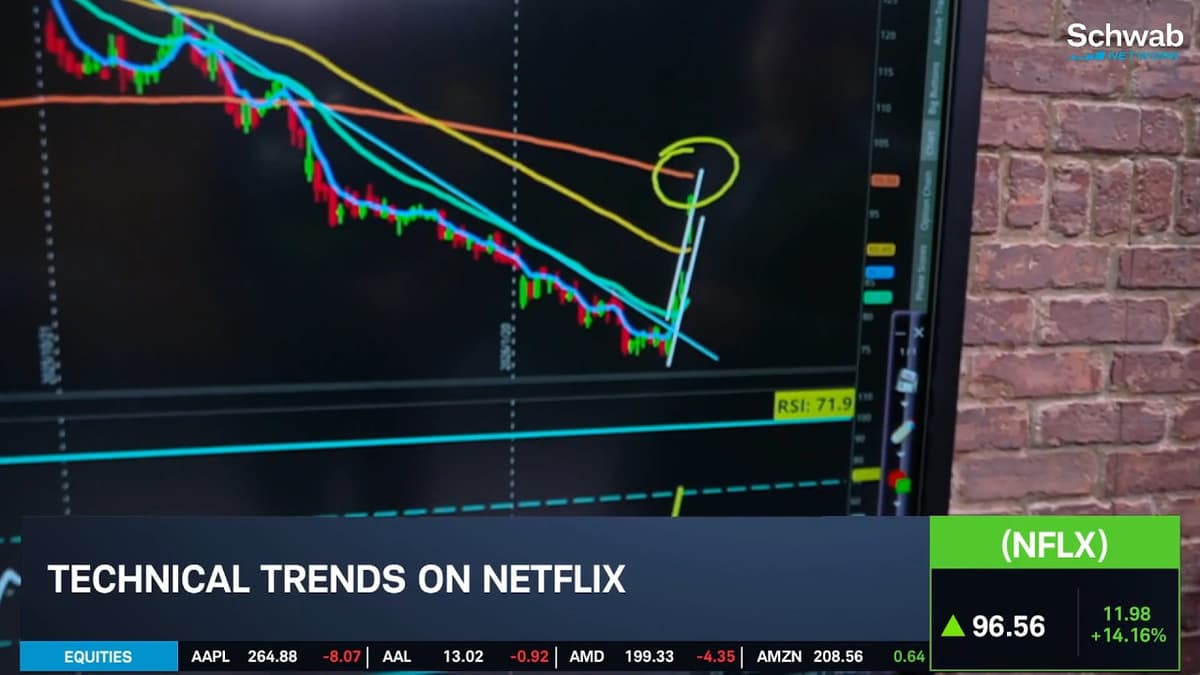
NFLX Jumps After Losing WBD Bidding War to PSKY
Netflix stock surged on Friday after the streaming giant lost its bid for Warner Bros. Discovery to Paramount Skydance. The rebound was driven by strong technical signals, including a breakout above key moving averages. Options activity also exploded, with volume more...
By Schwab Network
Video•Feb 27, 2026
U.S. Stocks Sink After PPI Inflation Surprise
U.S. equities fell sharply on Friday after January's producer price index rose 0.5% month‑over‑month, outpacing the 0.3% forecast, and fintech firm Block announced a near‑50% workforce cut to adapt to AI‑driven changes. The Dow Jones lost about 800 points, down...
By Yahoo Finance
Video•Feb 27, 2026
How TG Grew His Account by 420% in 6 Months
TG Watkins, director of stocks at Simpler Trading, used a live webinar to detail how his Moxie Indicator helped him turn a modest portfolio into a 420% gain in six months and a 2,060% options windfall in 30 days. He...
By Simpler Trading
Video•Feb 27, 2026
Today on Taking Stock | Stocks Fall as @Nvidia Weighs on Tech Despite Strong Earnings
U.S. markets closed mixed: the S&P 500 fell about 0.5% while the Dow edged up and the Russell 2000 and NYSE Composite finished higher as investors rotated away from mega-cap AI leaders. Nvidia posted strong earnings but post-report momentum faded,...
By NYSE Official

Video•Feb 27, 2026
Nvidia Earnings: The Ultimate Coin Flip
The video dissects Nvidia’s post‑earnings market turbulence, noting that the chip‑maker’s stock surged in after‑hours trading only to tumble to $184.89, a 5.5% decline and its worst single‑day drop since last year’s tariff‑related sell‑off. The host warns that the rapid...
By The Options Insider
Video•Feb 26, 2026
This Is Where Traders Get Trapped
In the February 26 Thursday review, Sam notes that the S&P 500 has been confined to an unusually tight trading range for almost three months, hovering around a weekly 10‑point band and offering little directional clarity. He recaps last week’s predictions—a mechanical short‑squeeze...
By Simpler Trading
Video•Feb 26, 2026
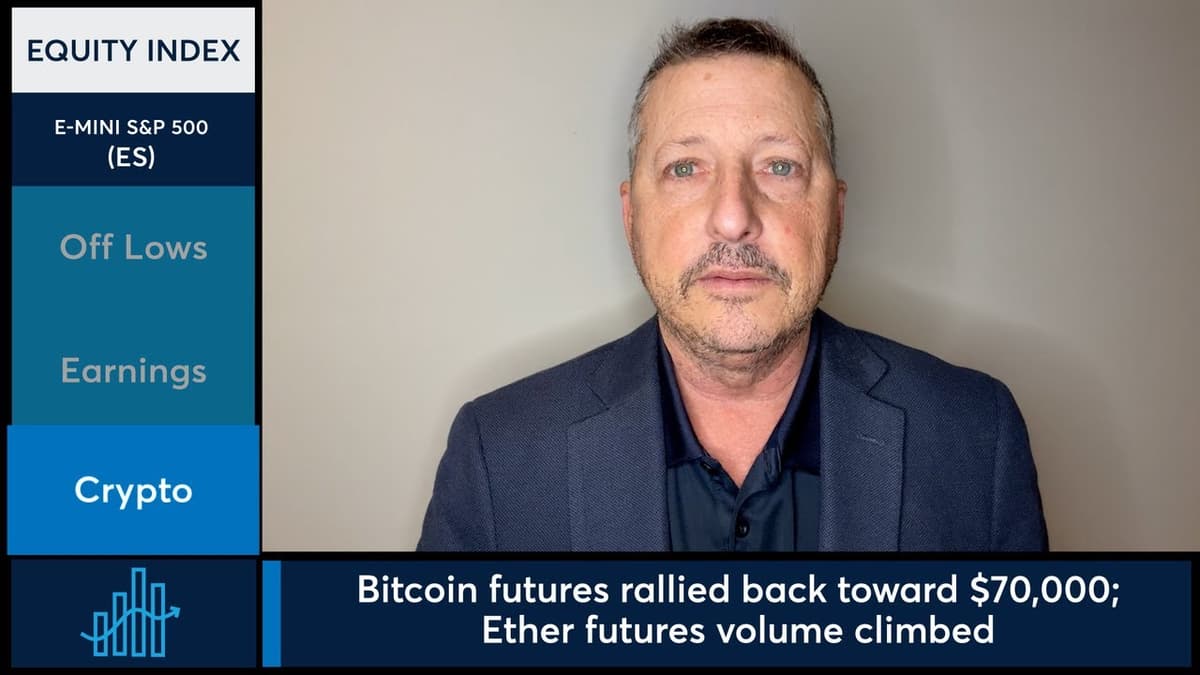
Equity Indices Moved Off Session Lows Following Earnings Reports. 2/26/26
The video recaps Tuesday’s market action, highlighting how equity indices rebounded from early session lows after mixed earnings from tech giants NVIDIA and Salesforce. The S&P 500 and Dow Jones clawed back losses, while the Nasdaq stayed more than 1%...
By CME Group