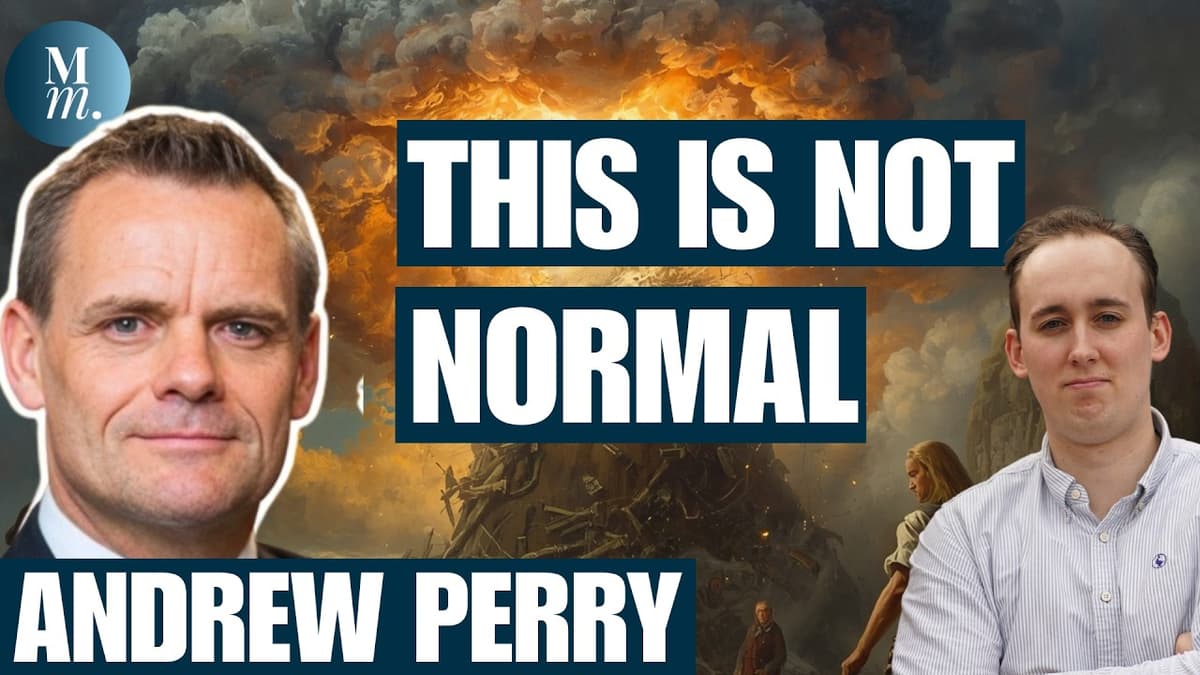
Warning: Don’t Sell Blow-Offs in Stock Market, Veteran Macro Investor Andrew Perry Says
In this episode of Monetary Matters, veteran macro investor Andrew Perry cautions listeners against trying to sell during market "blow‑off" phases, likening such attempts to standing in front of a train. He references the 1999 Nasdaq surge and warns that the current U.S. rally—up roughly 60‑65%—could still surge another 20‑40% before a correction, making premature exits especially risky. Perry outlines his five‑pillar framework that blends macro‑economic storylines, liquidity analysis, monetary policy, curve positioning, and bottom‑up technicals. He emphasizes that liquidity, measured through rate‑of‑change models and Treasury quarterly refunding (QR) announcements, is the primary driver of market moves today, while traditional interest‑rate policy plays a diminished role. He illustrates his approach with concrete examples: shorting Australian and European equities while staying long U.S. stocks, and focusing on agricultural commodities versus energy‑dependent nations like Germany. Perry also highlights the importance of QR dates, noting how short‑term Treasury issuance has repeatedly sparked market rallies and can serve as a reliable liquidity signal. The takeaway for investors is clear: avoid chasing tops in a volatile rally, prioritize risk‑adjusted pair trades, and monitor Treasury QR schedules and liquidity metrics. By integrating these pillars, market participants can better navigate potential drawdowns and capitalize on asymmetric opportunities.
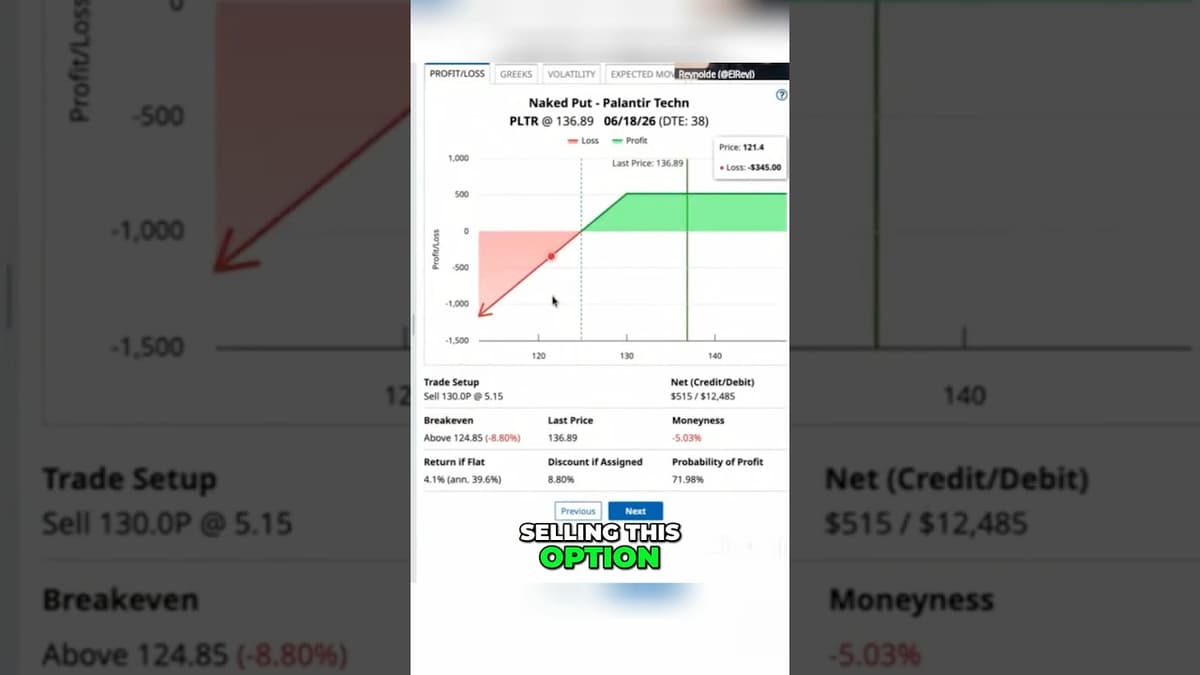
How Options Traders Get Paid While Waiting ⏳ #PLTR #Palantir
The video walks viewers through a practical options‑selling strategy, using Palantir (PLTR) as a case study. It shows how traders can generate income by selling naked puts when they are bullish on a stock, collecting premiums while waiting for the...
THE ENTIRE MARKET IS SETTING UP FOR CHAOS 🔴LIVE
The live‑stream focused on the market’s “chaos” setup, tying together the AI rally, the recent US‑China summit, and the looming Federal Reserve rate‑hike debate. The host argued that the summit could unlock Nvidia sales to China, reviving semiconductor earnings, while...
When All Strategy Fails
The video examines the explosive 665% rally in Avis (AVIS) shares, triggered by an unexpected shutdown of the U.S. Transportation Security Administration that crippled airline travel. With flights delayed, consumers turned to rental cars, inflating Avis’s demand and prompting a massive,...
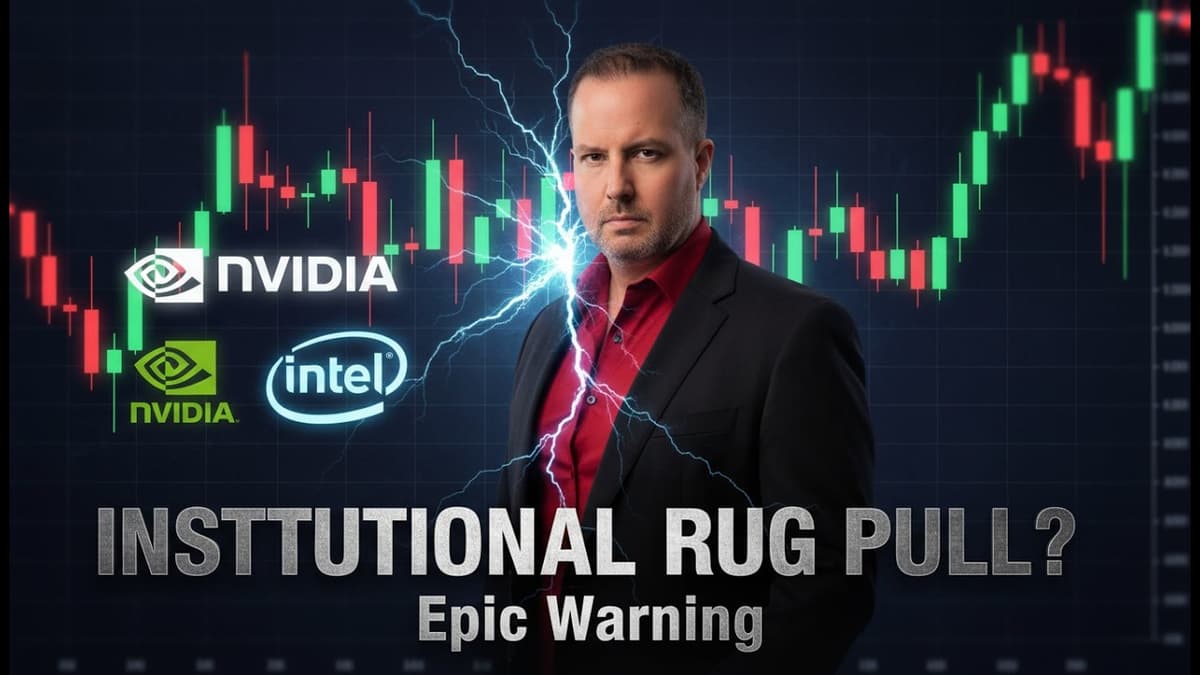
Institutional Game - Retail Loses: Rug Pull Moment As Cerebras (CBRS) IPO Tops Semi's
The video dissects a possible market top, focusing on the semiconductor rally’s fragility and the eye‑catching Cerebras Systems IPO. Gareth Soloway notes that while the S&P 500 and Nasdaq have been climbing, the underlying breadth is negative and key chip...
Equities Spotlight: Inescapable Rallies
The segment focused on the explosive S&P rally from 6,300 to above 7,500 and how options traders are adapting. Prosper’s team highlighted a heavy reliance on iron condor spreads to harvest the inflated premiums that accompany today’s elevated volatility. Key insights...
Upside Continues in Equities, Crude and Copper
The Options Insider episode highlighted a broad upside across equities, crude oil and copper, noting that the S&P 500 E‑Mini breached the 7,500 level for the first time following a cease‑fire announcement that halted a March sell‑off. Commodity moves were led by...
Why This Stock Could Push or Pull the ASX to a Pivotal Level | the Trade
The episode of "The Trade" dissected a confluence of macro and technical factors that could push the Australian Securities Exchange to a decisive juncture. It opened with a briefing on the US‑China summit, noting discussions on the Strait of Hormuz,...
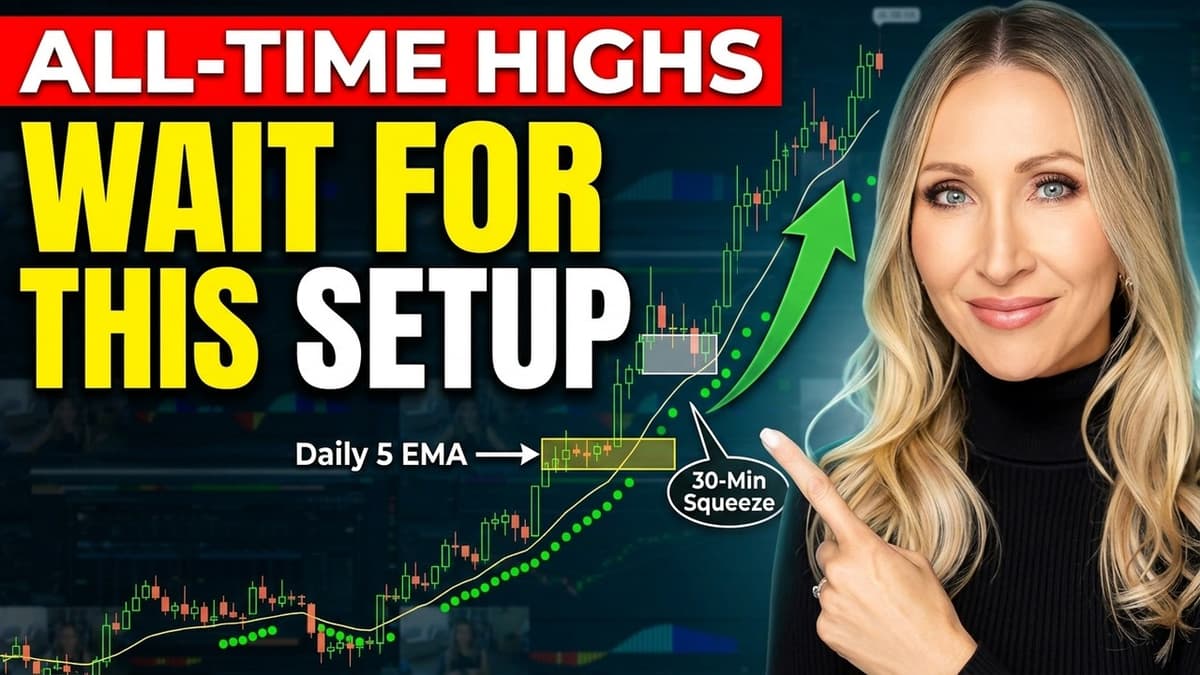
All-Time Highs Keep Coming: Here's How to Trade Them
Heather opens by noting that the S&P 500 has logged seven new all‑time highs in just ten trading days of May, while red‑day closes remain scarce. She points out that the market’s usual pullback to the 21‑day EMA has vanished, forcing...
What Our Traders Are Focusing on Right Now 📈 🌟 #Shorts
The trader explains that his current priority is trade sizing—aiming to take larger positions on his go‑to swing trades. He notes a paradigm shift from chasing daily or two‑day squeezes to targeting bigger, longer‑term income opportunities as market conditions improve. He...
…Bots + Breakfast. Trade SPX at the Open with Me.
The video documents a May 11 trading session where the S&P 500 surged to a new all‑time high of 7,412, prompting the creator to run several pre‑programmed bots alongside his routine manual spreads. He walks through each bot’s performance: the 15‑minute opening‑range...
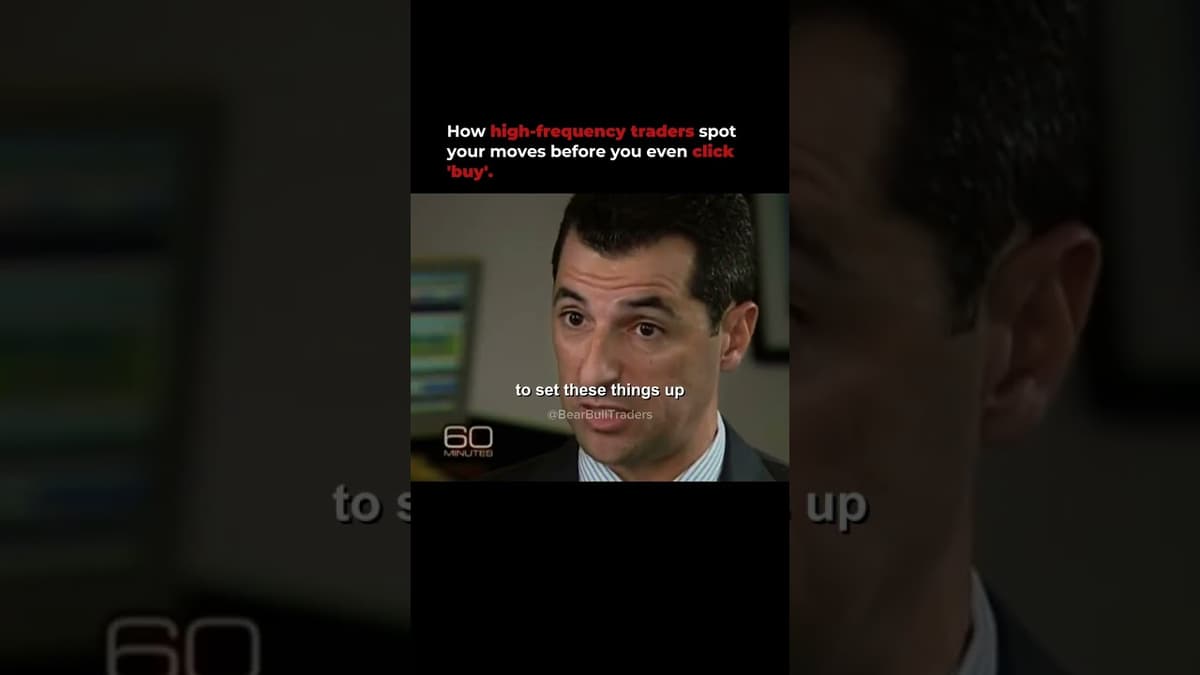
The Secret Advantage Behind Wall Street Trading.
The video exposes how high‑frequency traders gain a hidden edge by processing market data milliseconds ahead of ordinary participants. By colocating servers inside exchange data centers and subscribing to ultra‑low‑latency feeds, firms can observe order flow in microseconds. That split‑second lead,...
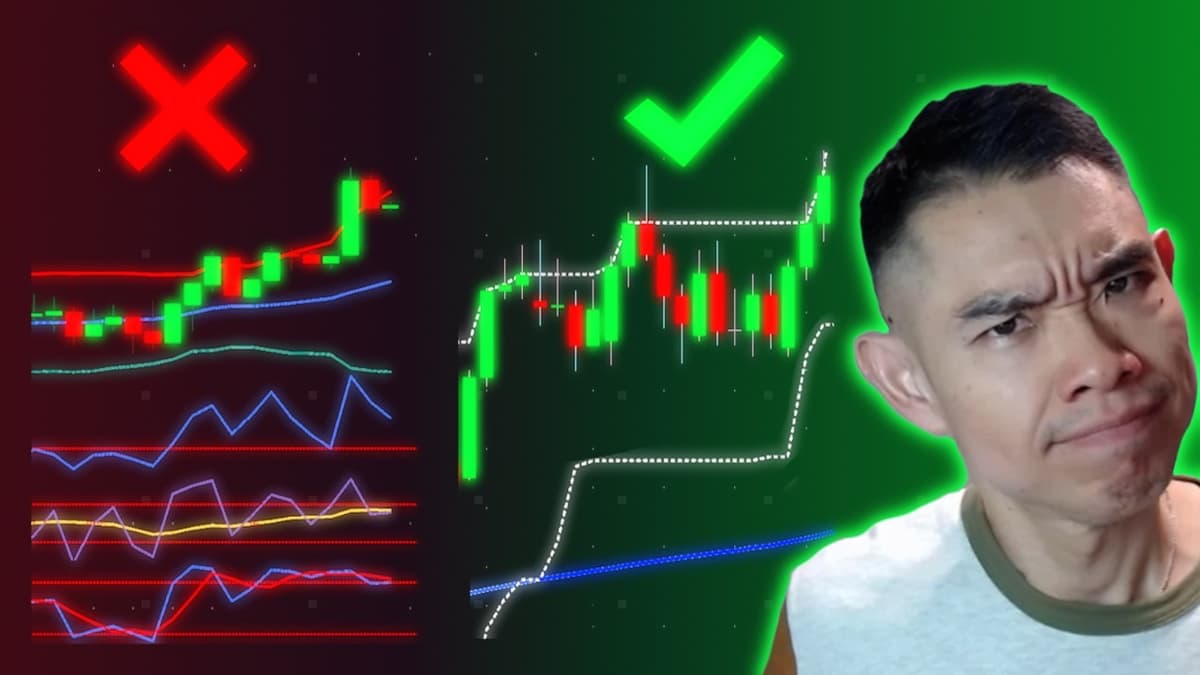
Technical Analysis Is Hard Until You See This
The video tackles the common frustration that traders feel when technical analysis feels like a maze of indicators and patterns, promising a “truth” that most never hear. It argues that 95% of traders lose because of information overload, conflicting signals, analysis...
Bazaar: The Most Comprehensive Show On Stock Markets | Full Show | May 14, 2026 | CNBC TV18
The CNBC TV18 “Bazaar” segment unexpectedly pivoted to a brief tutorial on command‑line file management, with host John walking viewers through essential Linux commands. He demonstrated “ls” for listing directory contents, noting the “-a” option reveals hidden files. He then covered...
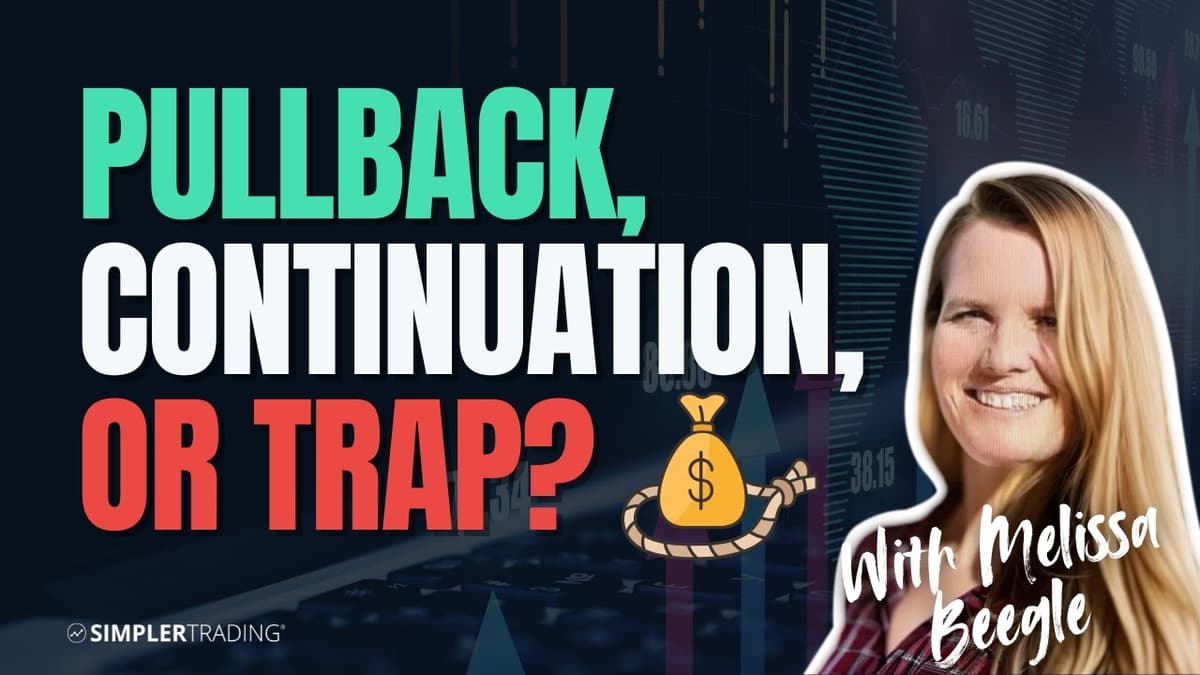
Big Move… Now What? How to Spot the Pullback, Continuation, or Trap
The video walks traders through a systematic approach to handling the market after a strong rally, using the recent seven‑week S&P 500 surge as a live example. Melissa explains why many traders lose profits in these periods—either by chasing the...
Michael Burry Says AI Boom Looks Like a Car Crash. The Options Math on SMH Is Stranger Than That.
The video centers on Michael Burry’s stark warning that today’s AI‑driven market frenzy resembles a car crash about to happen, using the semiconductor ETF SMH as a case study. Burry argues that Wall Street’s earnings forecasts are overly optimistic, inflating...

This Technical Trader Ignores the News, Only Follows Price. Here's What the Charts Are Showing Now.
The video features technical trader Chris Vermillion, who argues that market direction should be read from price action alone, not from news, economic data, or geopolitical events. He emphasizes that AI‑driven technology stocks are the primary engine lifting the S&P...
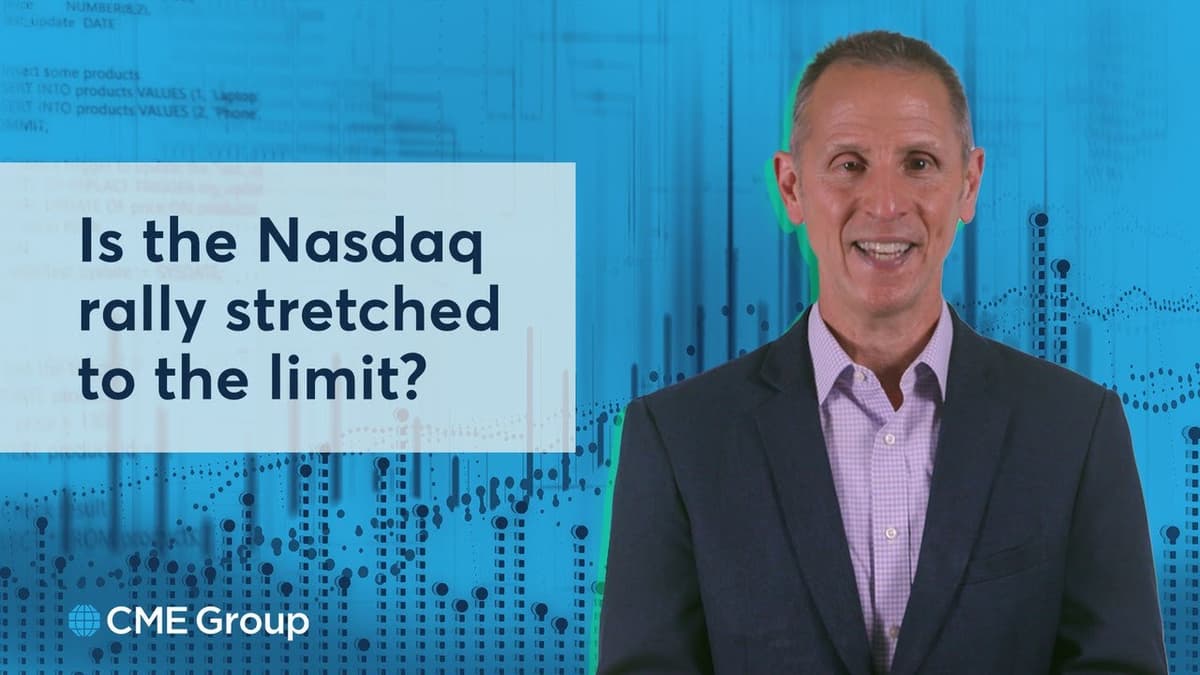
Is the Nasdaq Rally Stretched to the Limit?
The video warns that the Nasdaq’s recent vertical rally has pushed the index roughly 7.5–8.5% above its 50-day exponential moving average, a historical “extension” zone that has often preceded volatility, stalls or pullbacks in 2022, 2024 and 2025. The presenter...
JENSEN IS GOING TO CHINA - MAY 13 - Stock Market LIVE, Live Trading, Stock News
NVIDIA CEO Jensen Huang’s visit to China on May 13 provided an overnight market spark, though details won’t emerge until later, leaving traders cautious heading into the U.S. session. Domestic data surprised to the downside as producer prices weakened, raising...
Markets Now Closes 5/13 Corn, Soybeans Extend Gains Pre-China Summit, Wheat Sees Profit Taking: Catt
The Markets Now segment focused on the latest moves in U.S. grain and livestock markets as traders brace for the upcoming China summit and digest a surprising USDA production adjustment. Corn futures extended gains, breaking the $5 barrier and testing...
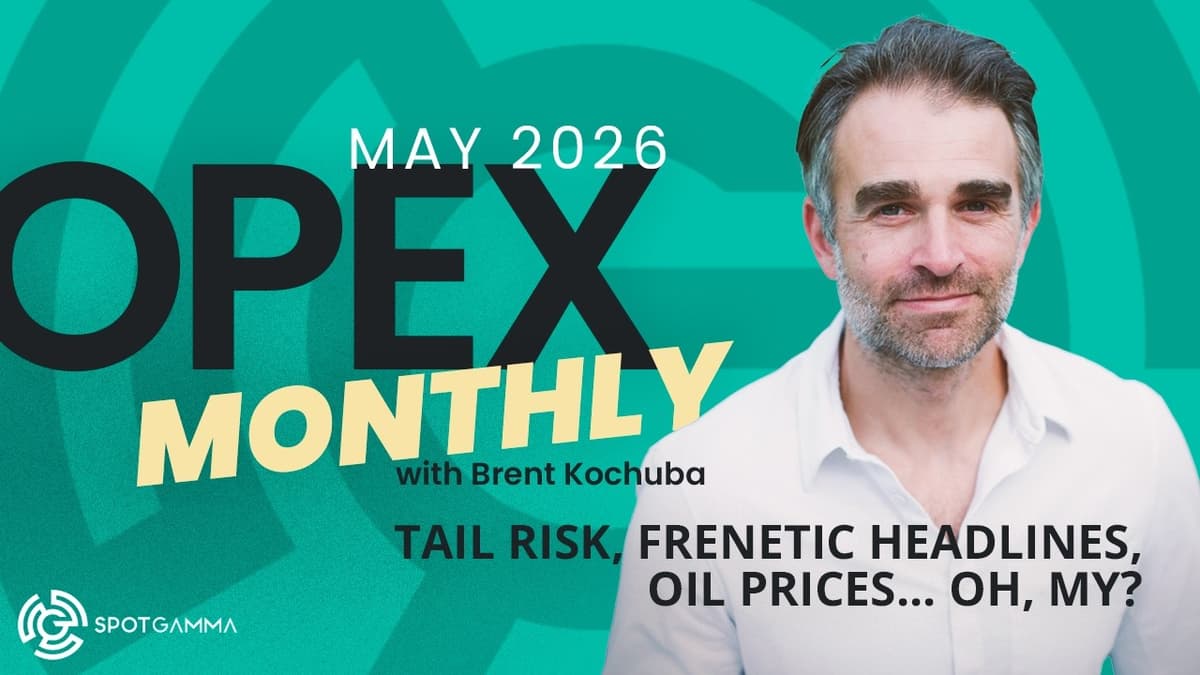
May OPEX (Options Expiration) Live with Brent Kochuba | SpotGamma
Brent Kochuba said this is OPEX week and described a market shift from high equity correlation driven by Iran/oil fears to a risk-on, AI-led rally after strong earnings and a ceasefire narrative. Options scanners show calls rich versus puts in...
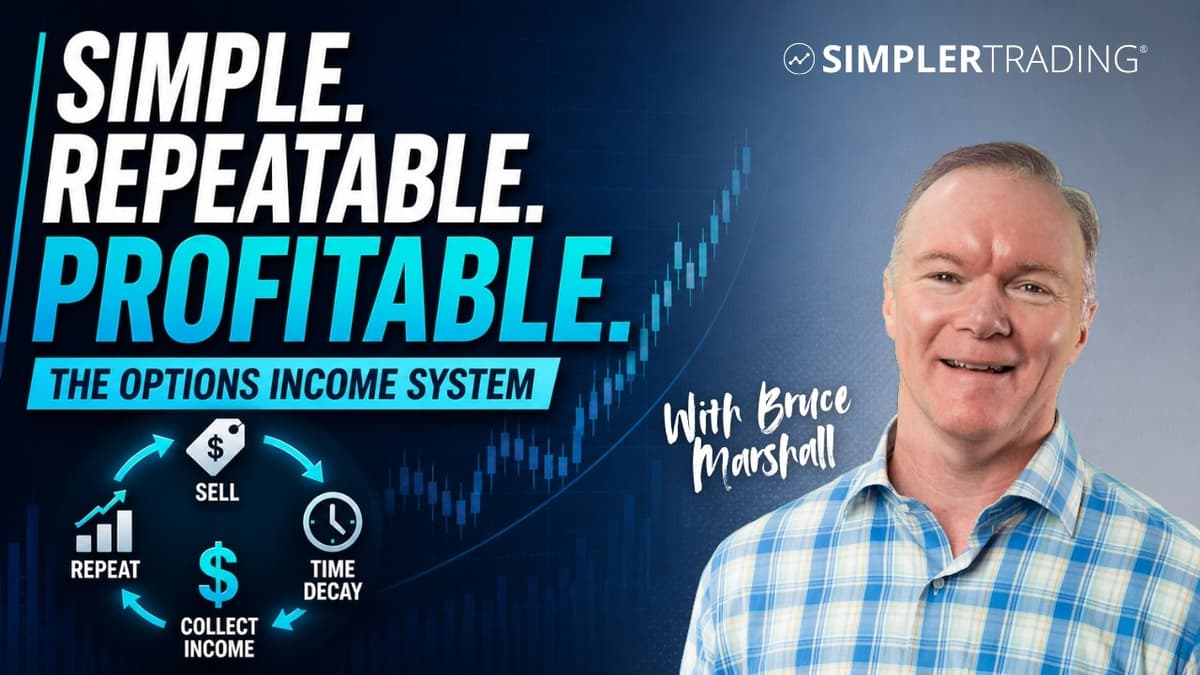
How to Generate Consistent Income From Options (Even in a Volatile Market)
In the video, veteran trader Bruce Marshall explains how to generate steady income by selling options, a strategy that works whether the market is rising or falling, even during heightened volatility. He emphasizes that option sellers benefit from time decay (theta)...
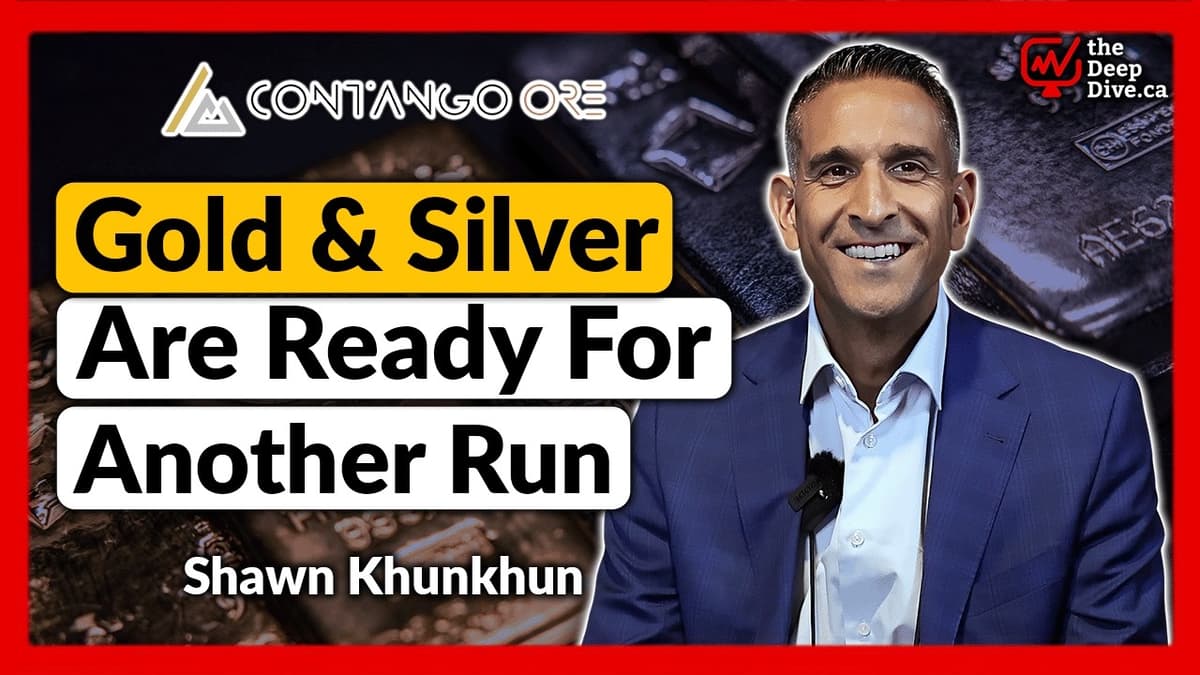
Gold and Silver May Be Ready for Another Run | Shawn Khunkhun - Contango Silver & Gold
In a recent interview, Shawn Khunkhun of Contango Silver & Gold discussed the recent volatility in gold and silver markets and outlined the company’s post‑merger strategy after the March combination of Dolly Varden and Contango. Khunkhun noted that silver has risen...
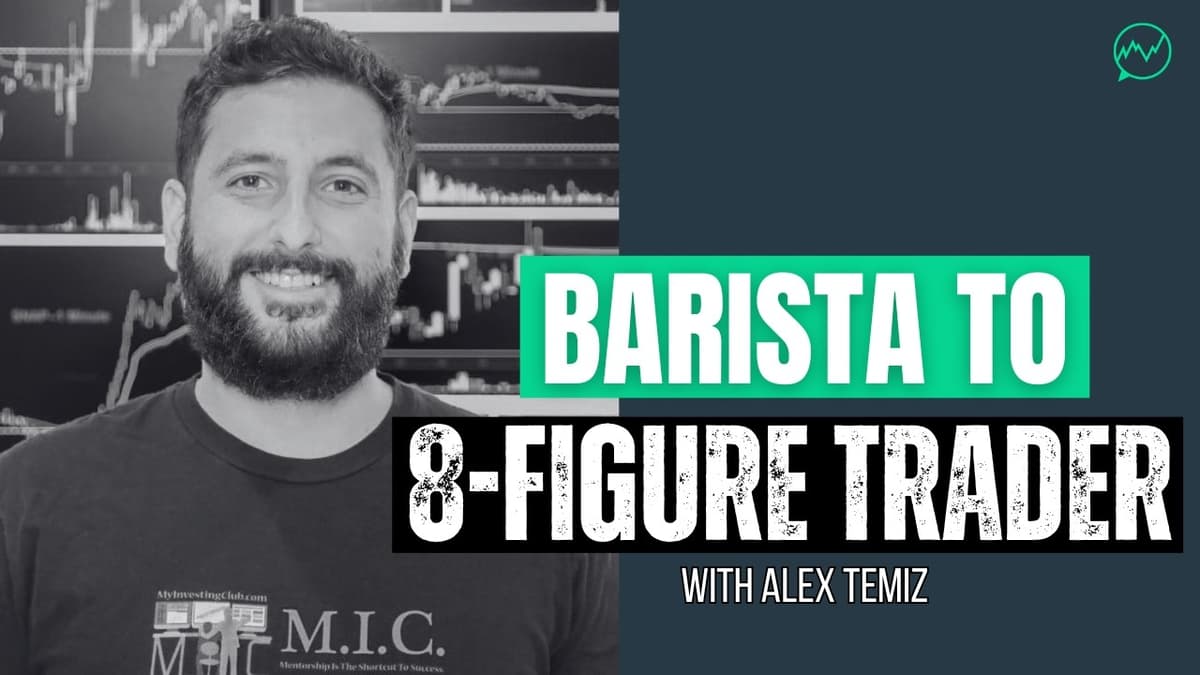
Starbucks Barista to 8-Figure Short Selling Strategy · Alex Temiz
The interview chronicles Alex Temiz’s transformation from a Starbucks barista funding a $2,000 account to a professional trader specializing in short‑selling low‑float, small‑cap momentum stocks. He emphasizes how early struggles forced him to adopt hard‑wired risk controls—auto‑liquidation at a $5,000...
![[LIVE] Pre-Market Prep – PPI Inflation Report Live Market Reaction](/cdn-cgi/image/width=1200,quality=75,format=auto,fit=cover/https://i.ytimg.com/vi/vjDR9J1WBFk/maxresdefault.jpg)
[LIVE] Pre-Market Prep – PPI Inflation Report Live Market Reaction
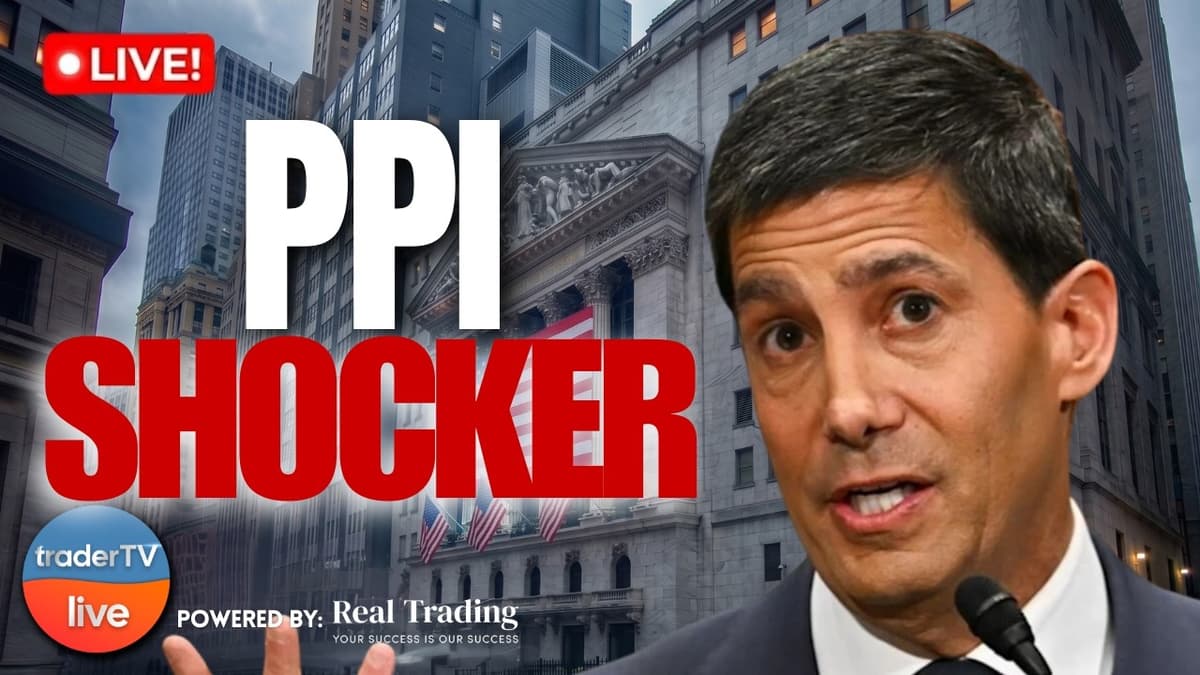
The live pre‑market briefing centered on today’s Producer Price Index (PPI) release at 8:30 a.m., positioning it as a follow‑up to yesterday’s hotter‑than‑expected CPI data. Host Jamie Demon walked viewers through the economic calendar, noting that the PPI will likely echo...
Inflation Double Blow🚨 PPI Jumps as Stocks Slide on Rate Hike $NVDA China Invite | Stock Market Live
The video is a live‑trading broadcast that opened with a market update after the latest Producer Price Index surprise and the Federal Reserve’s rate‑hike signal, noting a broad sell‑off that left the S&P 500 and Nasdaq dipping. The hosts zeroed in...
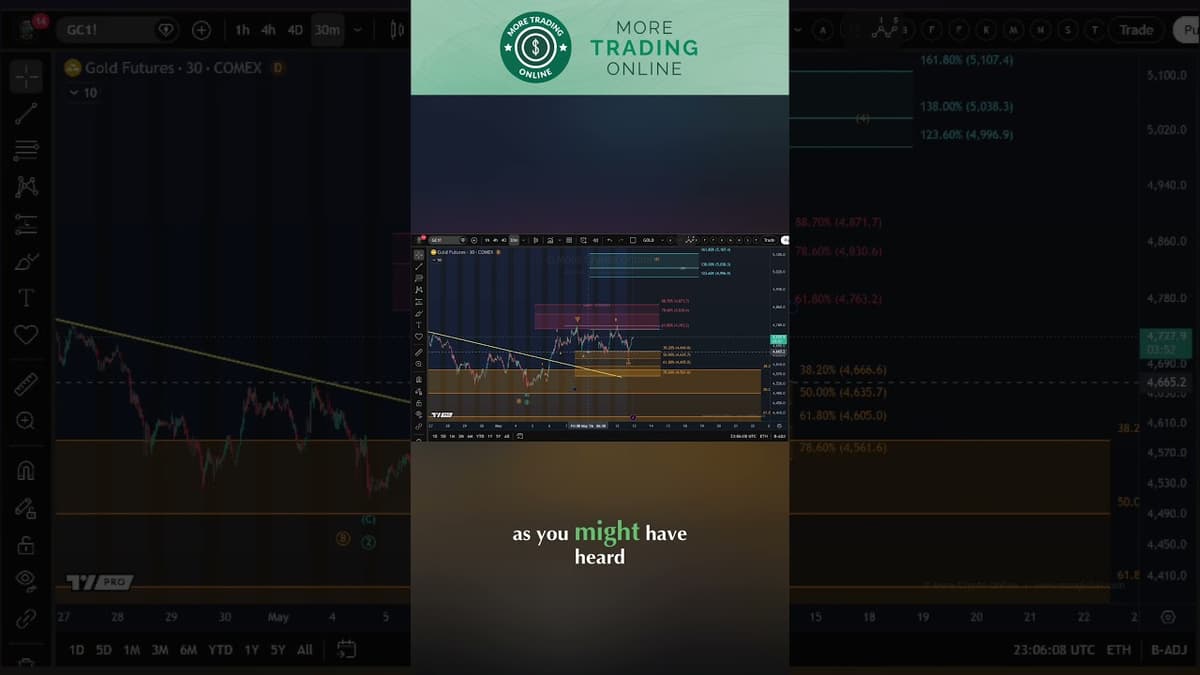
Gold Analysis - Upside Reversal Unfolding?
The video provides a technical analysis of gold, focusing on today’s price action that briefly slipped below Monday’s low before retaking the primary support zone around $4,645. The analyst frames the dip as a liquidity grab and questions whether it...
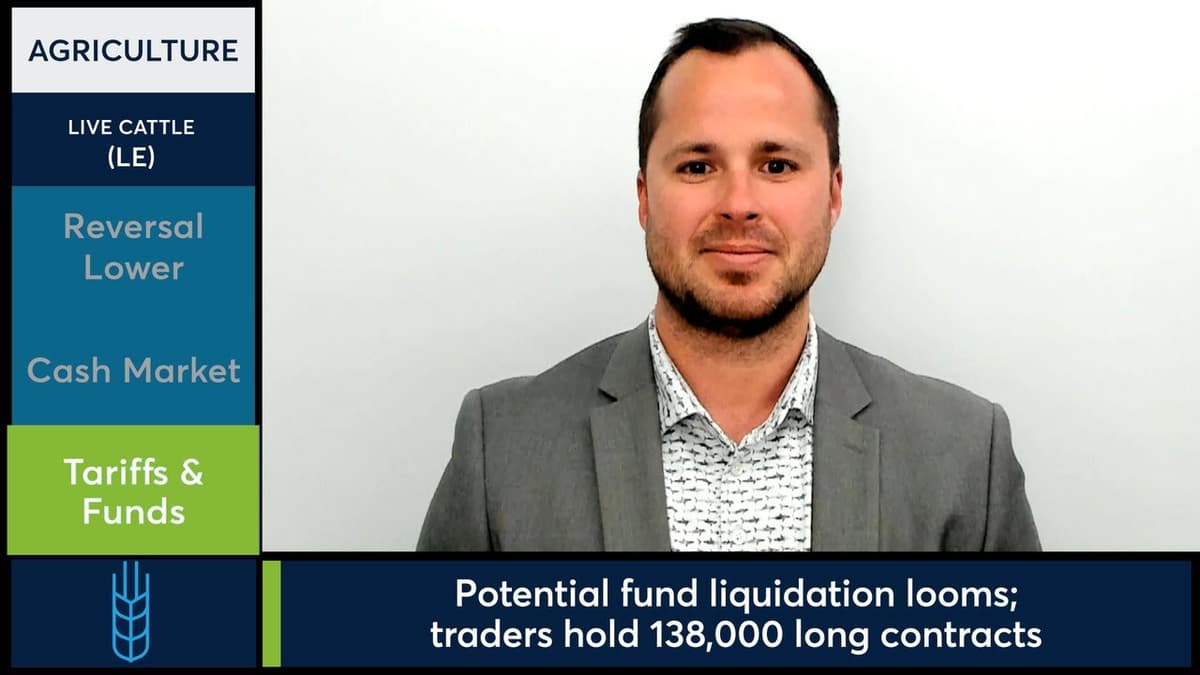
Live Cattle Futures Faded After an Early Gap Higher. 5/12/26
Tuesday’s live cattle market opened with a pronounced gap higher, only to reverse and finish lower by the close. The June contract slipped $1.70 to $2,477.70, while the August contract fell $2.47 to $2,401.07. Feeder cattle were volatile, dropping $5.75 to...
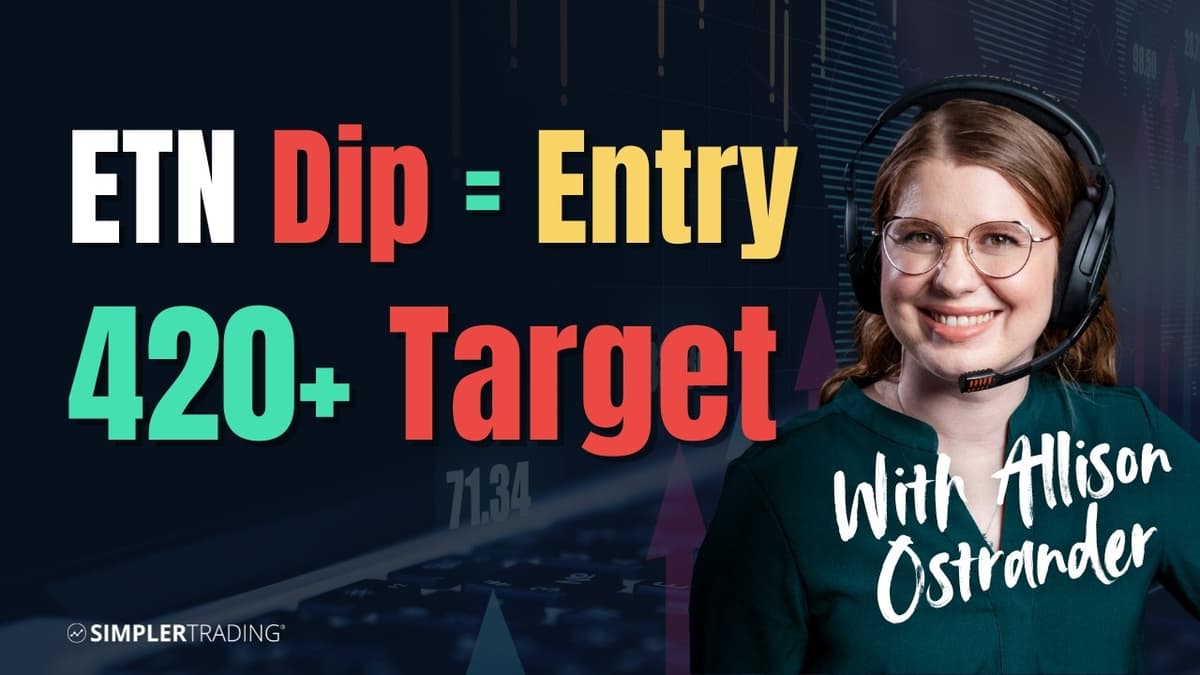
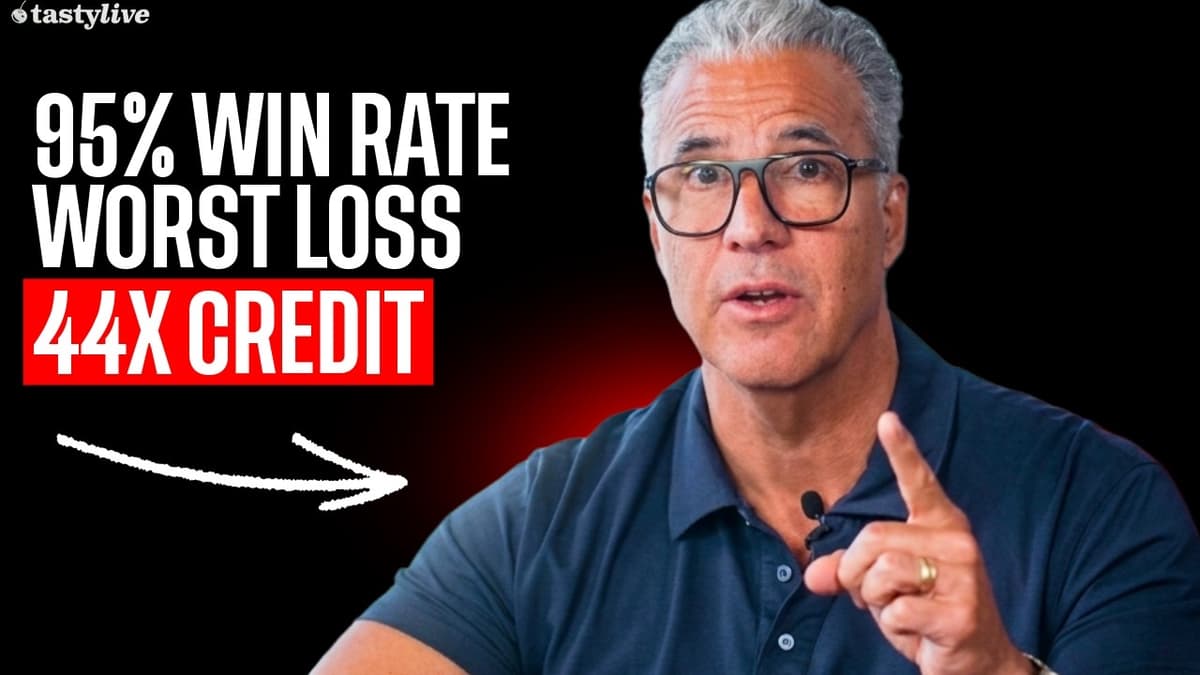
This ETN Setup Has a 9.5/10 Win Rate (Here’s Why)
In a recent Simpler Trading video, director of risk tolerance Allison Ostrander outlines a high‑probability options play on ETN, centering on a bullish divergent bar pattern that historically drives the price back above its high within three bars. Ostrander notes ETN’s...
Becoming a Profitable Trader 📈 #Shorts
The short video recounts a trader’s journey from college‑era energy‑stock bets during the 2008 financial crisis to a disciplined, profitable approach. He explains that early success on long positions turned into losses when the market pivoted, forcing him to learn short‑selling....
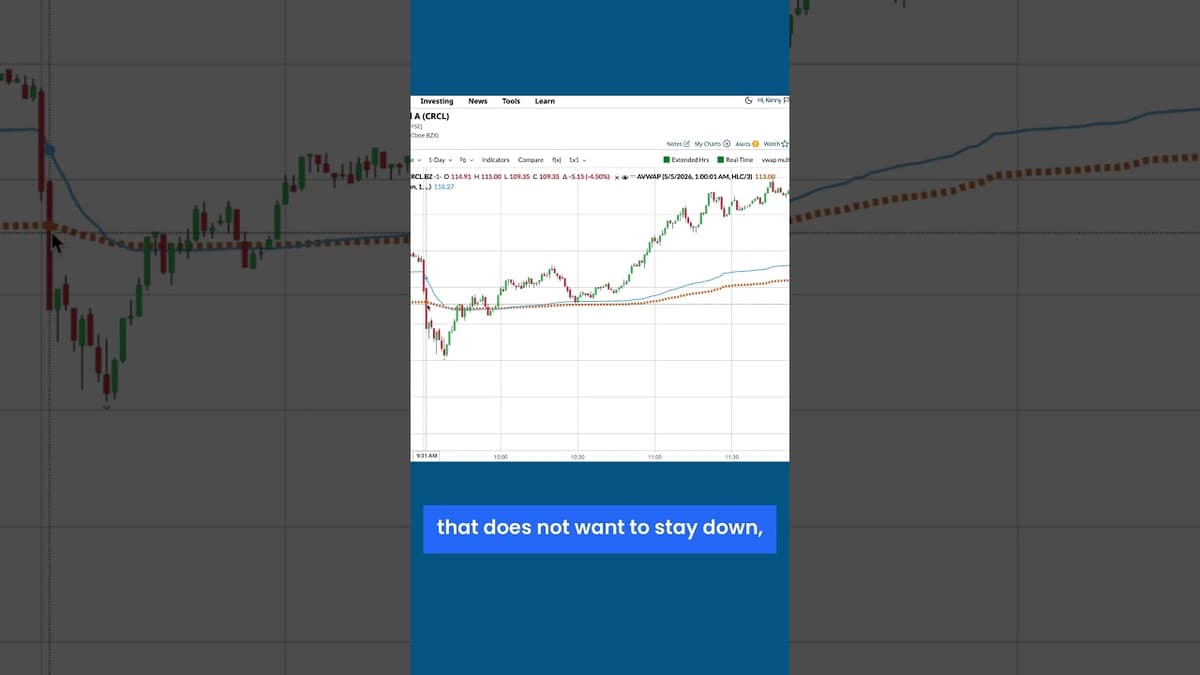
Terrorize the Shorts with This 90-Second Day Trade Setup #stocks #crcl #trading #vwap #daytrading
The video walks viewers through a 90‑second day‑trade setup that hinges on earnings‑gap stocks and the volume‑weighted average price (VWAP). Kenny Glick explains how he isolates one or two names after earnings releases, watches the stock gap up, and then...
How to Find Winning Stocks Using Barchart's Top Stock Picks
Barchart’s Top Stock Picks service is a nightly‑run, algorithm‑driven screen that surfaces stocks generating fresh technical buy or sell signals before they post large price moves. The engine scans for moving‑average crossovers, MACD flips, momentum and relative‑strength triggers, then applies strict...
WARNING: The 18-Year Market Cycle Is ENDING. AI Bubble CRASH Imminent?
Gareth Soloway, chief market strategist at Verified Investing, warns that the 18‑year secular bull market – driven by the post‑2008 liquidity surge, cloud computing and the AI boom – is reaching its terminus this year. He points to the S&P...
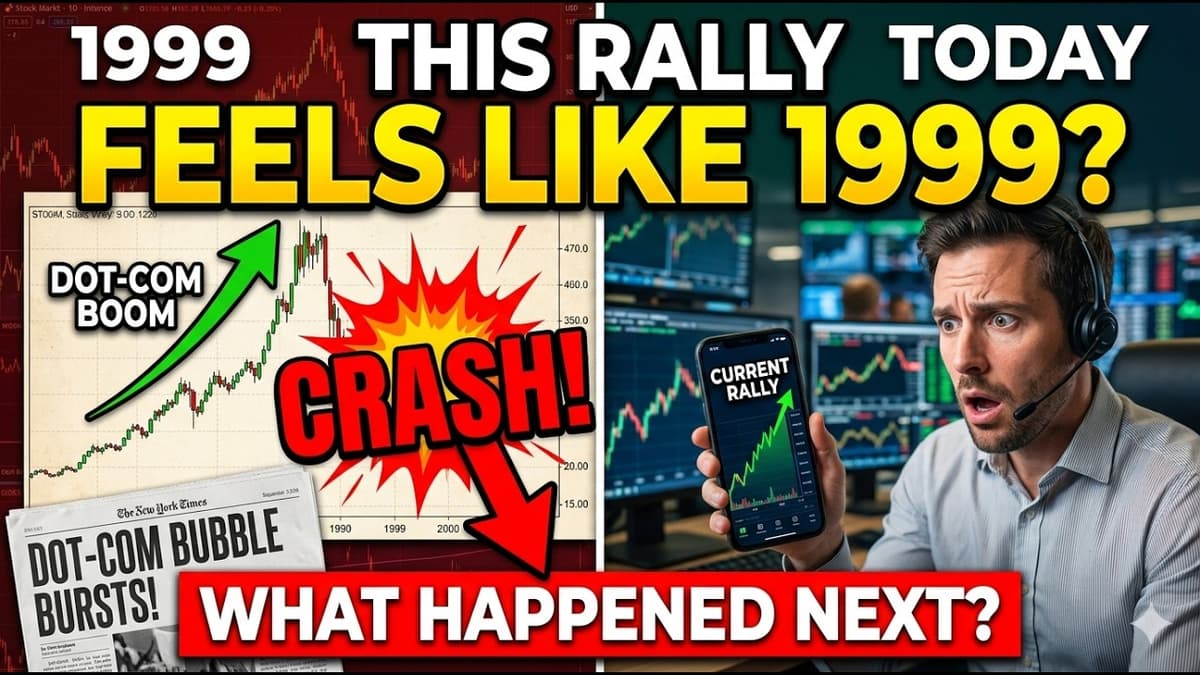
This Rally Feels Like 1999 Here's What Happened Next
The video warns that the S&P 500’s new all‑time high is being driven by AI hype, drawing a parallel to the 1999 dot‑com boom. While companies like Nvidia, Microsoft, Amazon and Micron post strong profits and revenue growth, overall market breadth...
Stop Selling Zero DTE Options Just Because the IV Is High. Here's What It Actually Costs You.
The video explains how an options trader’s account size, not the underlying stock, determines which strategies are appropriate. Using a back‑testing tool on Tesla, the presenter compares a naked 30‑delta put (45‑day expiry) with a defined‑risk short put spread. The naked...
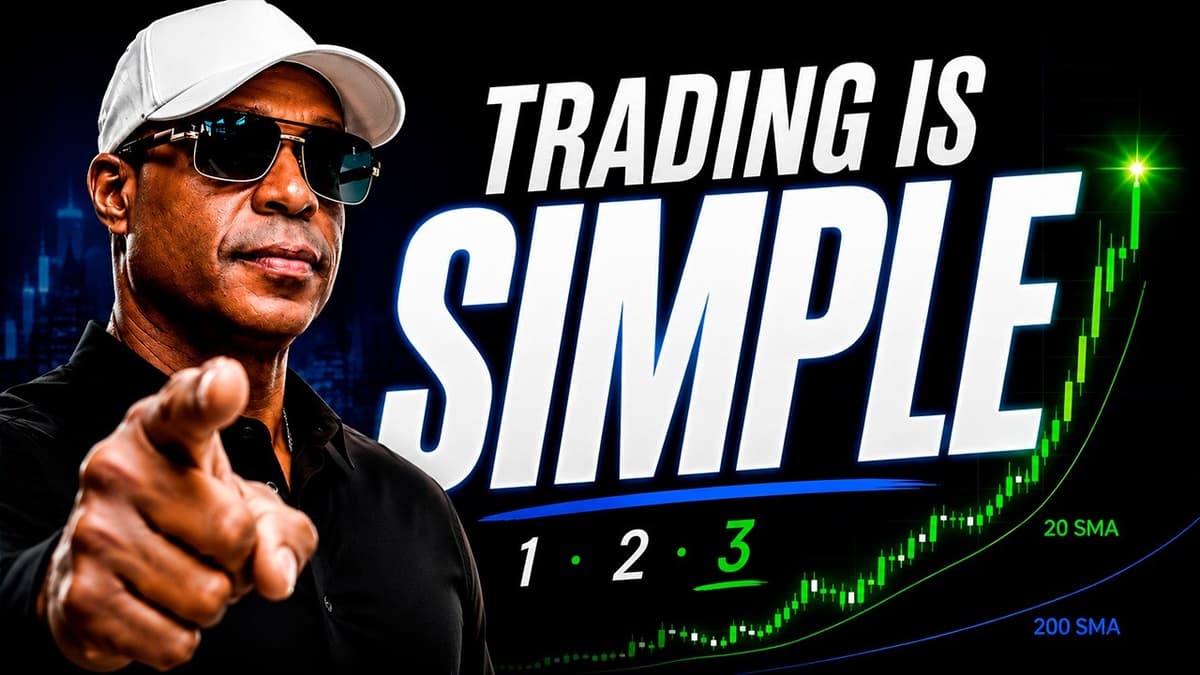
Trading Is Easier Than Counting to 3
Oliver frames trading as a three‑step process, arguing that success hinges on recognizing market states rather than mastering endless indicators. He emphasizes that every chart should display two simple moving averages—the 20‑period and the 200‑period—and that these lines function as...
How The Big Boys Are Getting You
The video explains how large institutional traders, dubbed "big boys," engineer short-term price moves to accumulate large positions by exploiting liquidity and retail behavior. They use relationships with brokers to nudge spreads and create artificial waterfalls that trigger retail stop-losses,...
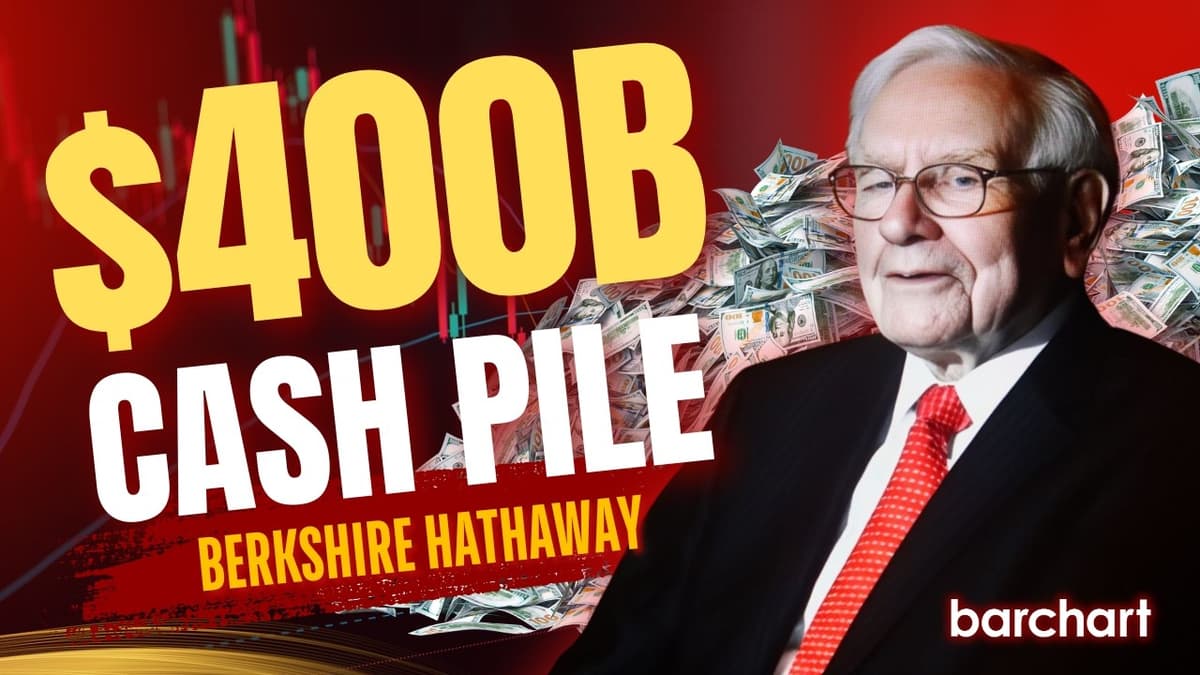
Berkshire Hathaway: Buy the Dip or Avoid the Trap? 🪤💎 #barchart #investing #buffett #stocks
The conversation centers on Berkshire Hathaway’s recent underperformance and whether investors should buy the dip or wait. Despite a roughly 5% year‑to‑date decline, the conglomerate’s biggest positions—Apple, American Express, Coca‑Cola, Chevron and others—are delivering returns that beat the S&P 500. Panelists note...
The Market Moved 200 Ticks in Seconds
The video dissects an extreme oil price swing that unfolded on a 5‑second chart, where the commodity dropped roughly 200 ticks in just ten seconds after a market comment. The host highlights how the move appeared as a smooth downward trend,...
🚨 Will This Week’s Inflation Data Spark a Stock Market Rally or Selloff? Find Out LIVE at 8:00pm ET
The livestream titled “Will This Week’s Inflation Data Spark a Stock Market Rally or Selloff?” opened with host Jimmy greeting viewers, celebrating Mother’s Day, and framing the week’s focus on the upcoming U.S. inflation release and its potential to move...
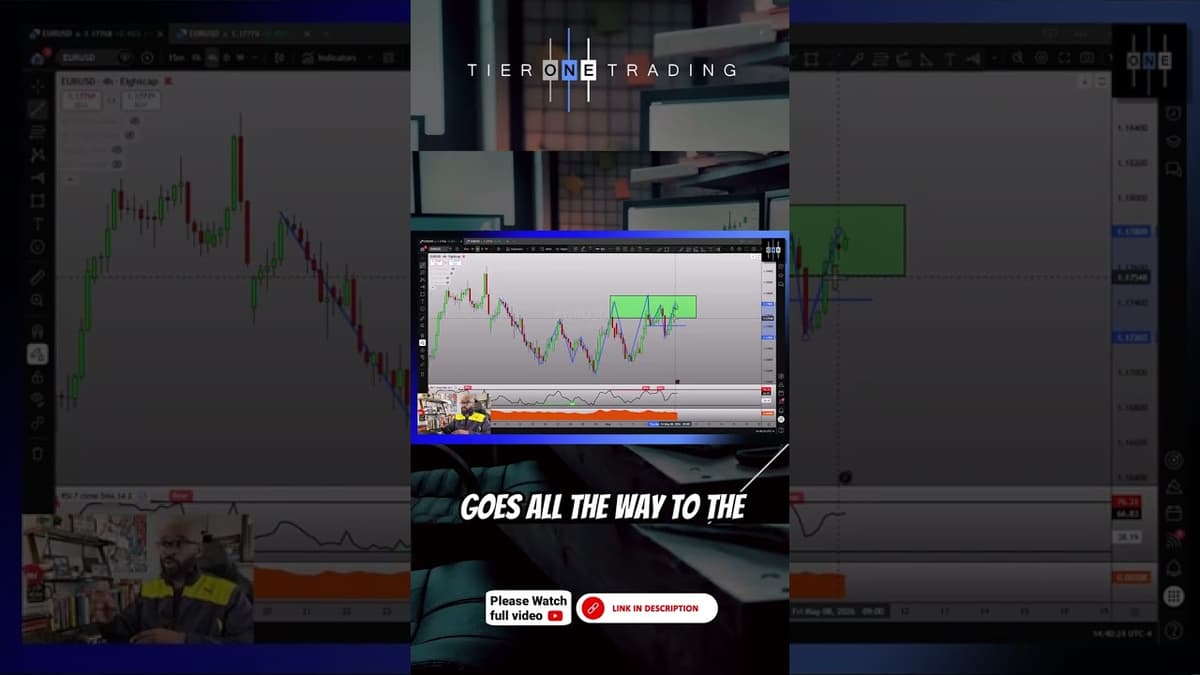
EURUSD Technical Breakdown For The Week Ahead
The video dissects EUR/USD on the Eurodollar 4‑hour chart, focusing on a repeat test of a previous high and the formation of a classic double‑top that could dictate the pair’s direction for the coming week. The analyst notes a sequence of...
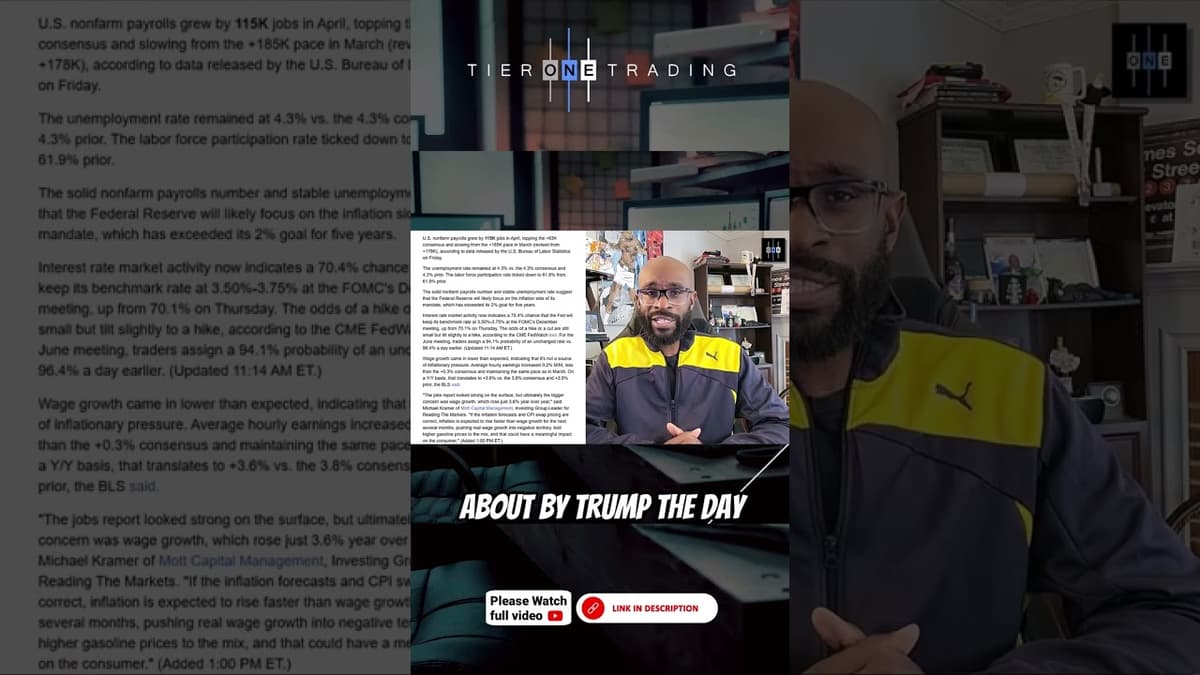
Traders Expected Chaos… But THIS Happened
Friday’s non‑farm payrolls, traditionally a market catalyst, delivered a surprising 115,000 jobs gain, far exceeding the 65‑73k range analysts had penciled in and well below the 150‑200k considered a healthy baseline. Despite the shock, equity and currency markets showed little lasting...
Most Options Traders Think Low Delta Strangles Are Safer. 11 Years of Data Says Otherwise.
The video challenges the common belief that ultra‑low‑delta option strangles are the safest way to collect premium. Using more than a decade of back‑tested data, the presenter shows that the tiny credits earned by 5‑delta strangles mask disproportionate tail risk. The...
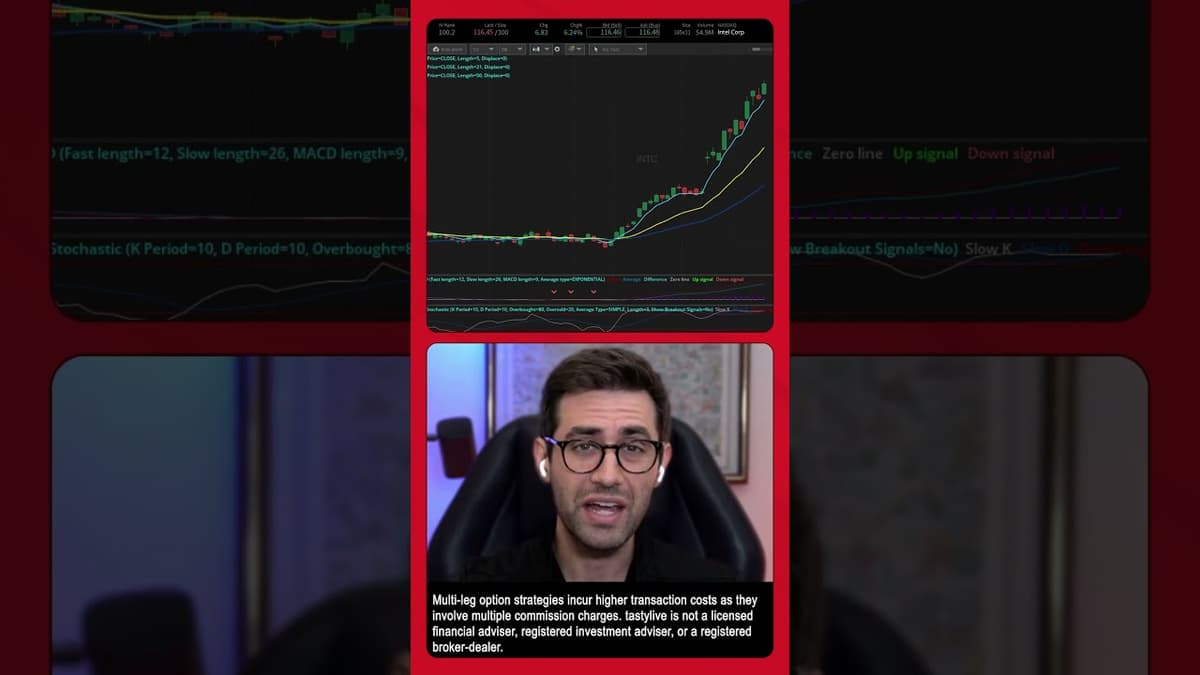
Intel Doubled in a Month. Options Flow Says More Upside.
Intel’s shares have surged dramatically, trading around $116—up more than 25% in the past week and roughly doubling over the last month, placing the stock at the top of its 52‑week range. The rally is accompanied by aggressive options buying. Traders...
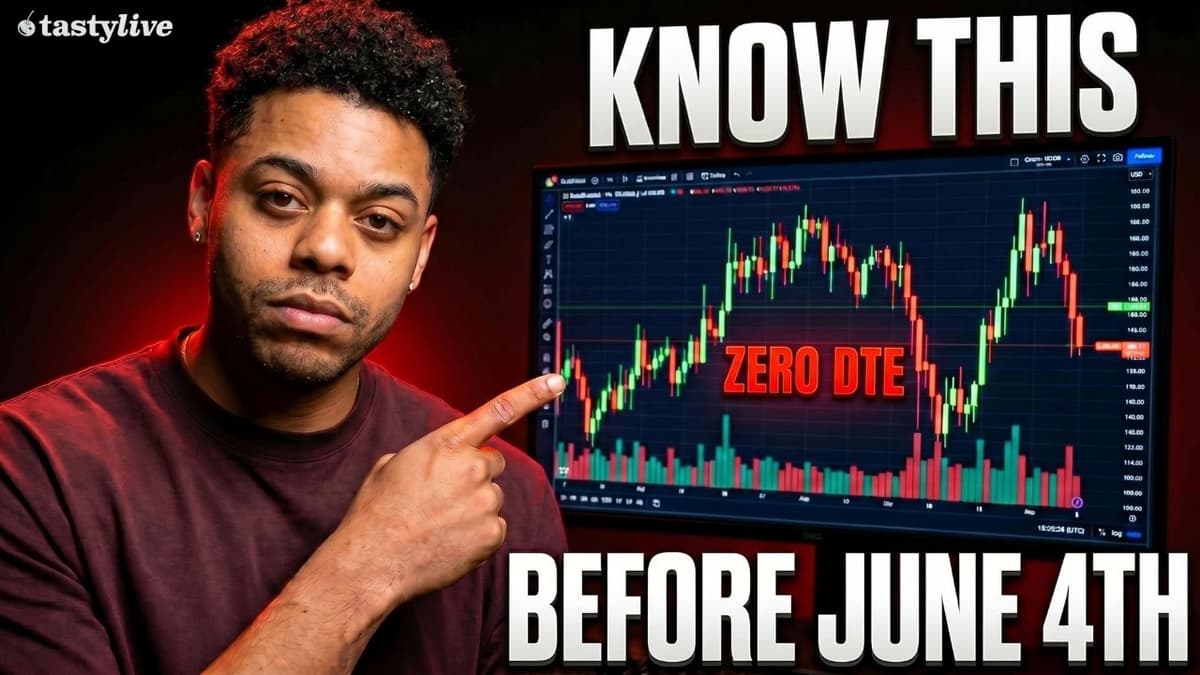
This 6-Minute Video Will Teach You the Zero DTE Risk Every Trader Needs to Know Before PDT Ends
The video centers on the imminent abolition of the Pattern Day Trader (PDT) rule on June 4, which will lower the equity minimum from $25,000 to roughly $2,000. The host explains how this regulatory shift will unleash a wave of short‑term,...
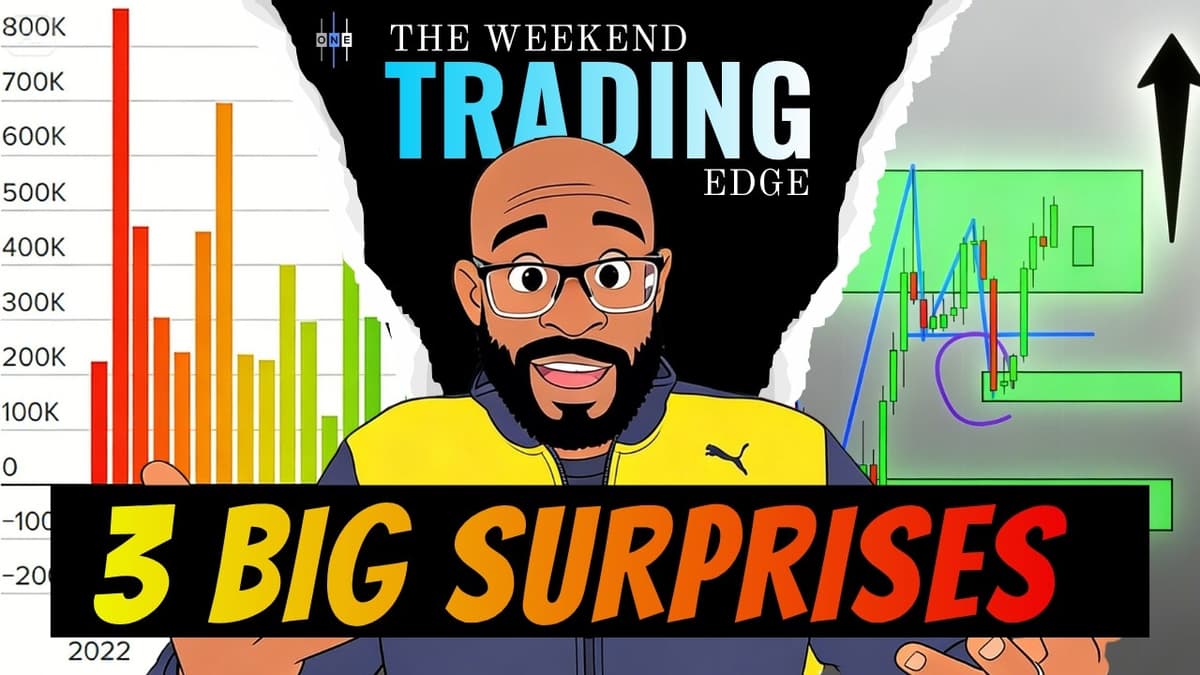
Trading Edge Weekly: The Best Forex, Stocks & Gold Setups Right Now
In this weekly Trading Edge episode, host Kill Stokes reviews the market’s reaction to Friday’s non‑farm payrolls and outlines his top forex, stock and gold setups for the coming week. While the jobs number surprised to 115, well above the...
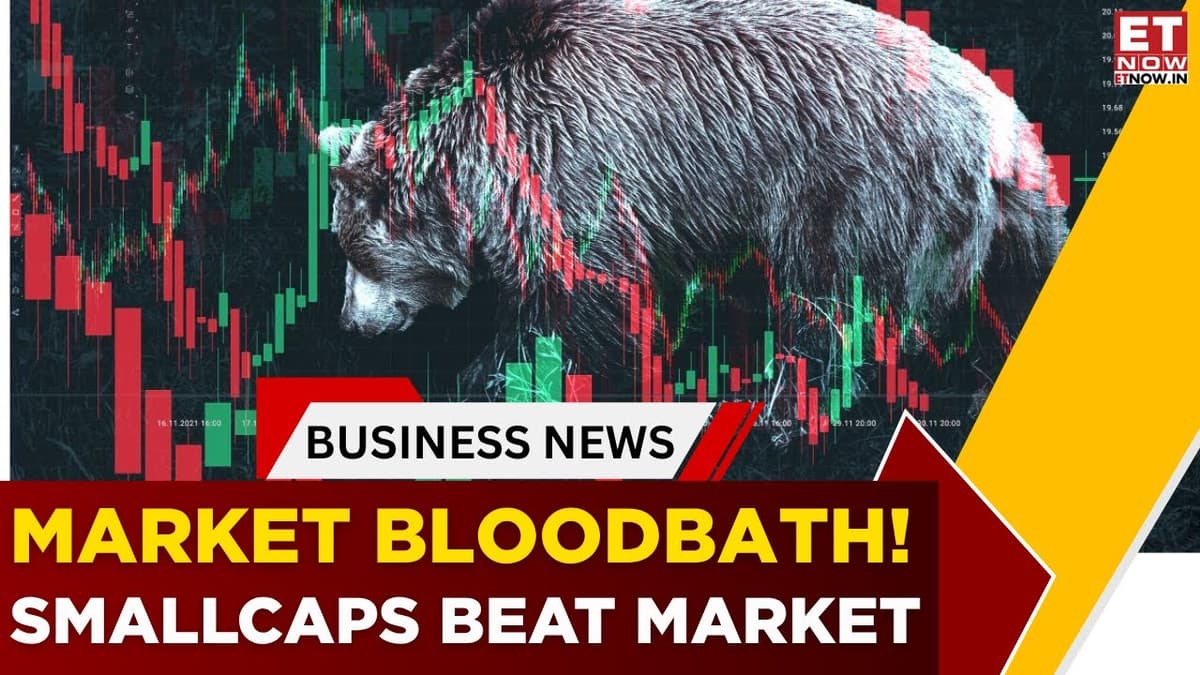
Why Are Markets Falling Despite Strong Smallcap Earnings Growth? | Market Bloodbath Continues
The video dissects why Indian equity markets are slipping even as small‑cap earnings surge. Analysts review the latest results from Titan, State Bank of India (SBI) and solar‑panel maker Vikram Solar, then gauge the broader index reaction. Titan posted revenue in...
Most Traders Use Moving Averages on Their Charts. Tom Preston Adds This Instead.
The video introduces implied volatility (IV) charts as a complementary tool to traditional technical studies, showing how option‑market expectations can be visualized directly on price charts. Tom Preston demonstrates adding the IV indicator for IBM, Tesla, and the IWM ETF,...
The Fibonacci Golden Zone Setup That Predicts Reversals
The video introduces a Fibonacci‑based “golden zone” setup designed to pinpoint price‑action reversals with high probability. By resetting the Fibonacci tool to the ratios 0, 0.706, 0.618, 1 and 0.79, three key levels emerge that define the golden zone. Traders first...
Only Bulls Can Stop Bulls
Sam delivers his weekly market review, focusing on the steep, historic rally in the SPY and the broader bullish alignment across daily and weekly timeframes. He notes that without a meaningful pullback, the system’s signals remain unchanged, and a weekly...