Markets SLOWING DOWN Ahead of PCE Inflation
The Trade Brigade Midweek Show focuses on a modest slowdown in index‑level activity as markets await tomorrow’s PCE inflation report, alongside a slew of macro data releases. Despite a temporary dip in semiconductor momentum, the S&P 500 (SPY) and Nasdaq 100 (QQQ) remain perched at fresh all‑time highs, with analysts watching key support zones around 743.50 for SPY and 714.65 for QQQ. Matt highlights that today’s daily hammer candle and strong close in the upper third of the range suggest sellers failed to break lower lows, reinforcing a bullish bias. He points to a confluence of technical levels—Fibonacci 38.2%, anchored VWAPs, and the 20‑day SMA—clustered near the aforementioned support points, framing the base case as either a brief consolidation or a continuation rally. Positive catalysts such as Meta’s new paid tier, Snowflake’s earnings beat, and broader tech strength further buttress the upside outlook. A notable quote from the host underscores his stance: “It’s been profitable to stay optimistic in this market until proven otherwise.” He also references market internals—steady volume inflows, a positive advance‑decline line, and a bullish market profile—indicating underlying health despite sector‑specific fatigue. The only tangible threat he flags is a “failed breakout” below the 2‑day balance range, which could trigger a short‑term pullback toward 732.25. Overall, the analysis suggests that unless tomorrow’s inflation and GDP numbers dramatically surprise, the market is likely to maintain its upward trajectory, using higher‑low pullbacks as stepping stones to new highs. Traders are advised to monitor the identified support zones and be prepared for volatility around the data releases, but the prevailing narrative remains one of continued bullish momentum.
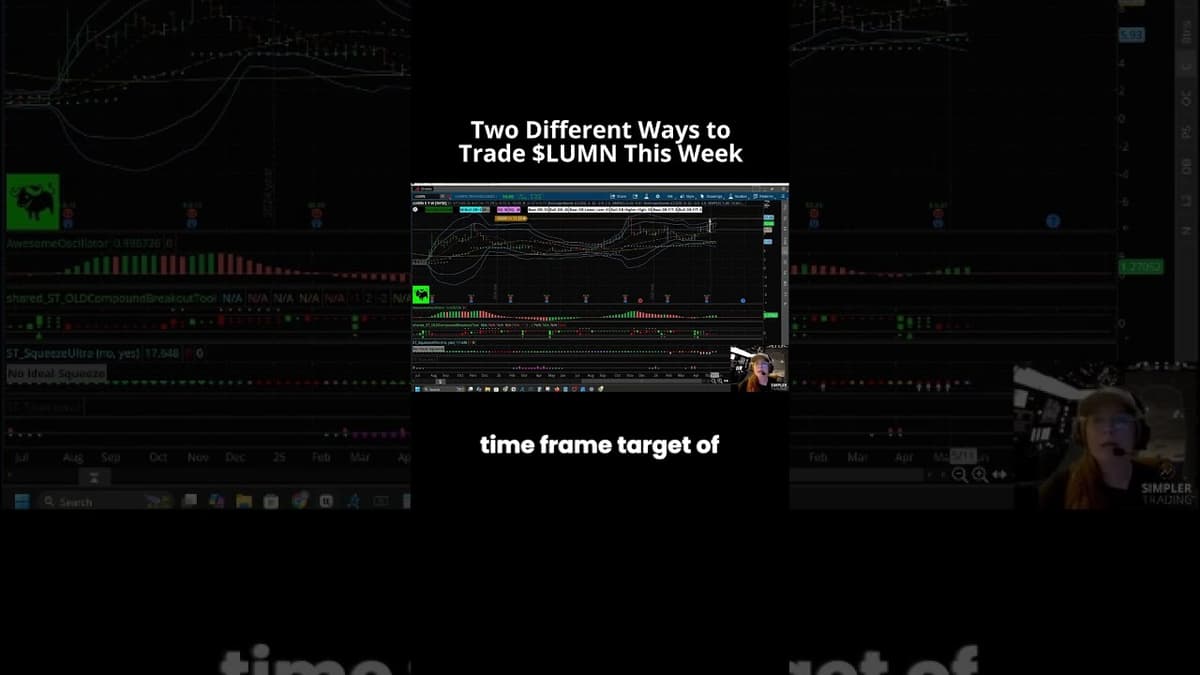
Two Different Setup Ideas in $LUMN 📈 🚀 #Shorts
The presenter identifies a bullish setup in LUMN driven by a recent squeeze, improving momentum, widening Bollinger Bands and a weekly bullish divergent bar targeting $11.29 by the end of next week. They outline two trade approaches: a short-term options...
Is This Trifecta Signaling a Huge Move for AMZN?
Henry’s video uses a top‑down framework, starting with the Dow Jones index, then the consumer‑discretionary sector ETF (XLY), and finally Amazon’s stock. He highlights that Amazon’s recent inclusion in the Dow adds institutional weight and that the Dow’s “diamond” chart...
Yahoo Finance Live: S&P 500, Dow, Nasdaq Rise, Oil Falls Amid US-Iran Talks
U.S. equities pushed higher with the Dow, S&P 500 and Nasdaq flirting with or setting record highs as oil prices retreated amid shifting U.S.–Iran headlines. Gains were led by consumer discretionary and large-cap tech names such as Amazon and Meta,...
Price-Action Is Bearish Even at Records: 3-Minutes MLIV
Despite global stock records, price action is weakening and the market tone has shifted from cautious to outright bearish. The speaker says a narrow AI- and semiconductor-led rally masks widening economic damage and believes the disconnect between frothy equities and...

MU’s Insane Options Run
Micron surged about $144, or 19.3%, to close at $895.88, turning recently out‑of‑the‑money 800 strikes deep into the money amid an extreme intraday rally. Options activity exploded, with 1,000‑strike calls expiring Friday trading roughly 53,000 contracts at an average price...
Tracking the Massive Rally in AMD and Micron
The video spotlights an extraordinary rally in semiconductor giants AMD and Micron, whose shares have rocketed several hundred percent in just a few weeks. The presenter emphasizes that these are not tiny, speculative penny stocks but massive, well‑known companies experiencing...
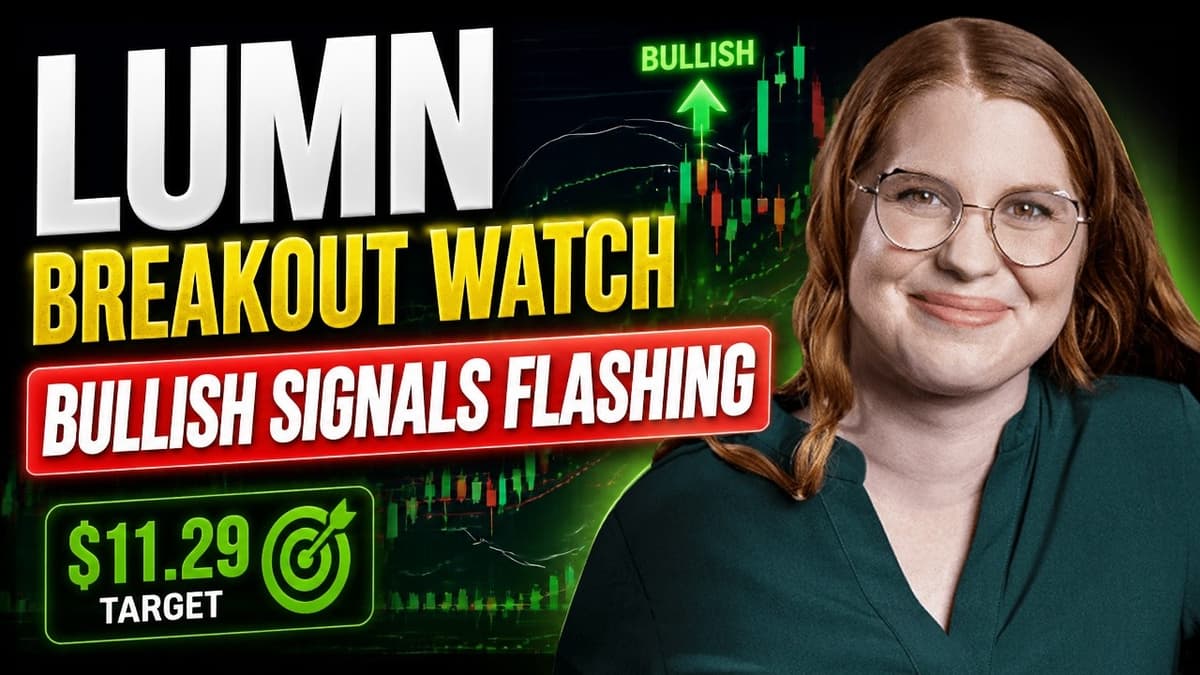
LUMN Squeeze: Can It Hit This Bullish Target?
Allison of Simpler Trading outlines a trade idea on Lumen Technologies (LUMN), focusing on a developing bullish squeeze and a potential price target near $1,129. Technical analysis shows expanding Bollinger Bands and a weekly bullish divergent bar, suggesting momentum reset. The...

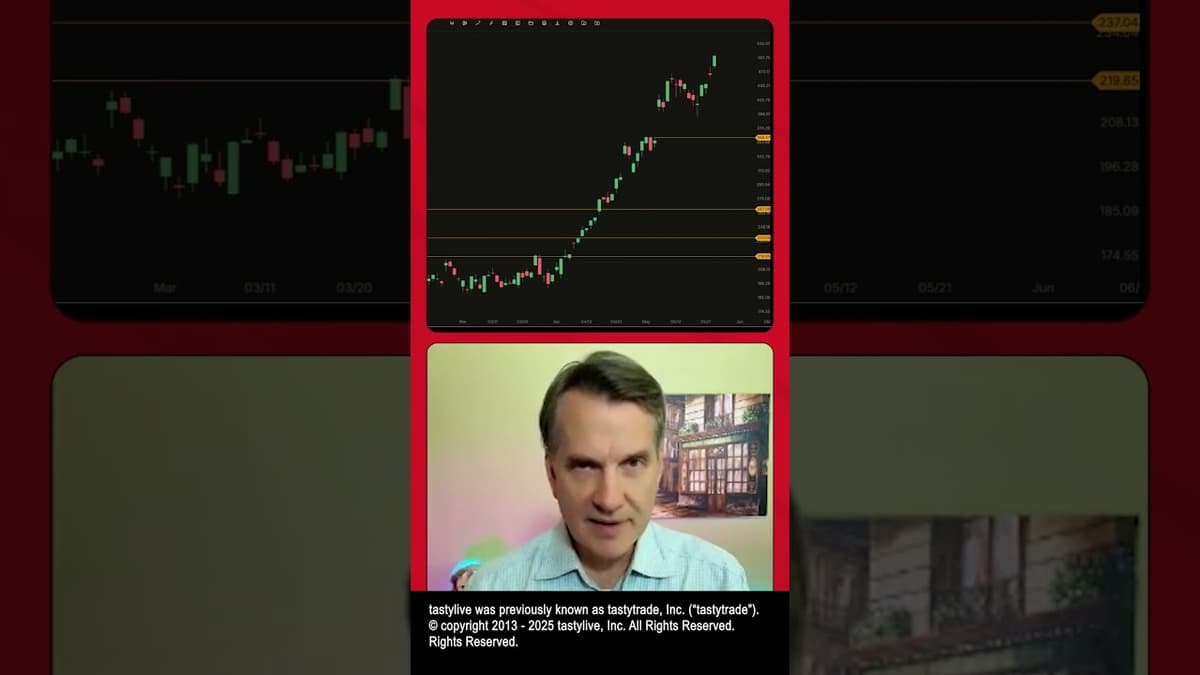
Here's Why Stock Trading May Be Much More Profitable than Forex Trading.
The speaker argues stock trading can be more profitable than forex because equities are less efficient and therefore produce larger, more frequent volatile moves that traders can exploit; forex’s deep liquidity and tight spreads make it harder to capture outsized...
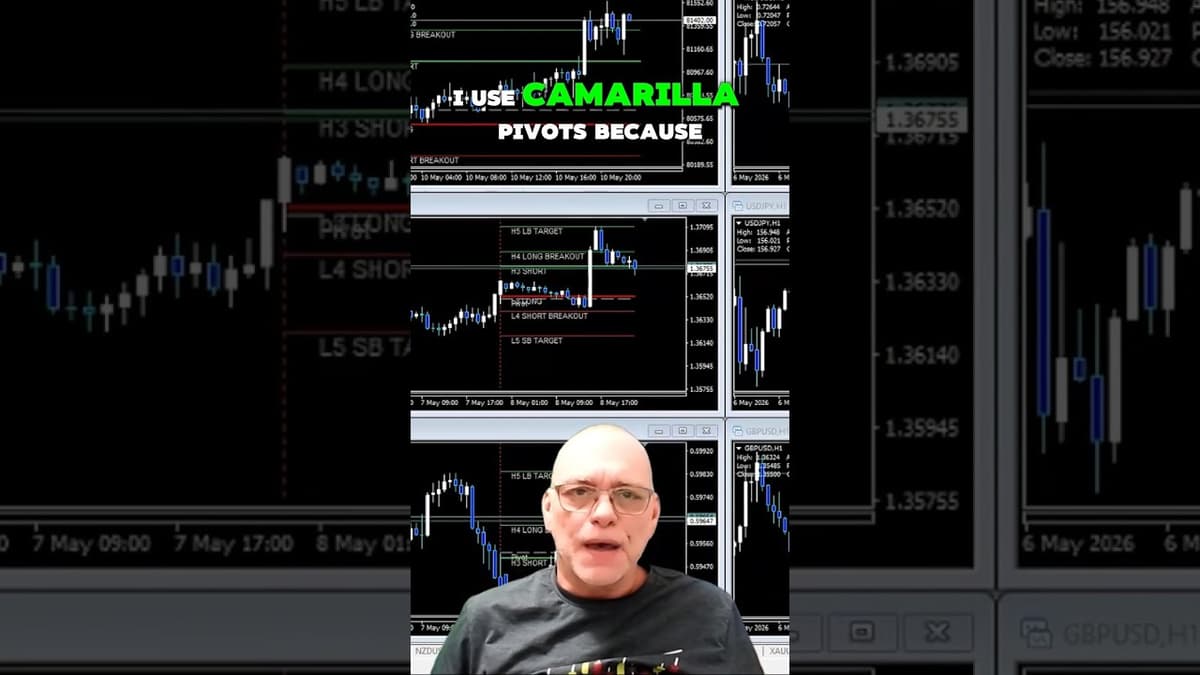
How I Trade Pivot Points Profitably: My Proven Strategy
The video walks viewers through a proven intraday strategy built around Camarilla pivot levels, explaining how each point—H3, L3, H4, L4, H5 and L5—serves a specific trading purpose. The presenter stresses that the pivot itself sets the market bias (short at...
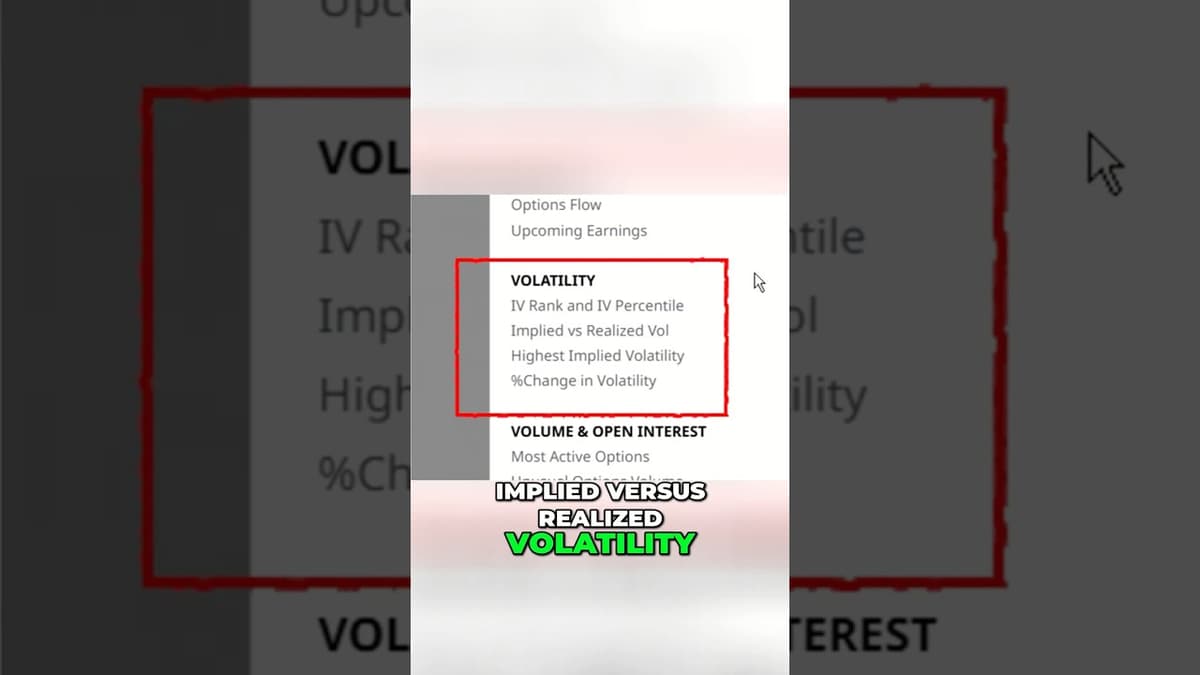
Why Most Options Buyers Get Wrecked by Volatility 🛑#optionstrategy #volatilitytrading #barchart
The video teaches traders how to match option‑type strategies with the right volatility environment, emphasizing that misreading volatility is why most option buyers lose money. For long calls or puts, the presenter recommends entering when implied volatility (IV), IV rank, and...
🚨Stock Market Outlook: Is a Massive Market Move Coming This Week? Find Out LIVE @ 8:00pm ET
The True Trading Group live broadcast, hosted by co‑founder Michael Edward, opened with a Memorial Day tribute before shifting to a detailed market outlook for the coming week. Edward promised to reveal exact entry, exit and price targets for a...
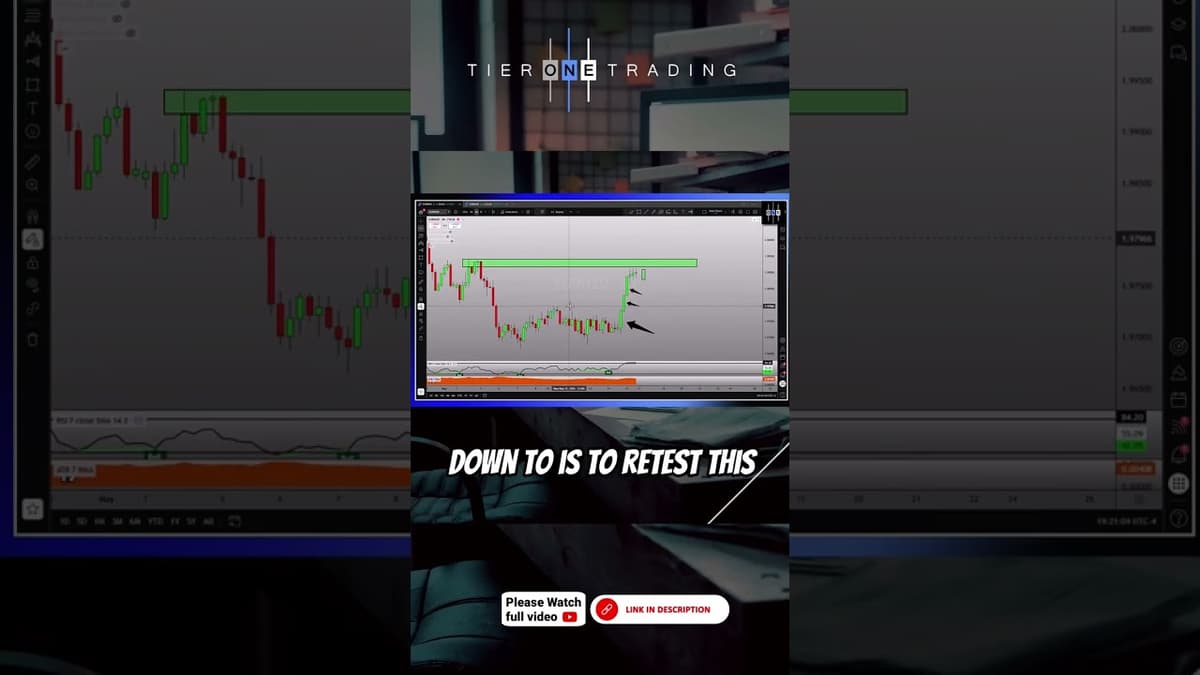
The Early Warning Sign Traders Miss
The video highlights an early warning sign many traders overlook: a rapid shift from extreme bullishness to indecision as price approaches a key structural level. The analyst points to an RSI that has climbed past 80, even touching 84 on...
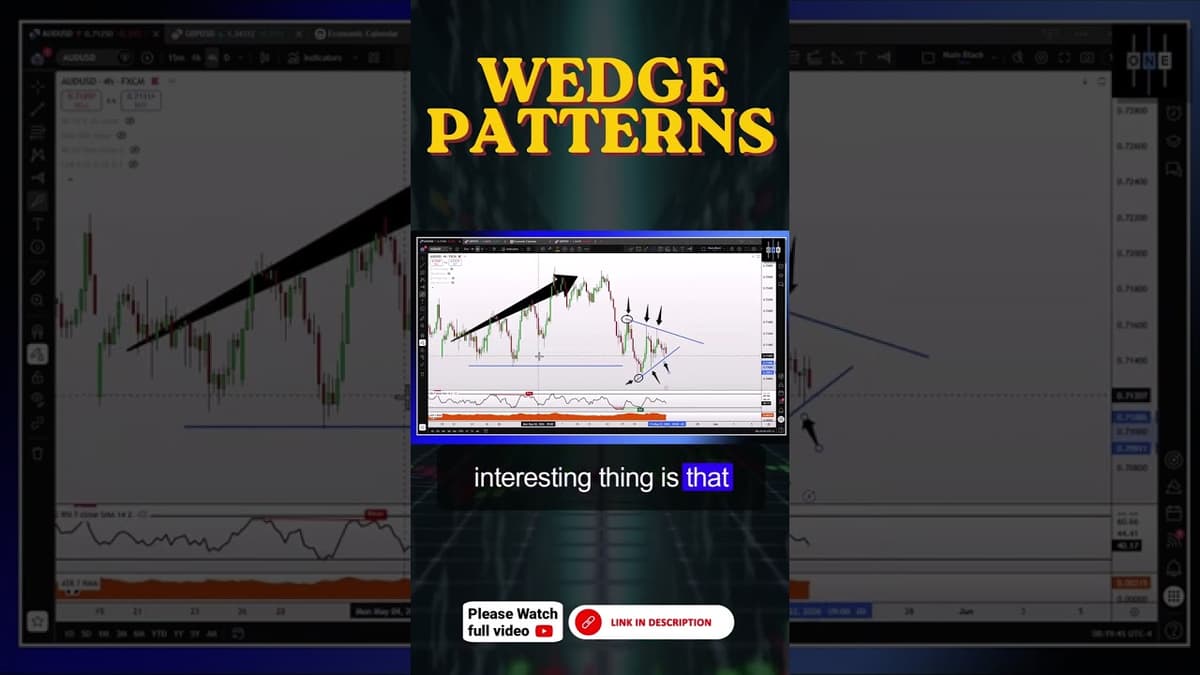
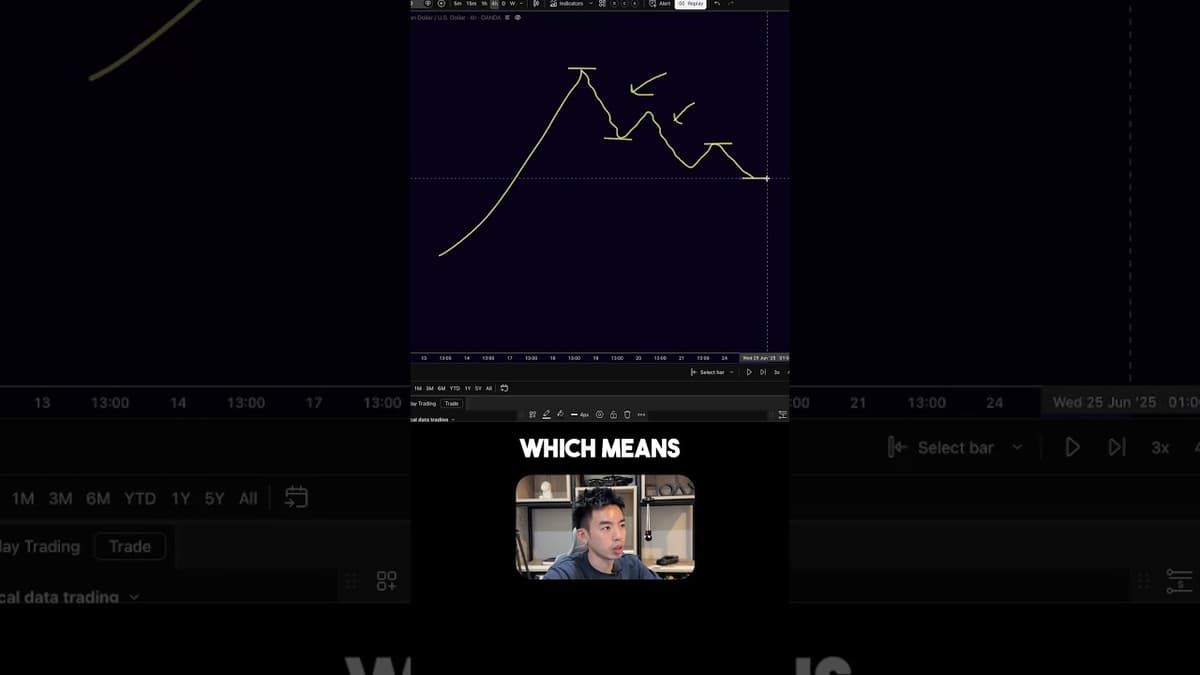
Wedge Patterns Aren’t Bullish or Bearish
The presenter explains that wedge patterns form when highs trend lower and lows trend higher, creating a tightening range that eventually breaks out but carries no inherent directional bias. Unlike flags or triangles, wedges are neutral and require additional price-action...
Gary Says Silex Is Primed for Breakout | the Trade
The segment opened with a macro‑level update: President Trump signaled no rush on a US‑Iran peace deal, keeping the Strait of Hormuz blockade in place. Meanwhile, U.S. consumer sentiment fell to a record low in May as fuel‑price spikes lifted...

Urban Legends and Sexy Volatility
Volatility Views reviewed a week of market gains and falling volatility, with the S&P, Dow and Nasdaq all posting modest rallies despite mixed news flow. Hosts noted subdued post-earnings action and low volume around Nvidia, describing its report as a...

Dip Buyers Showed up Fast as Small Caps Lead the Bounce
The video recaps a volatile week where aggressive dip‑buying reversed a brief market pullback, allowing the S&P 500 and Nasdaq to post modest gains after a 2.5‑4% slide—the largest since the April V‑shape. Macro headwinds, notably rising 10‑year Treasury yields,...

This 7-Min Video Will Show You Why Closing Half Your Trade Early Usually Costs You Money.
The video dissects a research study on "legging"—closing one leg of multi‑leg options trades such as iron condors, strangles, or straddles—versus managing the entire spread as a single unit. The analysts compare various delta levels (16, 30, 50) and profit‑target...
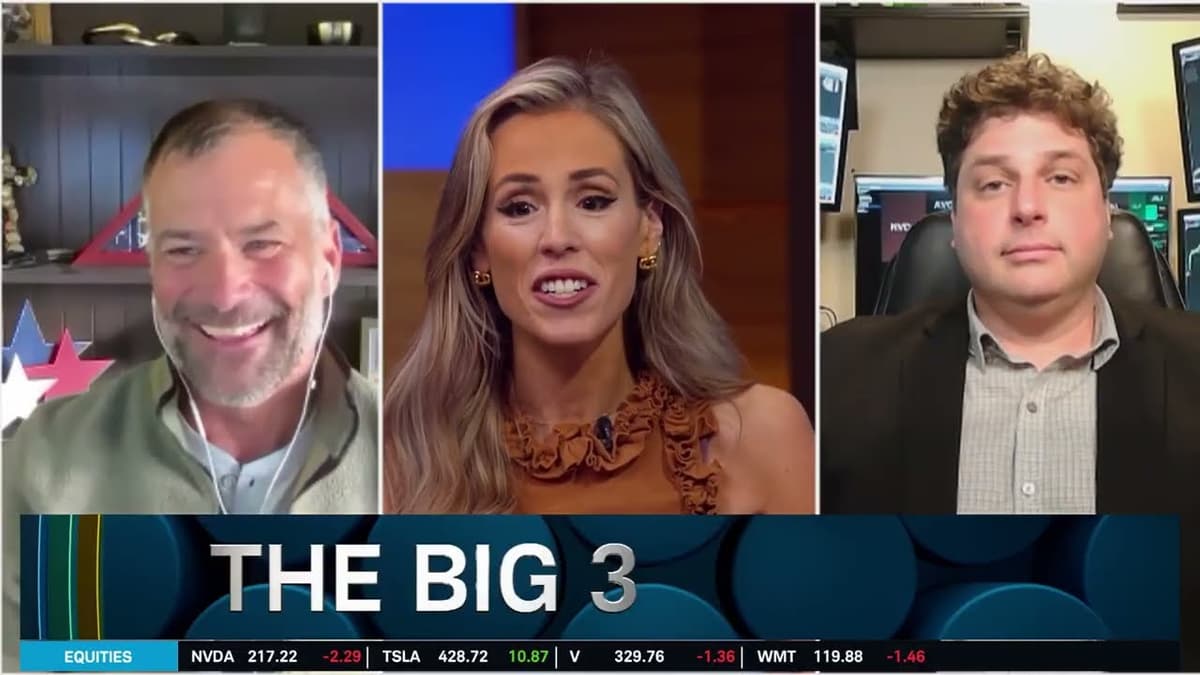
The Big 3: BE, APLD, AAPL
Markets closed the week higher as hosts highlighted a momentum-driven rally where investors are chasing sector-specific trends rather than broad-market weakness. Traders spotlighted Bloom Energy (BE) after a breakout from a month-long consolidation and new deal-related news—fueling another leg higher...

Is the Oil Market Preparing for a Direct Upside Breakout?
The video analyzes current oil market technicals, focusing on WTI and Brent charts after a recent pullback, exploring potential bullish breakout scenarios. The presenter outlines two primary Elliott‑wave‑based pathways: a “blue” five‑wave advance from the May low near $88.50 that could...
What Is FVG
The video explains 'fair value gaps' (FVGs) as price zones created by rapid moves where orders went unfilled—essentially unfulfilled buy or sell interest. The presenter frames trading as an exchange: if a seller’s price is too high buyers won’t transact,...
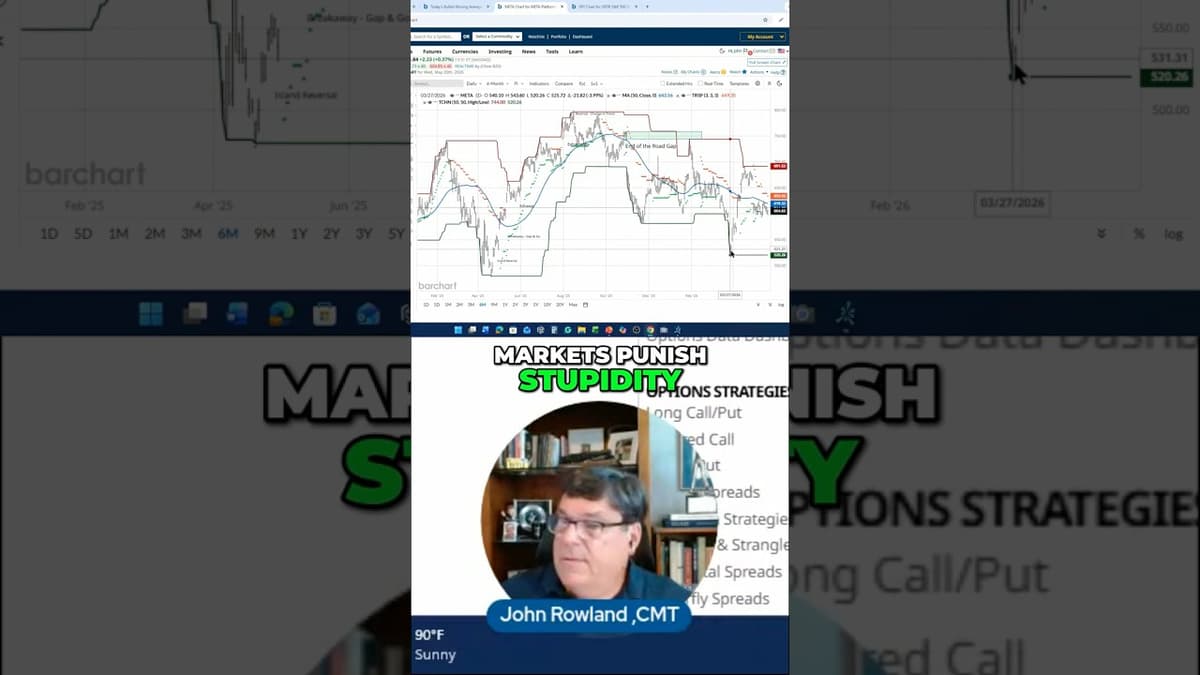
The "End of the Road Gap" That Wipes Out Accounts ⛔️📉💸 #Barchart #Screener
Traders were warned about the perils of ignoring rule‑based risk management after a dramatic “end‑of‑road” gap wiped out a sizable Meta profit. The video walks through a hypothetical Meta trade bought near $500, rising past the 50‑day moving average, and...
Financial Market Preview - Friday 22-May
Global markets opened firmer on Friday, May 22, with US futures and Asian and European equities supported by renewed optimism about a potential US–Iran ceasefire that helped reverse earlier weakness and lift momentum- and AI-linked stocks. Bonds were mixed and...
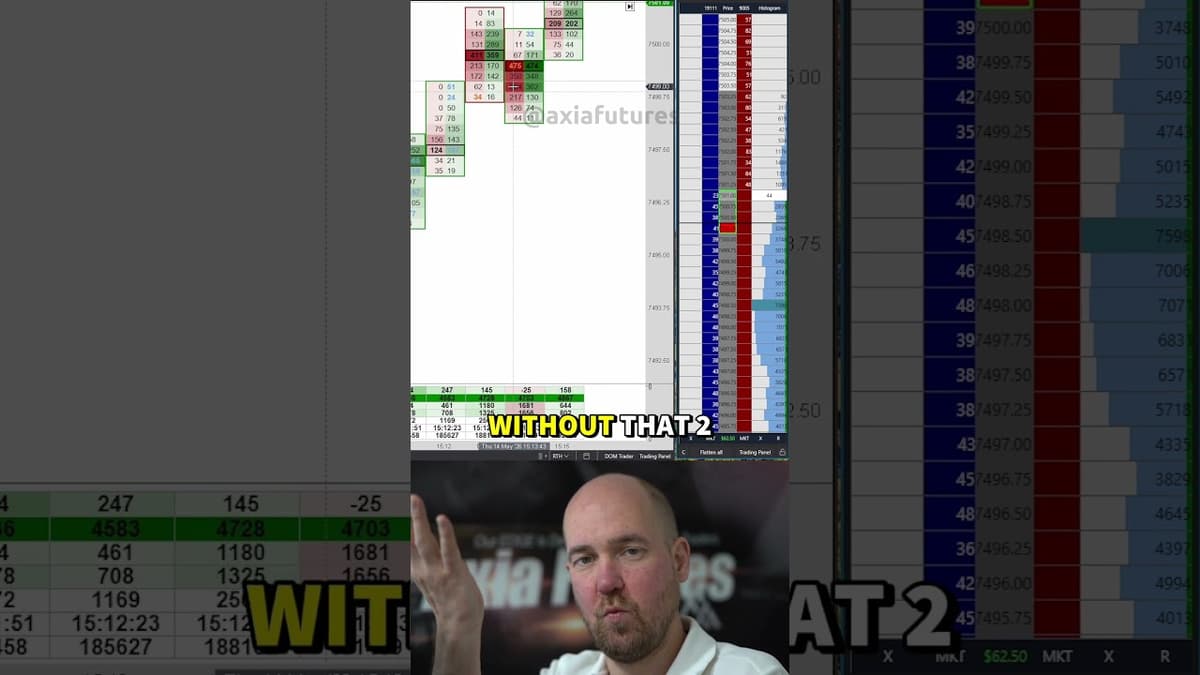
Most Traders Misread Absorption
The speaker argues that many traders misinterpret absorption as bearish, but real-time footprint and ladder data show the market is absorbing sell orders while trading consistently higher (around the double‑0 level). Instead of a two‑way chop, price has moved through...
Post NVDA Clarity - MAY 21- Stock Market LIVE, Live Trading, Stock News
Nvidia reported solid results and raised guidance, but the stock was largely muted, leaving the broader AI trade in a holding pattern as traders watch hyperscalers and chip-equipment names for direction. Energy surged after reports Iran won’t move uranium, reversing...
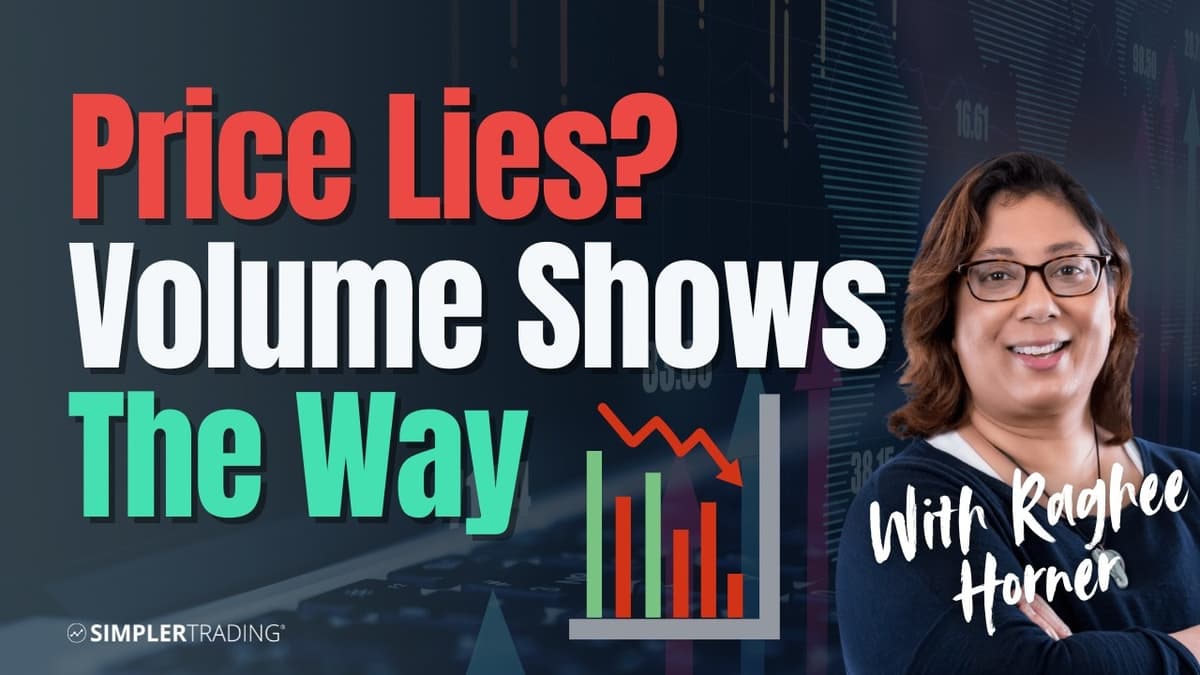
Volume Max Tools Separates Winners From Losers
The video introduces the Volume Max Toolkit, a suite of volume‑based indicators designed to separate winning from losing trades by anchoring volume to a specific start time rather than using rolling totals. Raghee explains anchoring volume at 7 a.m. Eastern on a...
Options Corner: WDAY Down Over 50% Y/Y Into Earnings
The video focuses on Workday (WDAY) stock, which has tumbled more than 53% over the past year and entered a volatile pre‑earnings phase. Lead market technician Rick Ducat breaks down the chart, highlighting a support zone around $110‑$117 and a...
I Tried Building a Trading Strategy with ChatGPT in 2 Days
A trader challenged himself to build a market-ready trading strategy with only ChatGPT in two days, working about four hours total. He used AI to generate a mechanical breakout strategy—identifying low ATR/consolidations with breakouts above recent highs and a 50-EMA...
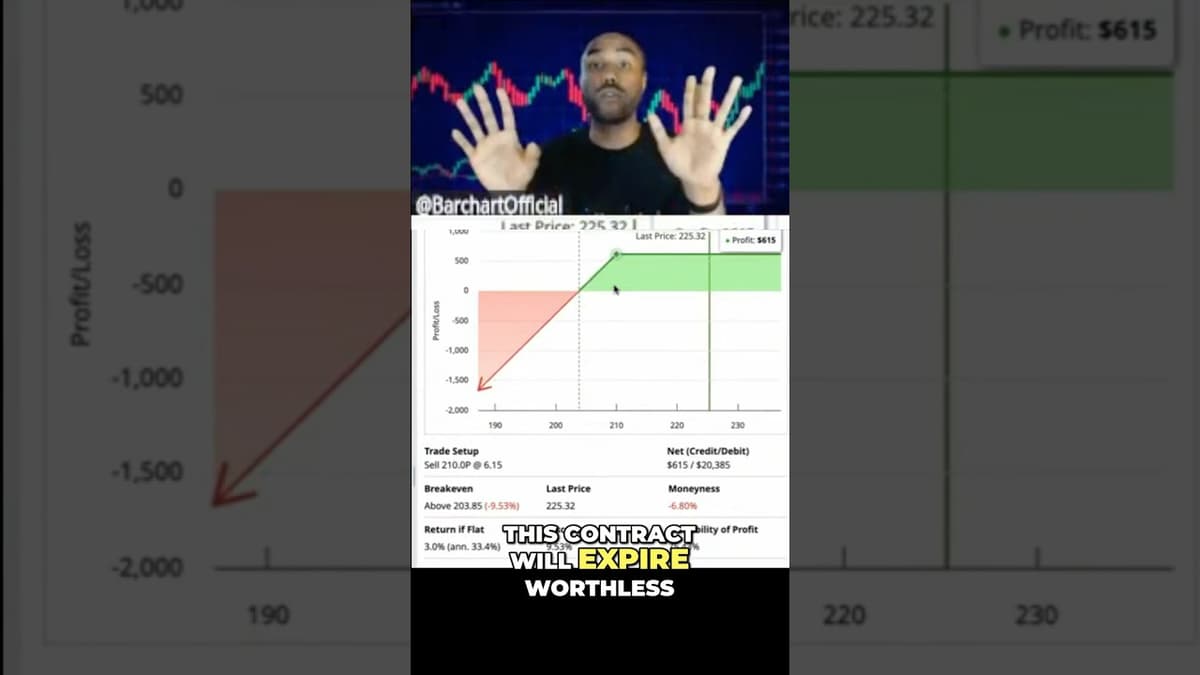
How to Run the Options Wheel Strategy (Step-by-Step) 🔄
The video explains the options wheel strategy step-by-step using Nvidia as an example. It starts by selling a naked put (collecting $615 on a $210 strike while Nvidia trades at $225) — if Nvidia stays above $210 at expiration the...
How the Aussie Can Gather Momentum and Push Higher
The segment opened with a macro‑level roundup: President Trump warned of a possible U.S. strike on Iran unless a peace deal is reached, while the newly formed Persian Gulf Straight Authority announced a controlled maritime zone. In the United States,...
Preparing For the Next Move (Pre-Market Stream) | Taylor Horton
In a pre-market stream, Taylor Horton says the market has shifted from bullish to neutral for the first time since April 13, based on his 15-point, eight-timeframe ranking system. April’s broad alignment led by big tech and semiconductors produced strong...
![[LIVE] NVIDIA Q1 EARNINGS – Technicals & Jensen Conference Call](/cdn-cgi/image/width=1200,quality=75,format=auto,fit=cover/https://i.ytimg.com/vi/BhtA4SIXyds/maxresdefault.jpg)
[LIVE] NVIDIA Q1 EARNINGS – Technicals & Jensen Conference Call
The livestream walked viewers through a real‑time technical setup ahead of NVIDIA’s Q1 earnings release, charting the expected post‑close price move and mapping options‑open‑interest levels. Using Thinkorswim, the host plotted a $13.04 market‑maker move around the $223.47 settlement, identifying a $250...
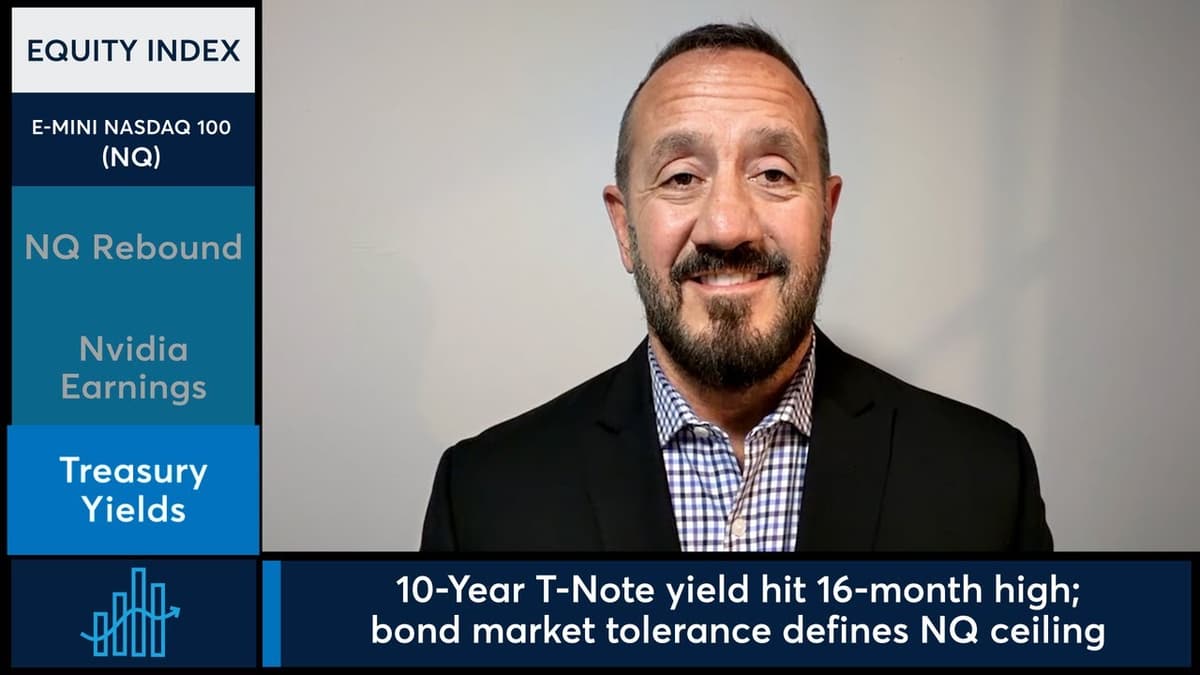
Nasdaq-100 Futures Rebounded Ahead of Nvidia Earnings. 5/20/26
The video focuses on the June Nasdaq-100 futures rally, which snapped a three‑session losing streak by climbing roughly 1.6% as traders await Nvidia’s earnings report later today. Key data points include the futures’ low of 28,797.25 and high of 29,395.50, with...
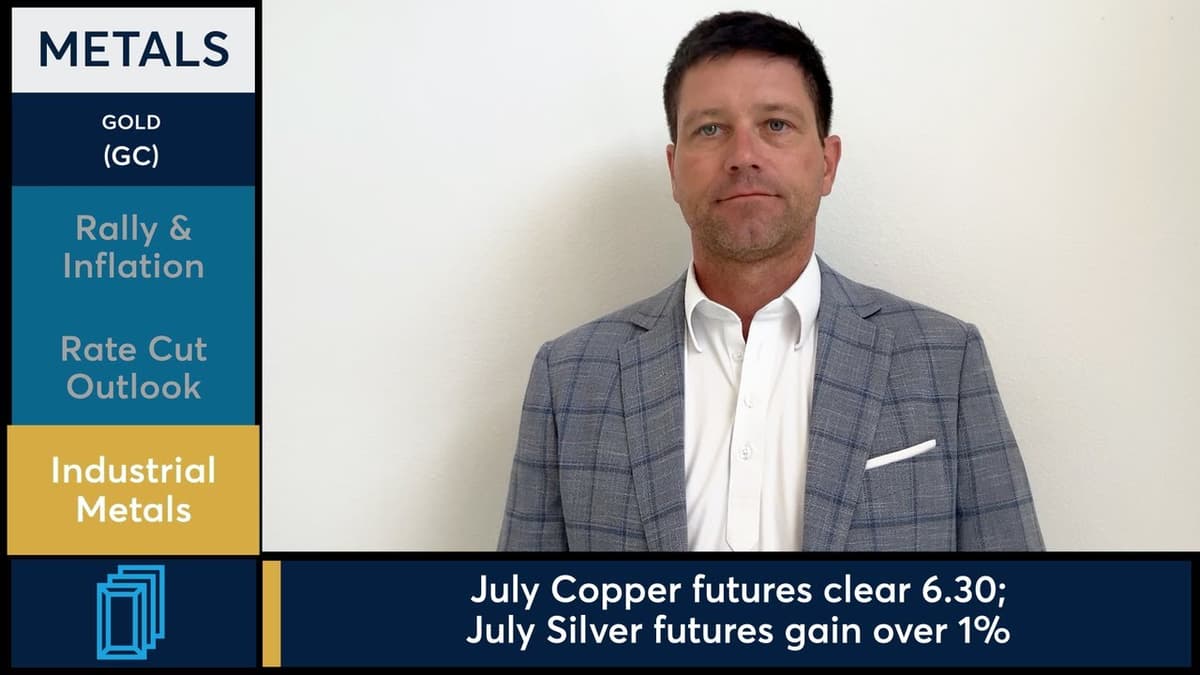
Gold Futures Climbed Toward 4,550 on Shifting Macro Data. 5/20/26
Gold futures rallied toward $4,550 as easing Iran tensions, a drop in yields and weaker crude oil lifted bullion toward the top of last week’s range. A softer dollar on reports of U.S.-Iran talks added to the bid, even as...
Nvidia Ready to Breakout? 🚀📈 #Shorts
Portfolio strategist Danielle Shay says she's bullish on AI-related names, favoring Microsoft and Cloudflare among software plays and highlighting Cloudflare’s weekly consolidation as a potential breakout. On semiconductors she singles out Micron, Broadcom, TSMC and Lattice Semiconductor as buy-on-dip opportunities,...
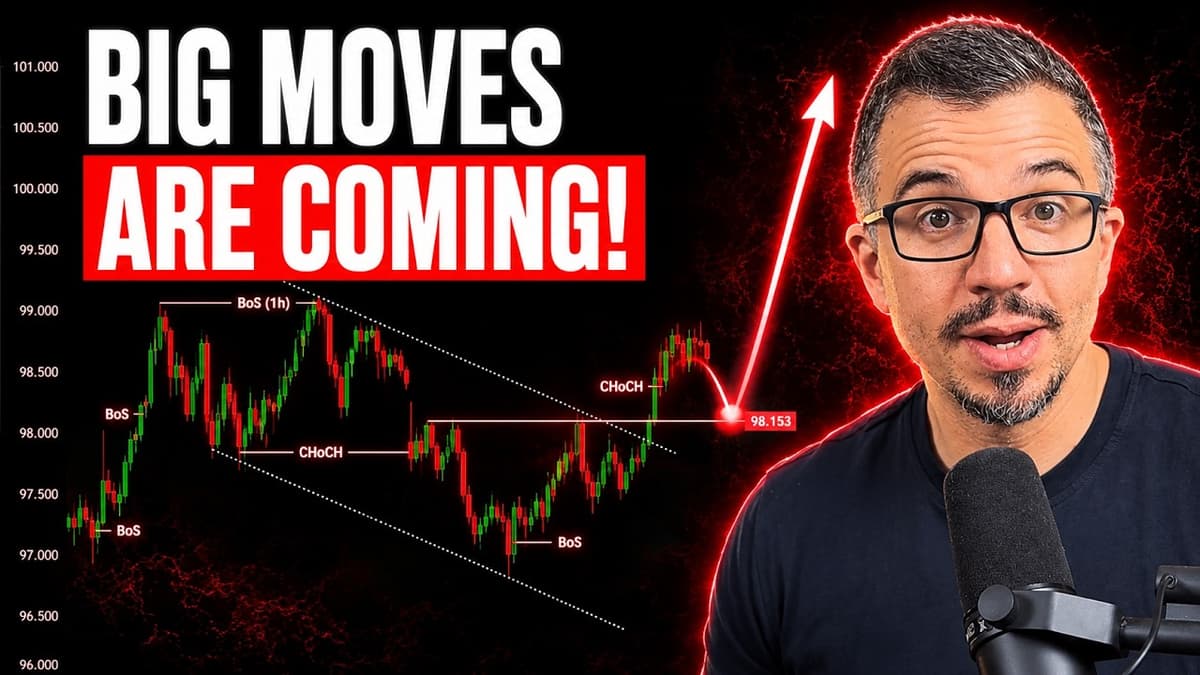
DXY, EURUSD, GBPUSD, XAUUSD: Big Moves Are Coming!
In the video, full‑time trader Justin Bennett lays out a detailed trade plan for the U.S. Dollar Index (DXY), EUR/USD, GBP/USD and XAU/USD, arguing that “big moves are coming” despite recent market “circus” caused by geopolitical tension and political noise. Bennett...
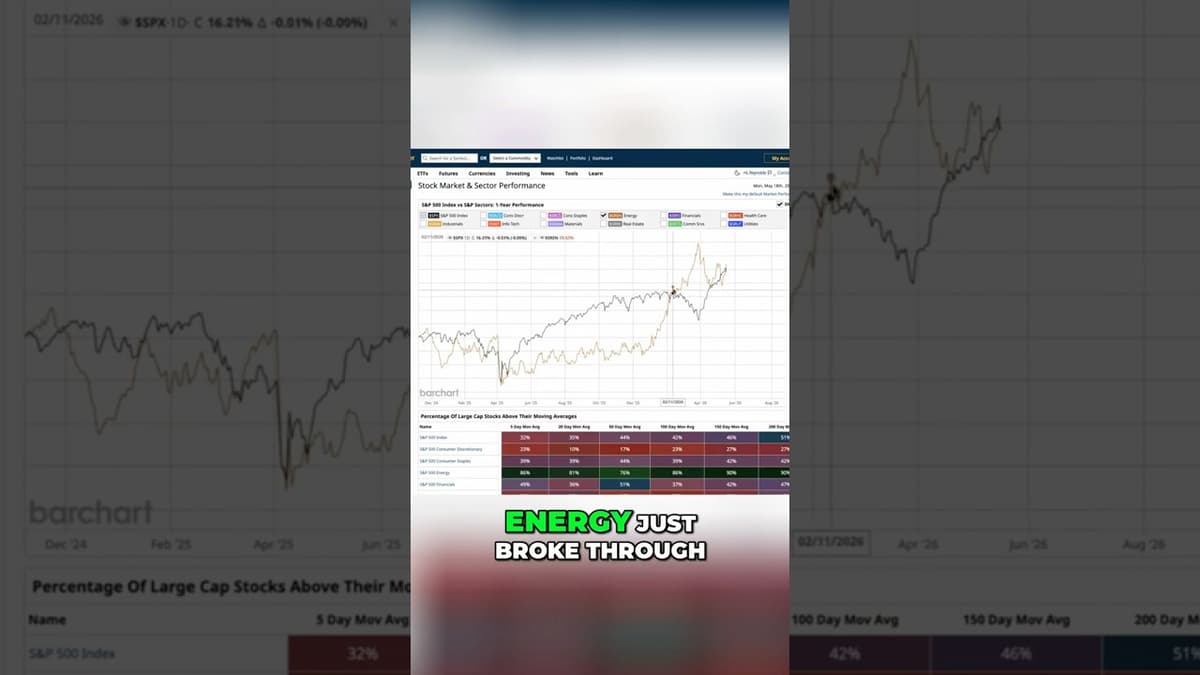
How to Find the Next Big Trend (Sector Rotation 101) 📊🔍 #Barchart
The video explains how to spot the next market trend by tracking sector rotation and moving-average leadership. The presenter highlights energy as a potential new uptrend: it has formed a higher low and is testing resistance, with a high percentage...
This Is How You Master Your TRADE ENTRY SIGNALS
The video teaches a practical approach to trading breakouts, reversals and continuation trades by focusing on stop-run retests and pullback entries rather than chasing initial breakout candles. The presenter shows how to identify a stop zone where trapped stops are...
LIVE TRADING: Trade the Close with Mike Teeto 5/19/2026
In this live‑trading session, Sniper Mike walks viewers through his overnight watch list, emphasizing his decade‑long focus on overnight swing trades. He explains how the upcoming elimination of the Pattern Day Trader (PDT) rule, expected in three weeks, could flood...
Nvidia Stock Analysis Using Yahoo Finance's AlphaSpace
Yahoo Finance launched Alpha Space, a customizable investing platform with advanced charting, real-time fundamental analysis, portfolio tracking and integrated access to Yahoo Finance live content. The presenter used Alpha Space to analyze Nvidia ahead of an earnings report, highlighting lower...
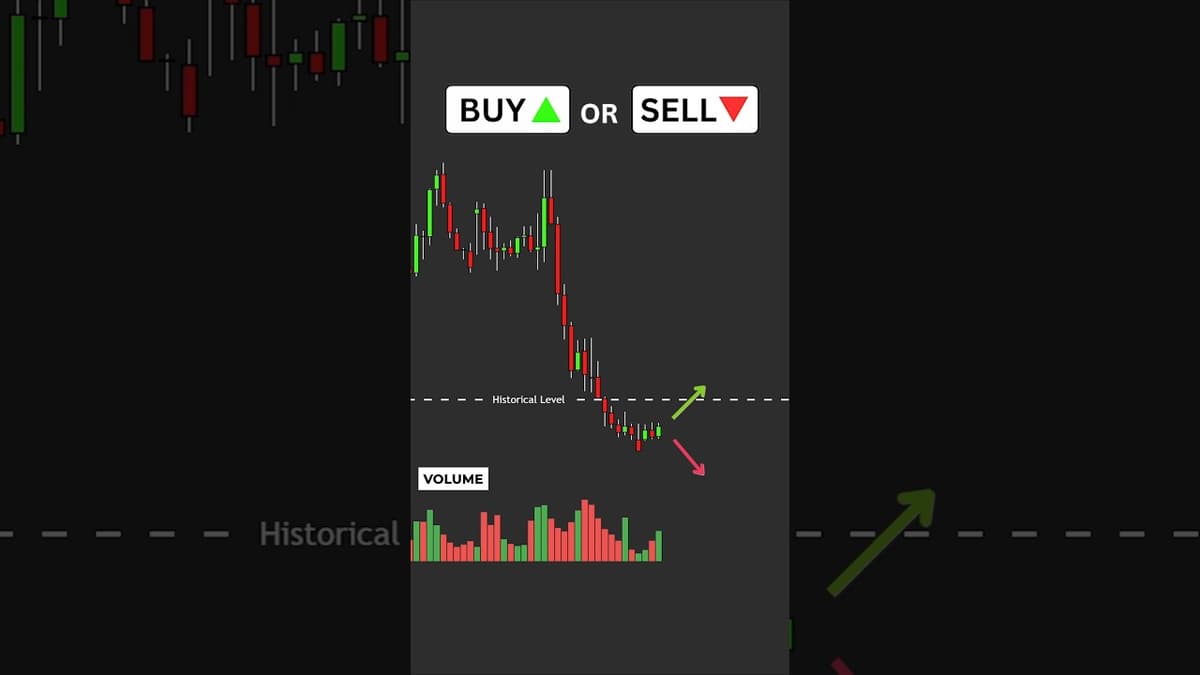
The ONLY Volume + Price Action Strategy You Need (Forex Breakdown) 📊 #forex #volume
The video promotes a volume-plus-price-action forex strategy, urging traders to mark historical support and resistance and watch for retests after level breaks. The presenter analyzes a sample setup where bullish volume accompanies a retest below a key level, places a...
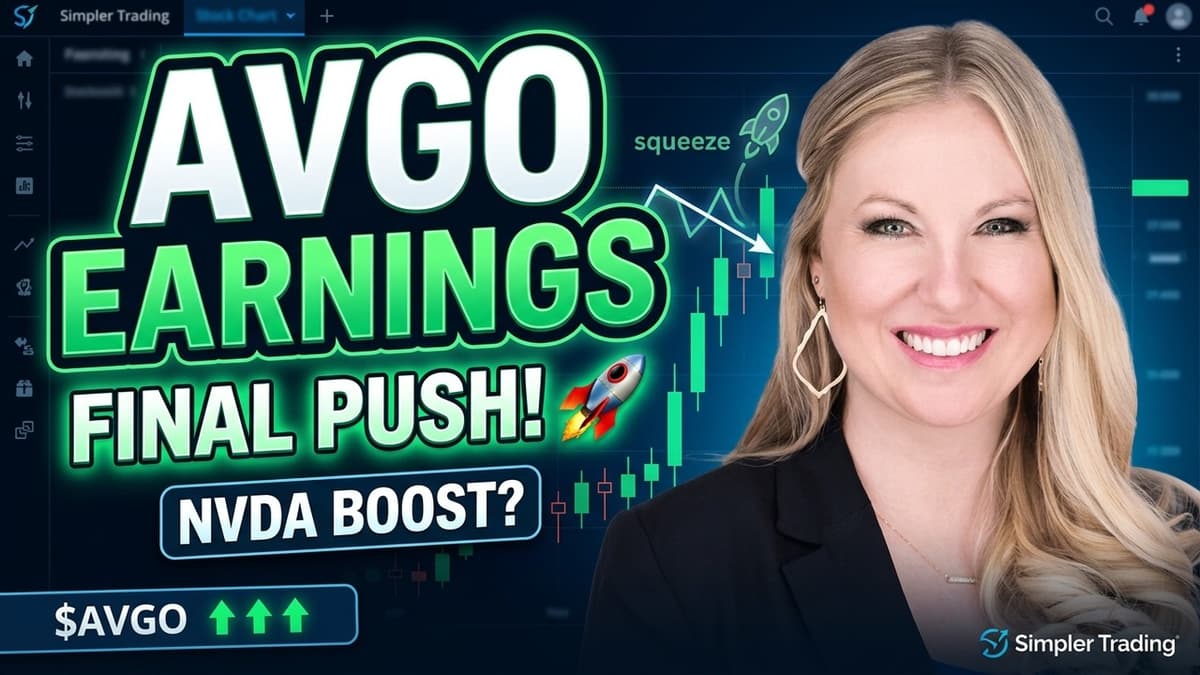
AVGO About to Explode Before Earnings? $462 Target in Play
The video focuses on Broadcom (AVGO) as it nears its June 3 earnings release, highlighting a potential pre‑earnings rally. Danielle cites projected upside targets of $462, $484 and $506 for the earnings week, noting that the stock has historically climbed during the...
Here's A Shortcut To Find Tradable Pullbacks
The video explains a simple method for identifying tradable pullbacks by measuring changes in distance and time between consecutive downward pushes. A healthy pullback shows each push traveling a smaller distance toward new lows while taking progressively longer to cover...
0DTE Options: Easy Money or a $50M Nightmare? 💸⚠️
The video warns that zero‑day‑to‑expiration (0DTE) iron condors, popularized on social media as a "easy money" play, are fraught with hidden danger. While the strategy offers an upfront credit for a trade that expires within hours, its repeatability is questionable,...

Tested This Strategy 100 Times
A trader tested a three-step price-action strategy 100 times and reported a 78% win rate. The approach uses a 15-minute chart to identify liquidity grabs that close with only a wick, then switches to a one-minute chart to confirm a...
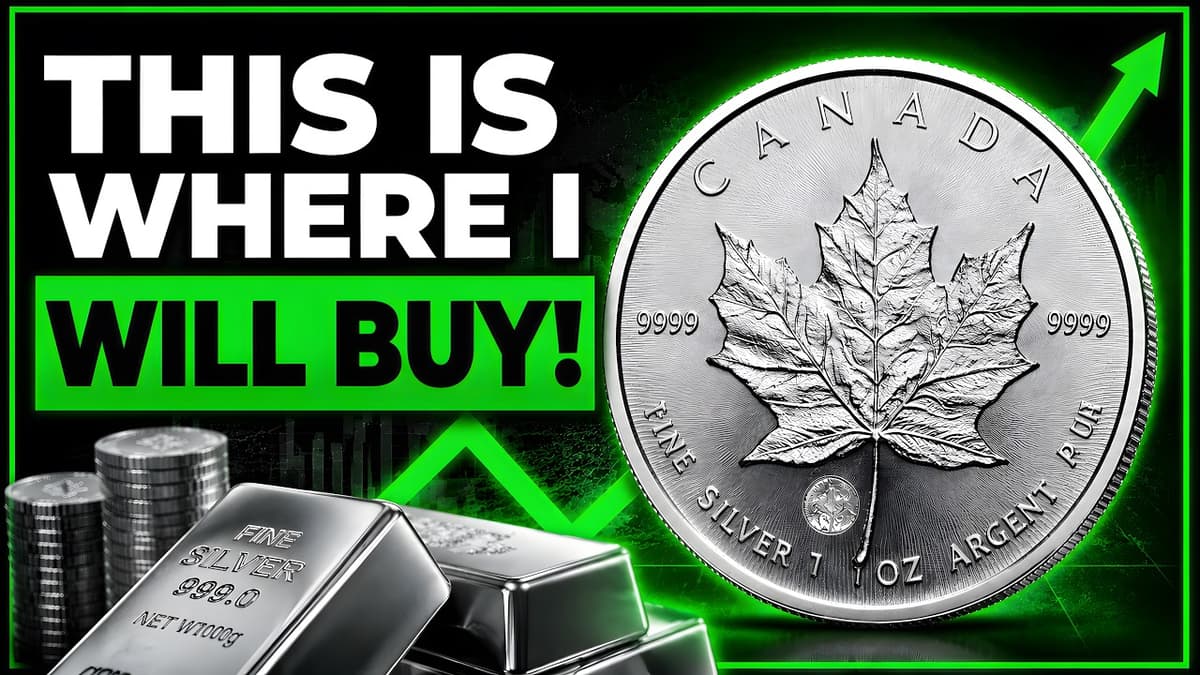
Silver Breakdown: The Key Zone I’m Watching to Buy
The video analyzes the recent sharp sell‑off in silver, a roughly 15% drop on Friday that marked the largest red candle since early March, and frames it within an Elliott wave perspective. The presenter argues that silver remains in wave‑four of...
$NVDA Options Sellers Nailed the Close
The clip recaps Nvidia’s (NVDA) price action on a volatile day, noting a 4.4% pullback to $225.32 after a week of record‑setting highs. Despite the dip, the stock remains above its previous all‑time peak, and options activity surged to a record‑breaking...
$AAPL Options Sellers Were Sweating Today
The video spotlights a dramatic surge in Apple (AAPL) options activity as the stock hit an all‑time intraday high of $303.20. Analysts note that the spike forced many short‑call sellers to “sweat” during the session, but the day ultimately closed...
The Stock Market Rally Is Winning, But Rates Are Fighting Back
The video examines the market’s current tug‑of‑war: a strong semiconductor‑driven rally is now confronting a harsher macro backdrop as the Nasdaq 100 and SMH ETF recorded their first weekly decline. The host highlights two opposing forces – concentrated AI‑related equities pushing...
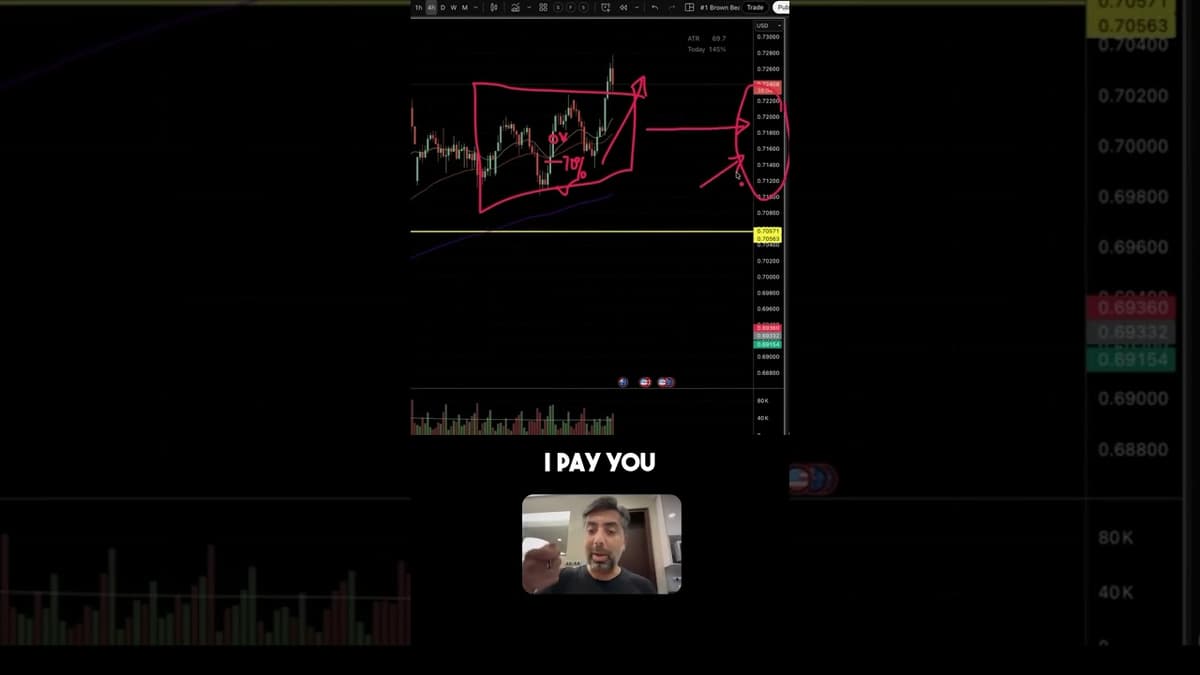
Range Bars + Ascending Triangles = Powerful Day Trading Setups
The video by Kill Stokes focuses on using ascending triangle patterns combined with range bar charts for day‑trading the Euro‑Australian (EURAUD) pair, explaining how the pattern can appear after a down‑move and why it matters for breakout strategies. He walks through...