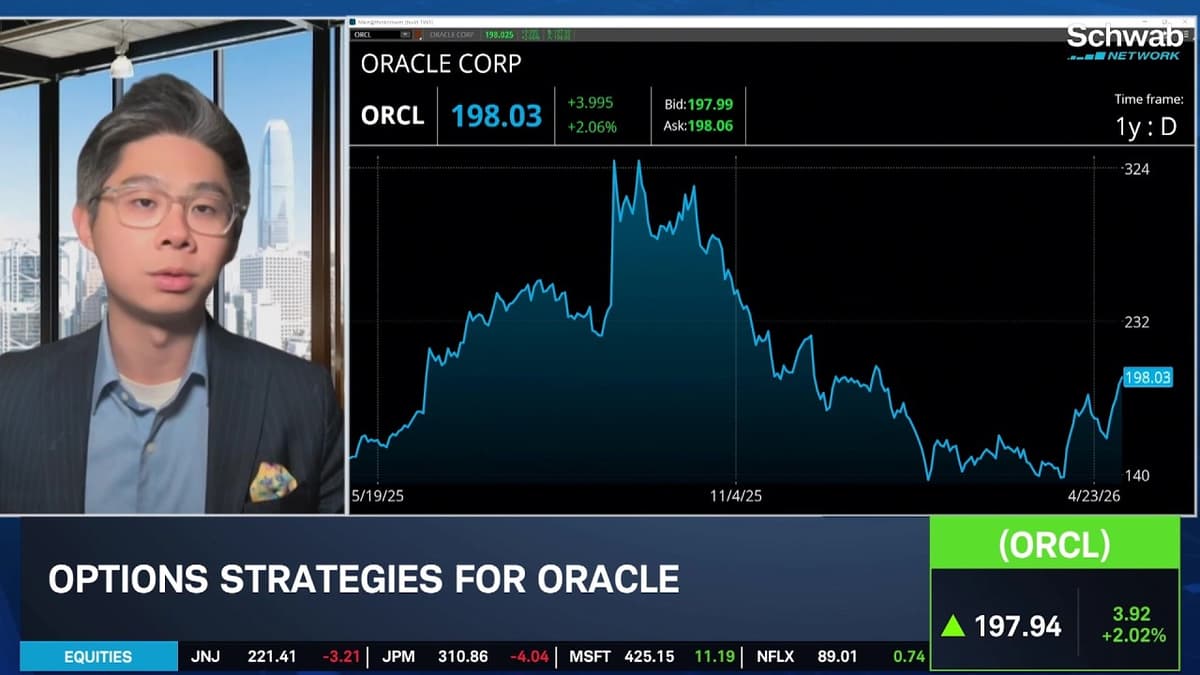
Tony Zhang's Example Options Trades in IWM & ORCL
Tony Zhang, chief strategist at Options Play, opened the discussion by highlighting the strength of the current earnings season, noting a projected 27% year‑over‑year EPS growth for the S&P 500. While tech and AI stocks have powered a roughly 17% rally over the past five weeks, the narrow leadership and low volume raise the specter of a swift pullback. Zhang observed that small‑cap exposure is beginning to catch up, and the equal‑weight S&P 500 index is flirting with new all‑time highs, suggesting a potential broadening of the market advance. Against this backdrop, Zhang outlined a defined‑risk call spread on the iShares Russell 2000 ETF (IWM). He recommends buying a June 30 286/300 vertical for about $9, offering roughly a 2:1 risk‑reward ratio while risking only about 3% of the ETF’s value. For Oracle (ORCL), he proposes selling a June 18 170/190 put spread, collecting $8 credit and targeting a 1.5:1 risk‑reward profile, capitalizing on the stock’s AI‑infrastructure positioning at attractive valuations. Zhang emphasized that the IWM trade bets on continued small‑cap momentum, whereas the Oracle put spread leverages a solid fundamentals story without chasing the extreme semiconductor volatility. Both structures limit downside to a predefined amount, aligning with his broader view that options can provide upside exposure while protecting against the anticipated market correction risk. If small‑cap participation sustains, the broader market could extend its rally beyond the tech‑centric core, validating these option strategies. Conversely, a rapid pullback would test the risk limits set by the spreads, underscoring the importance of defined‑risk positioning in a volatile environment.
Top 3 Pro Trades of March
The video reviews Axi’s three biggest March trades – a Trump‑triggered oil swing, an ECB‑source‑driven bond play, and a cease‑fire‑driven multi‑asset surge – illustrating how narrative, not just charts, drove profit. Traders capitalized on ultra‑fast price action: oil fell from 99...

The Earnings Run-Up Strategy Every Trader Needs
Rocky explains a systematic approach to trading earnings season, leveraging the free Estimize platform to monitor high‑weight stocks across major indices and sectors. He introduces the “642 window” – six weeks, four weeks, two weeks out – to identify bullish momentum,...

One Setup To Catch Every Liquidity Grab
The video introduces a day‑trading setup that targets liquidity grabs after price breaches a major resistance level. The presenter claims the method works “absolute wonders” and can be executed with a single free indicator on TradingView. The core idea is to...
Financial Market Preview - Thursday 7-May
The FactSet Thursday market preview highlighted a broad rally in US equities, with the S&P 500 and Nasdaq posting fresh all‑time closes, while Treasury yields slipped to 4.3% and oil fell to $94 a barrel.\n\nKey data points included a record‑high...
Don't Buy Coinbase Before Earnings - Here's Why
The video cautions investors against purchasing Coinbase (COIN) ahead of its upcoming earnings report, arguing that the stock’s recent trajectory and sector dynamics make it a risky short‑term play. The host notes that Coinbase fell from $440 to below $200, now...
Tesla Stock (TSLA) Reversal Signal Just Triggered
The video focuses on a technical reversal signal for Tesla (TSLA) after a prolonged bearish trend through Q1 2026. Analyst Henry highlights a recent price advance that dwarfs earlier rallies, suggesting a shift in market sentiment. Key technical points include a pullback...
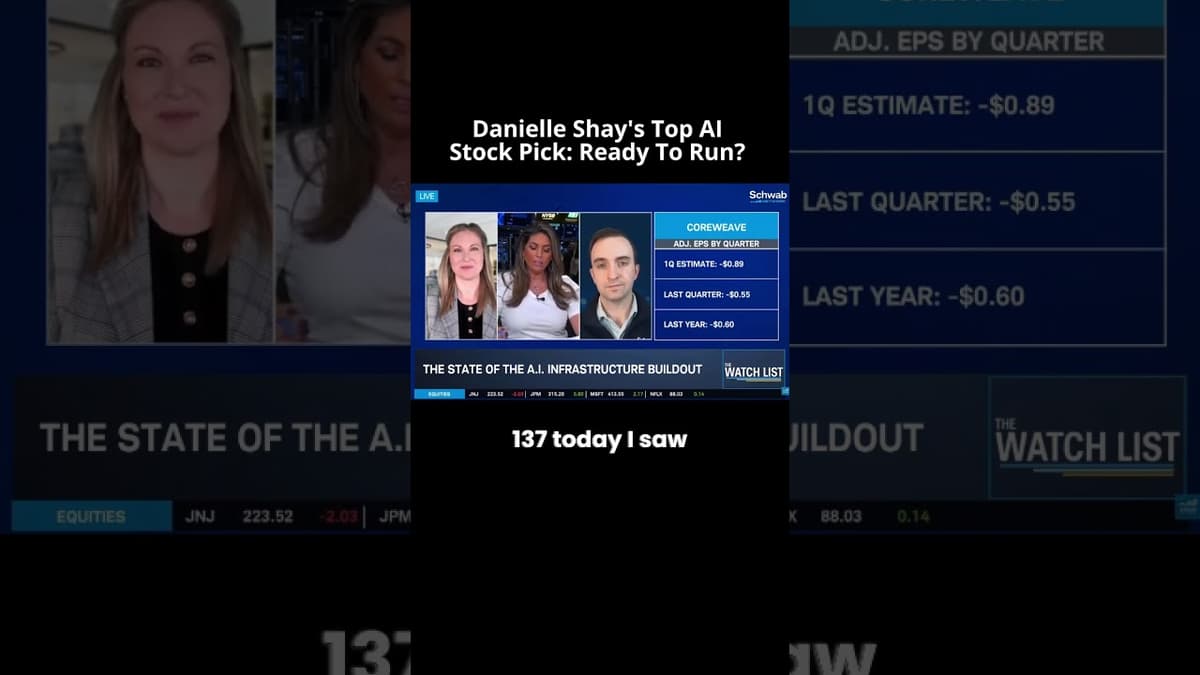
CoreWeave Ready To Run? 🚀 #Shorts
The short‑form interview brings together Danielle Shay, VP of Option Simple Trading, and Futurum research director Brendan Burke to assess CoreWeave’s outlook amid a broader AI‑infrastructure build‑out highlighted by AMD’s recent comments. Both analysts note that CoreWeave is trading around $137,...
This Secret RSI Screener Spots Reversal Trades Early
The webinar introduced Bar Charts’ newest tool – an RSI divergence screener designed to flag potential trend reversals before they fully develop. By pairing the Relative Strength Index with MACD crossovers and anchoring the analysis to six‑month swing highs or...
Yen Intervention vs The Biggest Forex Crash Ever… Here’s What’s Coming
The video dissects Japan's recent yen intervention, highlighting a 500‑pip drop and the subsequent defense of a key technical level. Kil Stokes blends technical chart patterns with fundamental policy context, comparing the current scenario to the historic Swiss franc crash...
'Project Freedom' Pause, Stocks Rally as AI Spend Drives Tech | The Opening Trade 5/6/2026
The Opening Trade highlighted a sharp market rally anchored by soaring tech earnings and unprecedented AI‑driven capital spending. Samsung’s market value breached the $1 trillion mark, while AMD reported a 48‑fold profit surge, underscoring the sector’s earnings momentum. Geopolitical headlines also...
B1G Numbers, April 2026 | Exchanges
The April 2026 edition of B1G Numbers highlighted key performance metrics for SIX Swiss Exchange and Spain’s IBEX 35, focusing on listings, index movements, and trading turnover. The report opened with Sentiel’s multi‑exchange debut on April 17, securing a CHF 261 million...
Losing Trade on Meta: Hold, Close, Roll or Defend?
The video walks through a losing Meta put‑spread trade and evaluates whether to hold, close, roll, or defend it. The trader sold a 625/630 put spread when Meta was above $630; with the stock now at $612 both legs are in‑the‑money,...
The Dollar Is Telling Us Something | DXY, EURUSD, GBPUSD, XAUUSD
In this video trader Justin Bennett examines the recent behavior of the U.S. dollar index (DXY) and its ripple effects on the euro, pound and gold. He notes that after a prolonged sideways phase, the DXY has formed a bullish...
Equity Futures Hit All-Time Highs on Strong Earnings Momentum. 5/5/26
Equity futures surged to record levels on May 5, as strong corporate earnings propelled the major U.S. indexes to new peaks. The S&P 500 rose about 1% to an all‑time high, the Nasdaq climbed more than 1%, and the Dow approached a 1%...

🚨 Stock Market Live: AMD Earnings, Market Rally + How To Make Money Trading – LIVE at 4:10pm ET
The live stream focused on AMD’s earnings release, broader semiconductor rally, and real‑time trading tactics from True Trading Group’s co‑founder Michael Edward Parinati.\n\nAMD posted $1.37 EPS and $10.2 billion revenue, both beating forecasts, and raised Q2 guidance to $10.9‑$11.5 billion, sending the...
Palantir Beat Earnings and Still Dropped.
The video discusses Palantir’s recent earnings beat, which paradoxically coincided with a noticeable drop in the stock price. The presenter frames this decline as a potential capitulation, suggesting that the market may be over‑reacting and creating a buying opportunity. Key data...
The "Safe" Trade That Lost Traders $50 Million
The video dissects a trading group’s catastrophic $50 million loss from selling zero‑day‑to‑expiration (zero‑DTE) iron condors, a strategy many social‑media influencers tout as “safe” and easy‑income. It explains that the group relied on a Martingale‑style scaling—doubling position size after each loss—while trading...
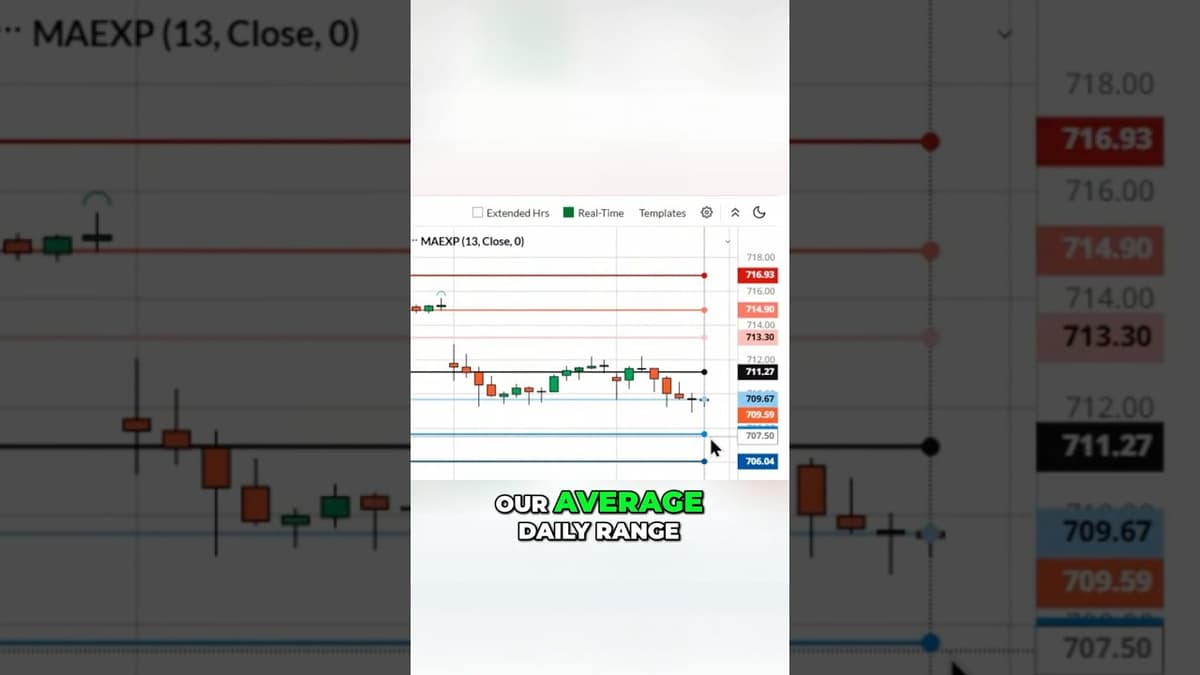
This Indicator Predicts How Far a Stock Can Move 📏📊 #Trading #Investing #Strategy
The video explains how the Average True Range (ATR) and the Average Daily Range (ADR) can serve as a probabilistic ruler for traders, helping to gauge volatility and anticipate price moves. A shrinking ATR indicates a contraction in volatility, which often...
CINCO DE TRADO - MAY 5 - Stock Market LIVE, Live Trading, Stock News
The live broadcast on Cinco de Mayo 2026 centered on today’s market outlook, highlighting a crowded earnings calendar, lingering geopolitical tension over a cease‑fire, and commodity cues such as oil futures. The host noted that roughly 70 % of companies have posted...
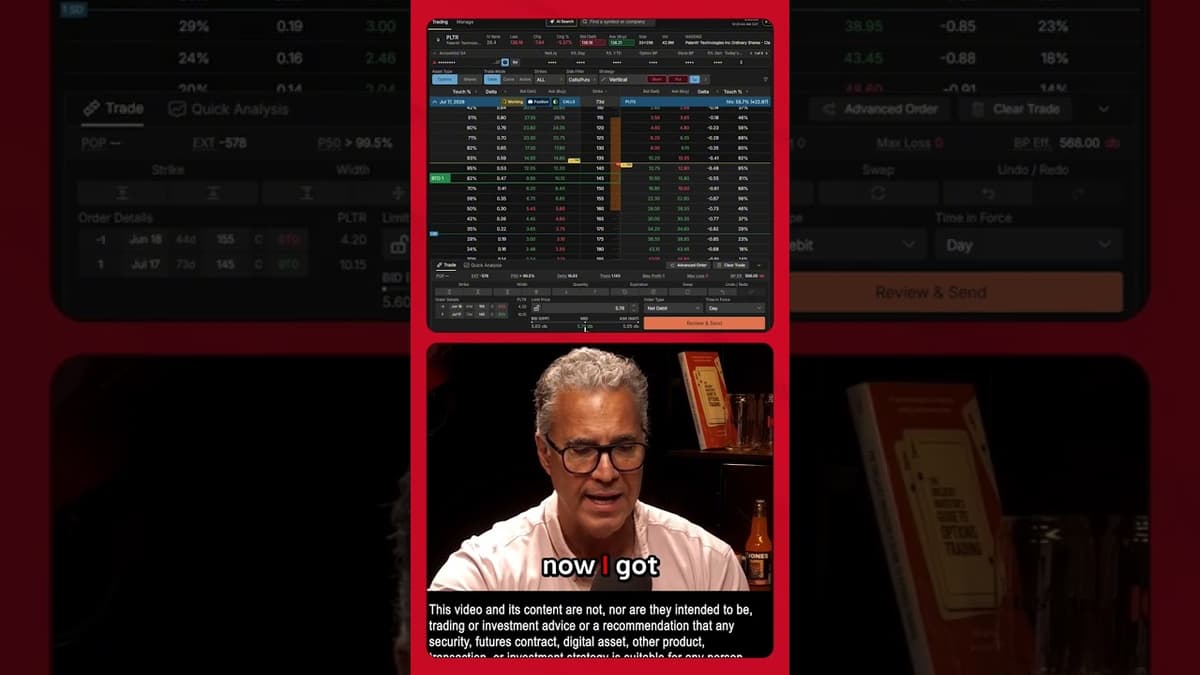
Trading a Pre-Earnings Momentum Run in Planet Labs (PL)
The video spotlights Planet Labs (PL) as a pre‑earnings momentum play, highlighting a 21‑day average rally of roughly 10% leading into its upcoming earnings, projected for the first week of June. Danielle points out several technical catalysts: the stock entered a...
Stock Market Live: PLTR Earnings Coverage + Oil Prices Surge - LIVE at 4:10pm ET
The live stream focused on Palantir’s latest earnings report and broader market moves, including a surge in oil prices and updates on other tech names. Host Michael Perinati broke down the numbers, noting that Palantir delivered a top‑and‑bottom‑line beat and...
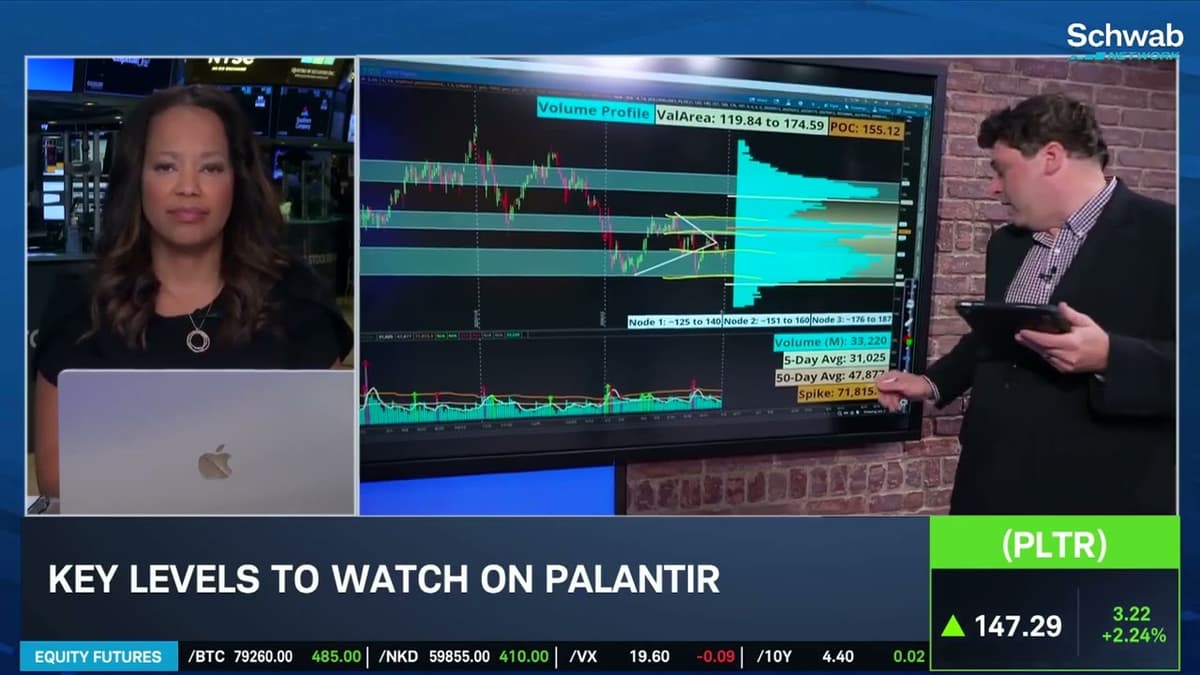
Options Corner: Investors Cooling on PLTR Ahead of Earnings
The segment focuses on Palantir Technologies (PLTR) as earnings approach, highlighting waning investor enthusiasm. Host Rick Duquette examines the stock’s chart to gauge sentiment ahead of the upcoming report. Duquette notes PLTR has risen only 16.4% year‑to‑date, far lagging the broader...
🚨 Stock Market Outlook: Earnings, Jobs Data & How To Make Money This Week Trading - LIVE at 8pm ET
The live stream from True Trading Group (TTG) focused on this week’s market outlook, highlighting upcoming earnings from Palantir and AMD, the U.S. jobs report, and geopolitical risks such as the US‑Iran tension. Host Michael Edward outlined how TTG’s proprietary tools—particularly...
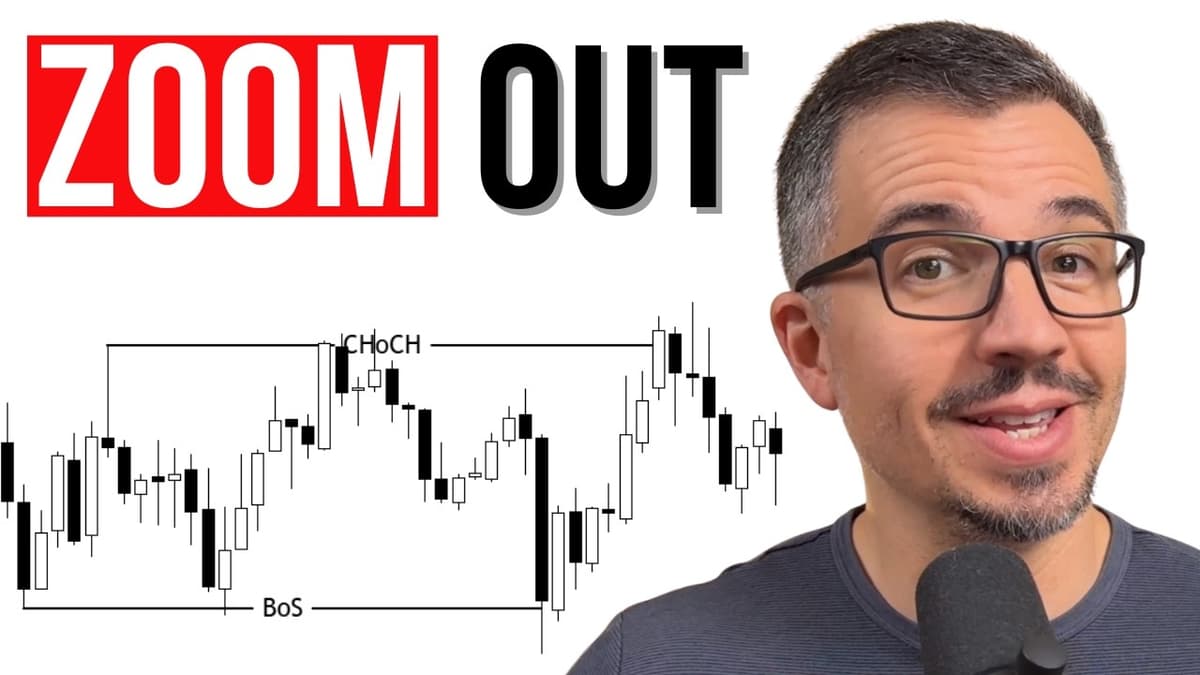
🤯 I Don’t Know This Pattern… But I Know the Trade
The video walks viewers through an unfamiliar chart formation that mirrors an inverted ascending triangle, where the price makes higher highs but the lows keep descending. The presenter admits he doesn’t know the formal name, yet emphasizes that the market’s...
Has Silver Started an Upside Reversal?
The video dissects silver’s price action, arguing the metal is still trapped in a wave‑four correction that began after the January peak. The analyst stresses that the broader Elliott‑wave framework has not shifted since early 2024, leaving the market in...
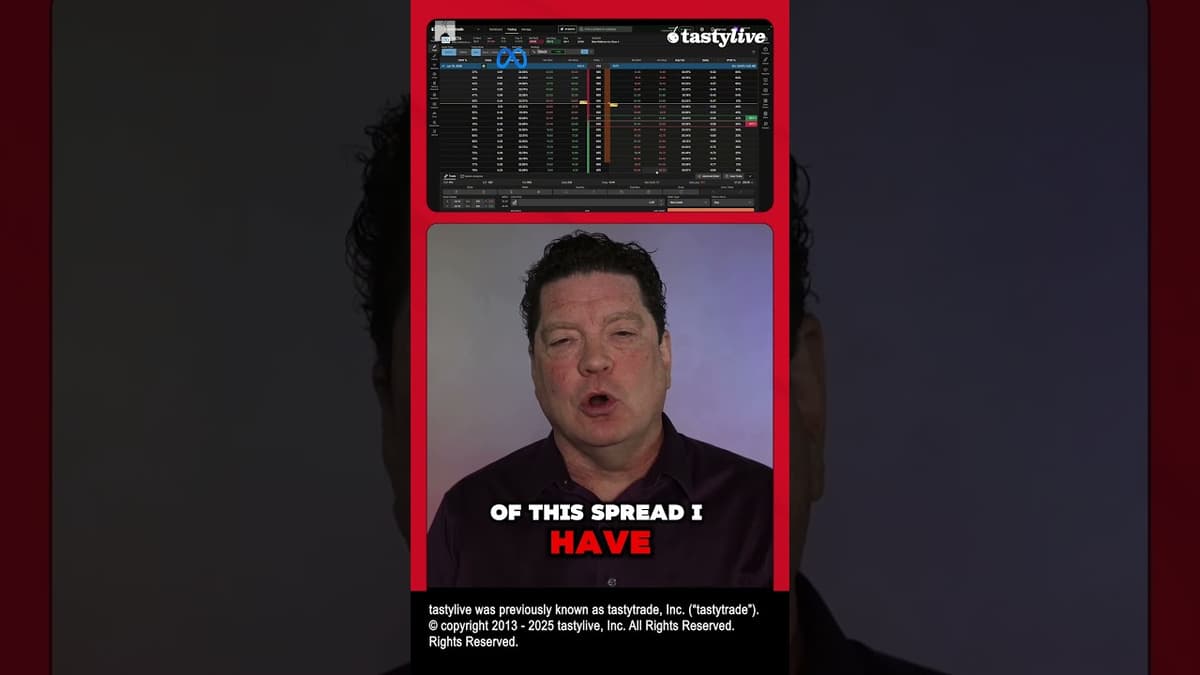
Most Traders Hold Options to Expiration. Data Shows Managing at 21 Days Doubles Your Odds.
The video examines how the timing of option‑position management affects the likelihood of the underlying price reverting to its entry level, using SPY as the primary example and contrasting it with single‑stock behavior. Analysis of 45‑day cycles shows SPY’s price touches...
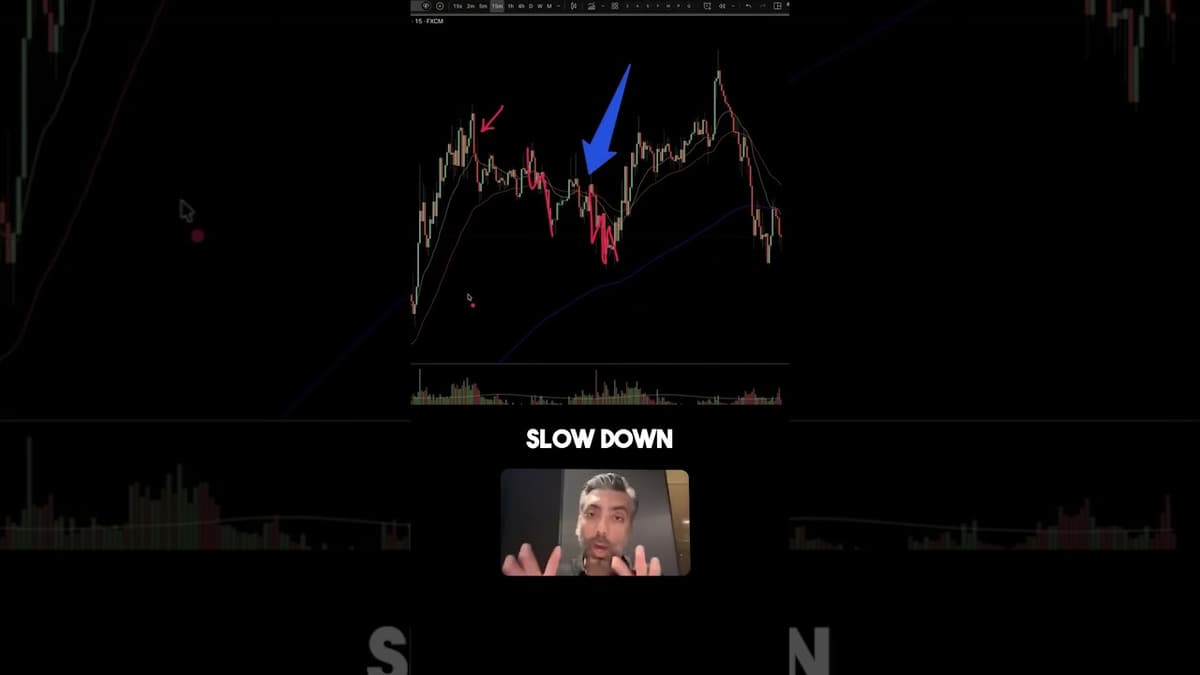
The Slingshot Pullback Pattern - How To Trade Pullbacks
The video introduces the "Slingshot" pullback pattern, a systematic approach for entering trades after a breakout pullback. Presenter Scotland explains how the setup evolved from early breakout trading, emphasizing the need for an objective, low‑risk entry method. Key insights include using...
Paul Tudor Jones Is Calling a 30% Crash. The VIX Futures Say He's Early. Here's the Signal to Watch.
The video pits legendary hedge‑fund manager Paul Tudor Jones’ warning of a 30‑35% market correction against bullish forecasts from analysts like Tom Lee, who still see the S&P 500 E‑mini pushing toward 7,700. The host examines the clash through the lens...
"The Greatest Traders ALWAYS Do This" Ft. Navin From Urban Forex
The video features Navin of Urban Forex discussing what separates top traders from the rest, emphasizing a counter‑intuitive mindset that values risk‑reward over win‑rate. Navin argues that the most profitable traders operate with low win percentages but high risk‑reward, and they...
Master SUPPLY & DEMAND Trading | Full Tutorial
The video is a step‑by‑step tutorial on supply and demand trading, explaining how to locate demand (bullish) and supply (bearish) zones, determine entry points, and manage exits. The instructor stresses two core qualifiers for a high‑probability zone: a tight consolidation with...
Trade the Volatility: Leveraged and Inverse ETFs
The video spotlights Direction’s leveraged and inverse exchange‑traded funds (ETFs) as tactical tools for traders navigating today’s heightened volatility, from geopolitical shocks to rapid equity swings. Sean Edwards explains how 2x energy ETFs such as GUSH, DRIP, ERX/ERY and the top‑five‑energy...
Finding The Perfect Entry
The video dissects a EUR/USD entry strategy, emphasizing the importance of a clean break from consolidation before the price pulls back toward key moving averages. The presenter walks through the chart, highlighting how the pair’s uptrend can be confirmed when...
This Option Strategy Pays You When Nvidia Tops Out
The video walks viewers through a bear call spread – a defined‑risk, income‑generating option strategy – using Nvidia (NVDA) as a live case study. After Nvidia’s three‑year rally stalled around $167, the presenter shows how to sell a call spread...
Brent Crude Seen as a Ticking Time Bomb | the Trade
The Trade episode focused on Brent crude’s recent surge past $126 per barrel, Iran’s warning of retaliatory strikes against U.S. assets, and the broader implications for global energy markets. Brent settled 3.5% lower at $114 after the intraday high, while technical...
Equities Spotlight: Navigating a Bonkers Equity Rally
The segment opens by labeling today’s equity market as “absolutely bonkers,” driven largely by a massive surge in AI‑related spending. Analysts point to roughly $700 billion of corporate AI investment—enough to lift U.S. GDP to about 2%—as the primary catalyst behind...
Biggest Trading Strength 📈 💪 #Shorts
The video features two traders sharing their greatest strengths and advice for improvement. One trader attributes his success to an obsessive focus on a single setup—the squeeze—demonstrating repeatable results over 15 to 25 consecutive trades. He stresses the importance of...
Natgas Natural Gas Technical Analysis Today - Elliott Wave
The video provides a technical analysis of natural‑gas (NG) prices, focusing on Elliott Wave patterns and the imminent test of a $2.75 signal line. The analyst argues that the five‑wave down move is complete, opening the possibility of a bullish...
Tony Battista Closed Amazon 20 Minutes Too Early. Left $200 on the Table. Here's What He Did Next.
The video recaps Tony Battista’s recent trading activity, highlighting his premature exit from an Amazon position that left $200 on the table and his next move into a bullish diagonal spread on Hood. Battista explains that he closed the Amazon trade...
The Biggest Lie In Timeframe
The video argues that the notion of "right" timeframes is a myth – the price you see on a daily, four‑hour, or one‑minute chart is the exact same number. Whether the market is plotted over minutes or months, 105.20 remains...
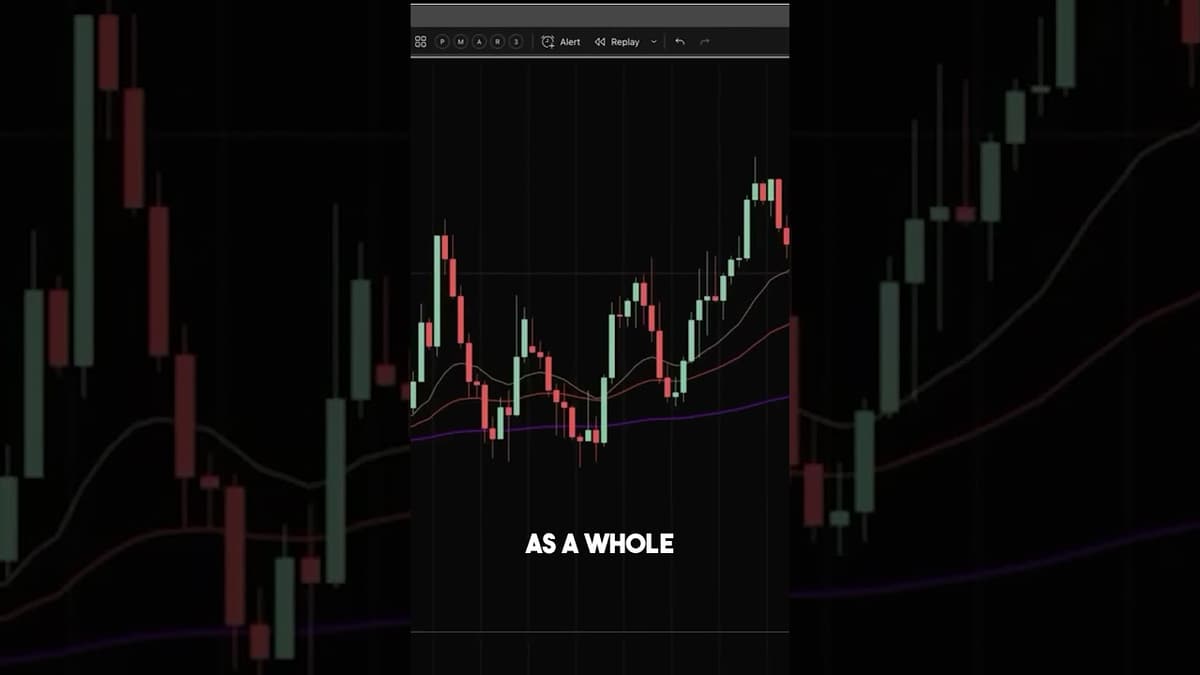
META CRASHES 10% 📉 Google & Microsoft Soar as AI War Hits Turning Point | Stock Market Live
The livestream highlighted a sharp 10% drop in Meta’s stock as the AI rivalry with rivals like Google and Microsoft reaches a critical juncture. While Meta falters, both Google and Microsoft post strong gains, propelling the broader tech index higher...
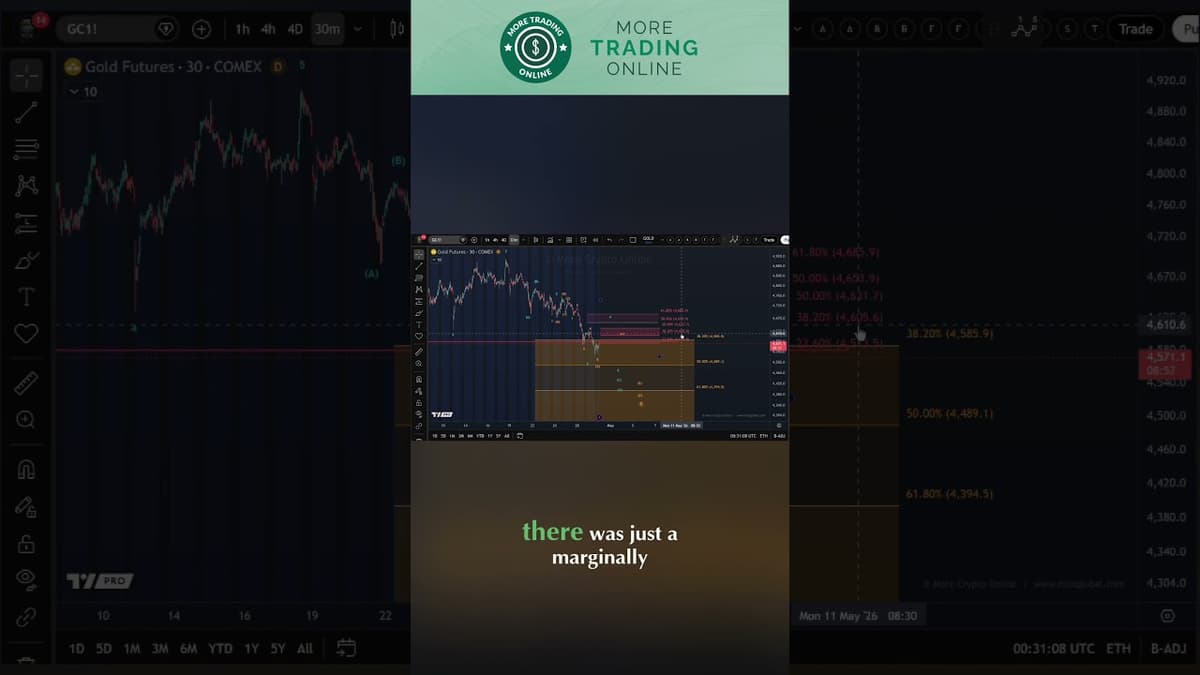
Gold Analysis - Is This the Expected Pullback?
The video provides a technical read on gold, focusing on the recent sell‑off that the analyst labels as wave three of an Elliott‑type pattern. He notes a marginally lower low since his last update, prompting a slight downward shift in the...
It Seems INSANE Markets Are Ignoring This...
The video examines why equity markets are largely ignoring rising crude‑oil prices and a higher‑for‑longer rate outlook, focusing instead on the AI narrative sparked by earnings from Microsoft, Amazon and Google. The host highlights that the Nasdaq has surged to...
This Is Your Last Chance at Generational Wealth.
The video explains why U.S. equities, the Nasdaq and Bitcoin have surged in the past month. A tentative US‑Iran cease‑fire extension, robust corporate earnings and a wave of AI breakthroughs—highlighted by the unreleased Mythos model—have restored investor confidence, prompting JP Morgan...
S&P 500 Blow-Off Top and Bitcoin to $44k | Live Setups
The video focuses on a possible blow‑off top forming in the S&P 500 and Bitcoin ahead of the Federal Reserve’s FOMC meeting. Analyst Justin Bennett argues that recent price action suggests the equity index and the leading cryptocurrency are nearing short‑term...
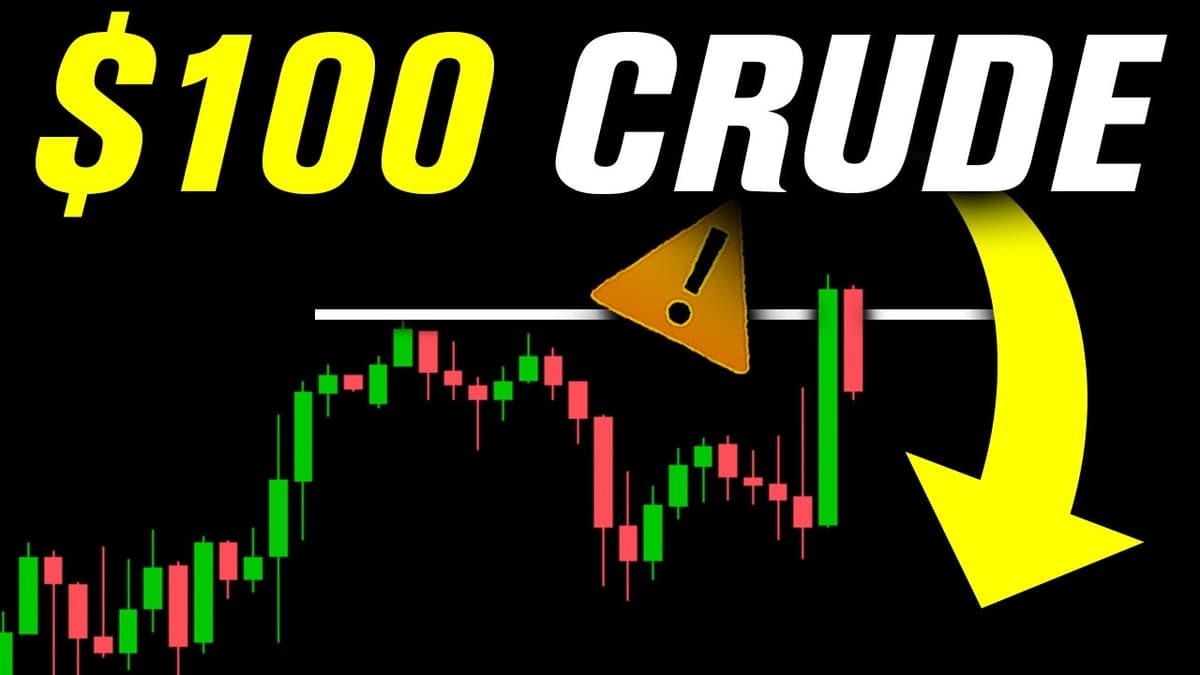
WARNING: I'm Shorting Oil NOW! Technical Analysis Signals Gold And Silver Downside Target
Gareth Soloway of Verified Investing.com warned that crude oil appears to be forming a technical top around $107 per barrel and announced he has begun shorting the market. He cited a parallel‑channel pattern and a shallow bounce off a bare‑flag...
LIVE TRADING: Trade the Close with Mike Teeto 4/28/2026
Mike Teeto hosted a live‑trading Power Hour, walking viewers through his overnight strategy of buying stocks at the close and selling the next day. He emphasized three non‑negotiable filters—pattern, volume and risk level—and showed how he builds a five‑stock watchlist...
This Trader Does Nothing Monday to Friday. His System Beats the Market Every Week.
The video spotlights Felix from Go Academy, who built a trend‑following system that deliberately avoids daily market noise. He trades only on Sundays, setting conditional orders and letting the market run while he stays emotionally detached. His approach consistently outperforms...
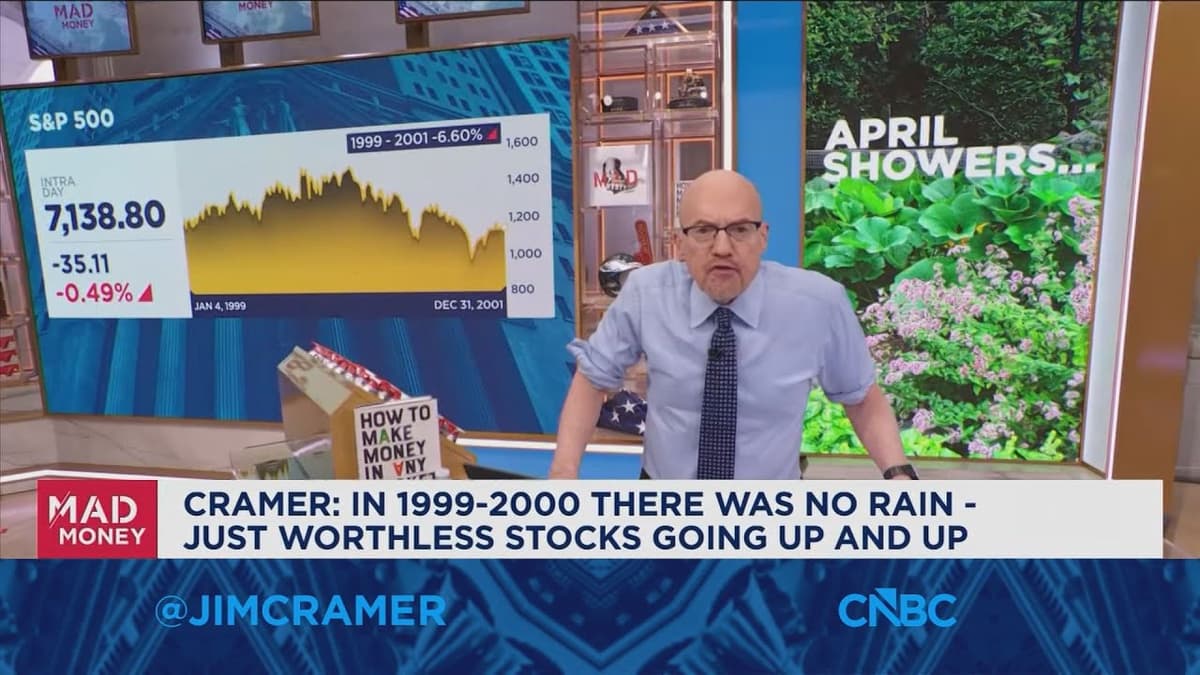
Jim Cramer Explains Why Market Sell-Offs Are Like Rain
Jim Cramer opened his Mad Money segment with a gardening metaphor, likening market sell‑offs to rain that a garden needs to thrive. He pointed to today’s modest dip—26 points in the Dow and a near‑1% fall in the Nasdaq—as a...
ONLY Scalping Strategy That Works Everyday (SIMPLE & PROVEN)
The video walks viewers through a scalping method that relies on Market Atlas, a depth‑of‑market visualizer that adds a time axis to level‑2 data. By watching liquidity pools shift in real‑time, the presenter claims traders can anticipate short‑term price direction...