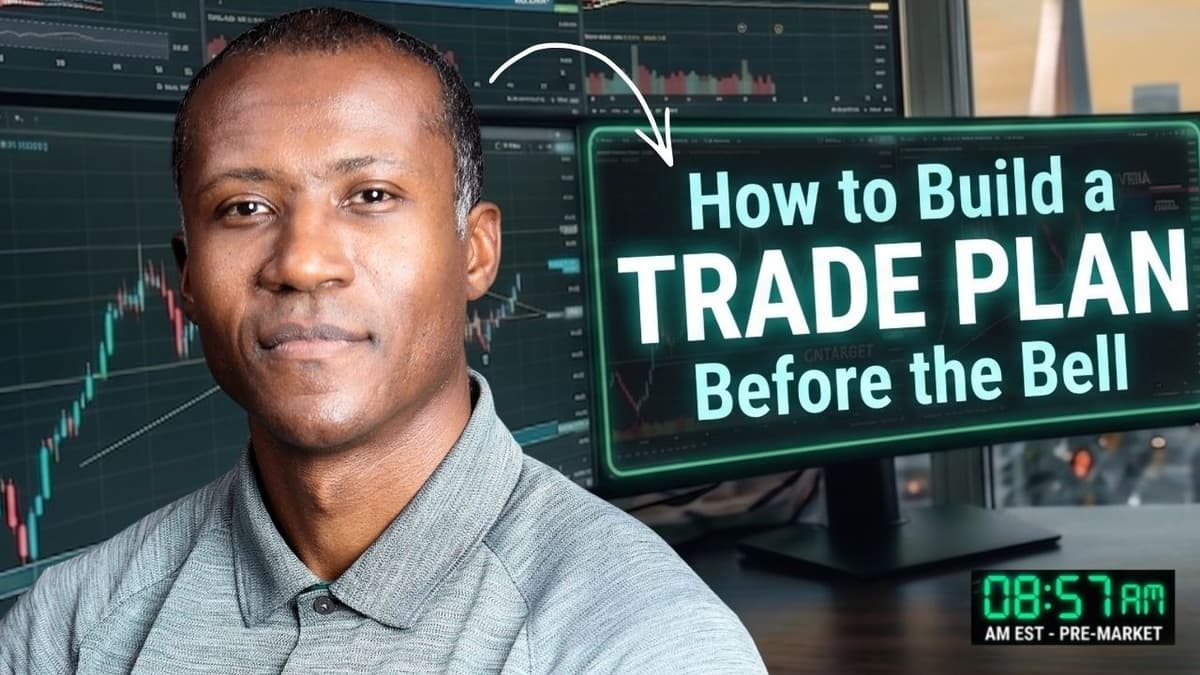
How to Build a Pre-Market Trading Plan: Day Trading Strategy for Beginners!
The video walks beginners through constructing a pre‑market trading plan, emphasizing that a solid game‑plan before the bell is essential for setting bias and managing risk. It uses the USO‑SLV inverse relationship as a case study, showing how traders can map out potential short and long scenarios before the market opens. Key insights include pinpointing resistance levels, monitoring the volume‑weighted average price (VWAP), and waiting for confirming patterns such as higher lows in USO and lower highs in SLV. The presenter stresses that a plan is not a prediction but a set of conditional actions—if price stays below a certain level, stay short; if it breaks, consider a flip trade. Examples illustrate a false daily break on SLV, a bounce off VWAP, and a head‑and‑shoulders pattern that guided entry and exit decisions. The speaker also recounts a “flip trade” where a short position was briefly abandoned for a long, only to revert when the trend confirmed the original bias. The overarching implication is that disciplined pre‑market preparation, combined with clear price‑level triggers and correlation analysis, can turn impulsive trades into systematic, repeatable strategies, giving beginners a realistic path to intraday success.
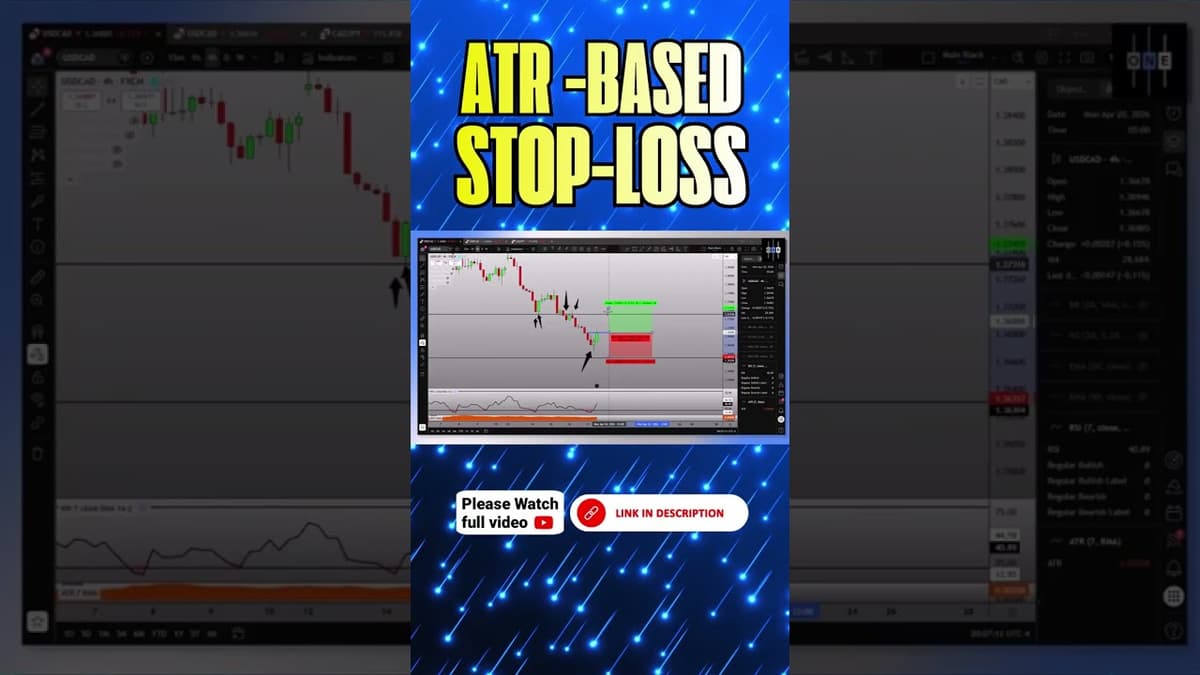
Stop Guessing Your Stop Loss… Use THIS Instead 📊 (ATR Explained)
The video walks viewers through a practical method for placing stop‑loss orders using the Average True Range (ATR), a volatility indicator. The presenter demonstrates the calculation on a sample trade, taking an ATR value of 19 and subtracting it from...
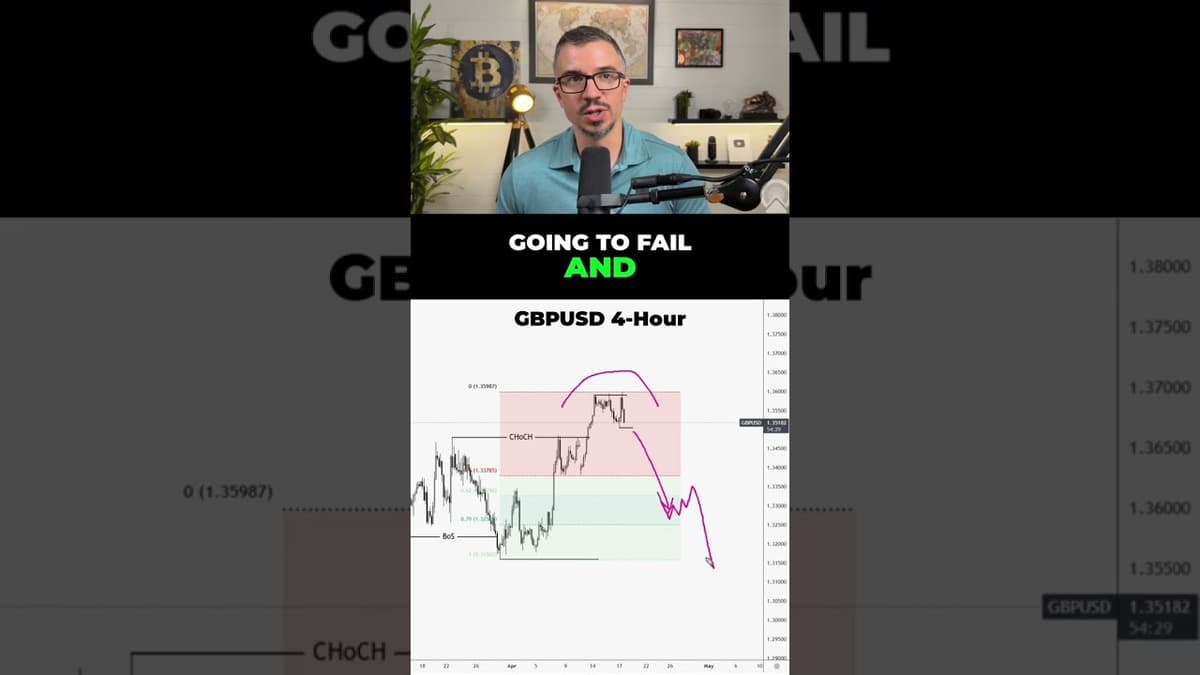
The GBPUSD Short Trap Most Traders Will Fall Into
The video warns traders about a common short‑position trap in the GBP/USD pair, centering on a price imbalance around the 1.33 level that could become the next optimal trade entry (OTE). The analyst notes that 1.33 represents a potential first target,...
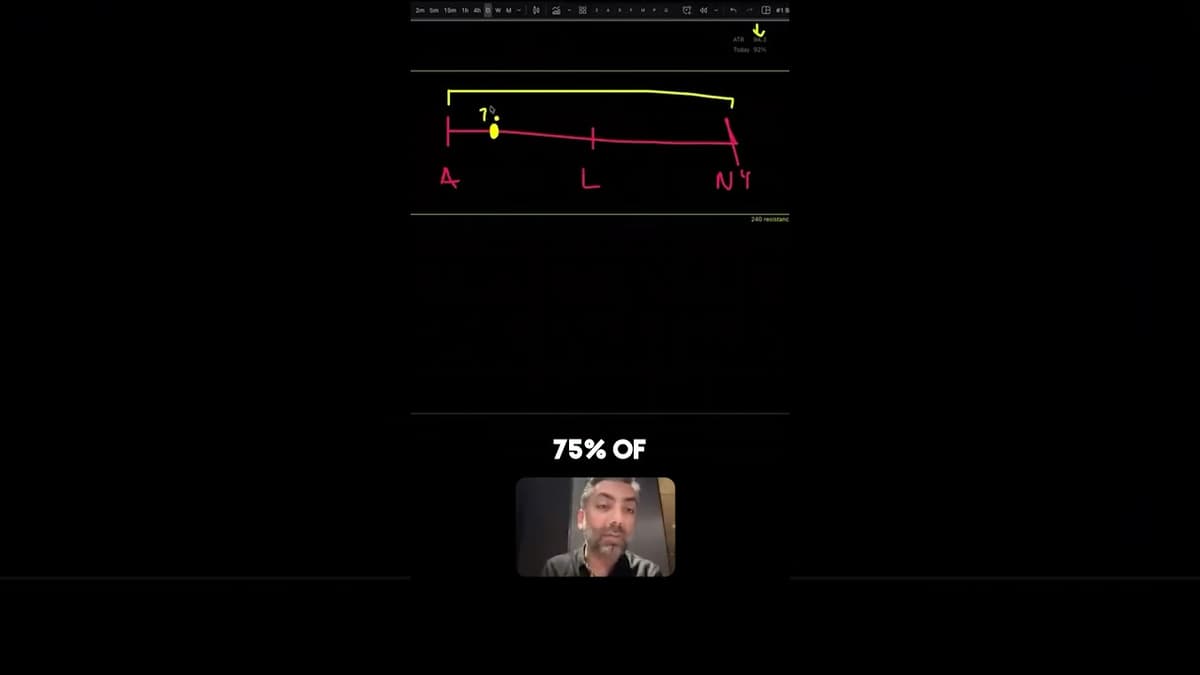
The Indicator That'll 10X Your Trade
The video describes a simple but powerful trading cue: measuring how much of a currency pair’s expected daily range has already occurred to identify days with remaining momentum. Using recent examples for various Yen crosses (e.g., USD/JPY ~92% of range,...
PDT Rule Change: Pros and Cons #investing #trading #financialeducation
The video discusses the recent relaxation of the Pattern Day Trader (PDT) rule, which eliminates the $25,000 equity minimum and the three‑trades‑in‑five‑days restriction, allowing a broader set of investors to execute day trades. The host highlights two main advantages: a lower...
The Truth About Scalping (Before You Try It)
The video demystifies scalping, emphasizing that it is a high‑velocity trading style suited only for a niche personality type. It stresses that scalpers must make split‑second decisions and instantly process market feedback, a stark contrast to the deliberative approach of...
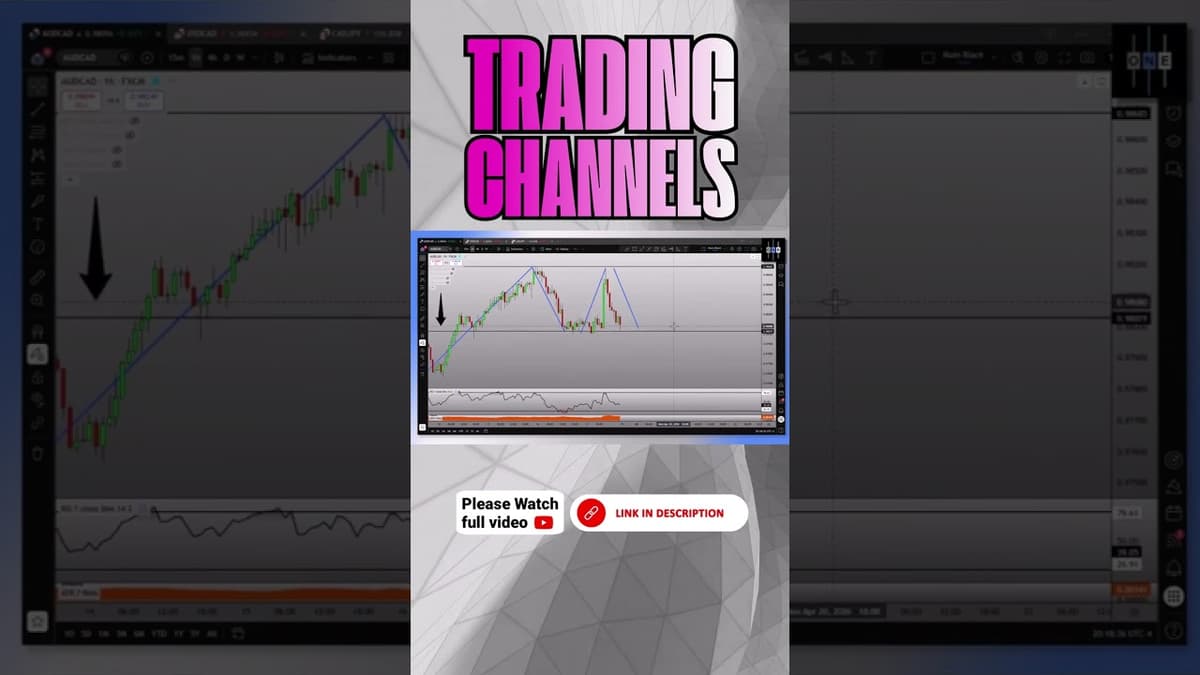
This Channel Trade Was TOO Easy 😳 (Insane Risk to Reward)
The video dissects a classic channel‑trading setup on the hourly chart, where price oscillates between a historic support line and a resistance line, creating a tight consolidation zone. The presenter notes that each bounce has respected those boundaries, suggesting a pending...
It Can't Possibly Go Any Higher...
The video opens with Matt warning viewers not to be surprised by market moves, emphasizing that emotional reactions lead to poor timing. He then dives into the SPY weekly chart, highlighting a solid green‑bodied bar, higher highs and higher lows,...
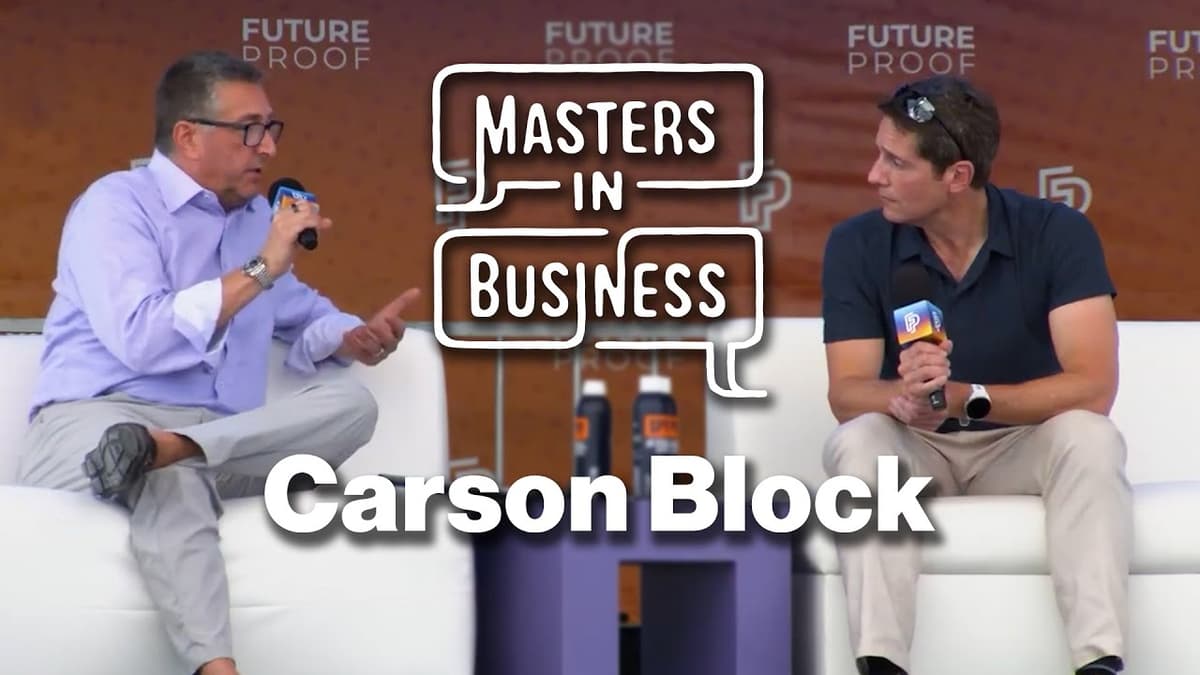
Short Sells Fight for Edge Over AI: Masters in Business with Carson Block
In this Masters in Business interview, Muddy Waters founder Carson Block discusses how activist short‑selling has evolved amid cheap money, AI breakthroughs, and expanding fraud across market tiers. He recounts his early exposure to Chinese reverse‑merger scams, the rise of...
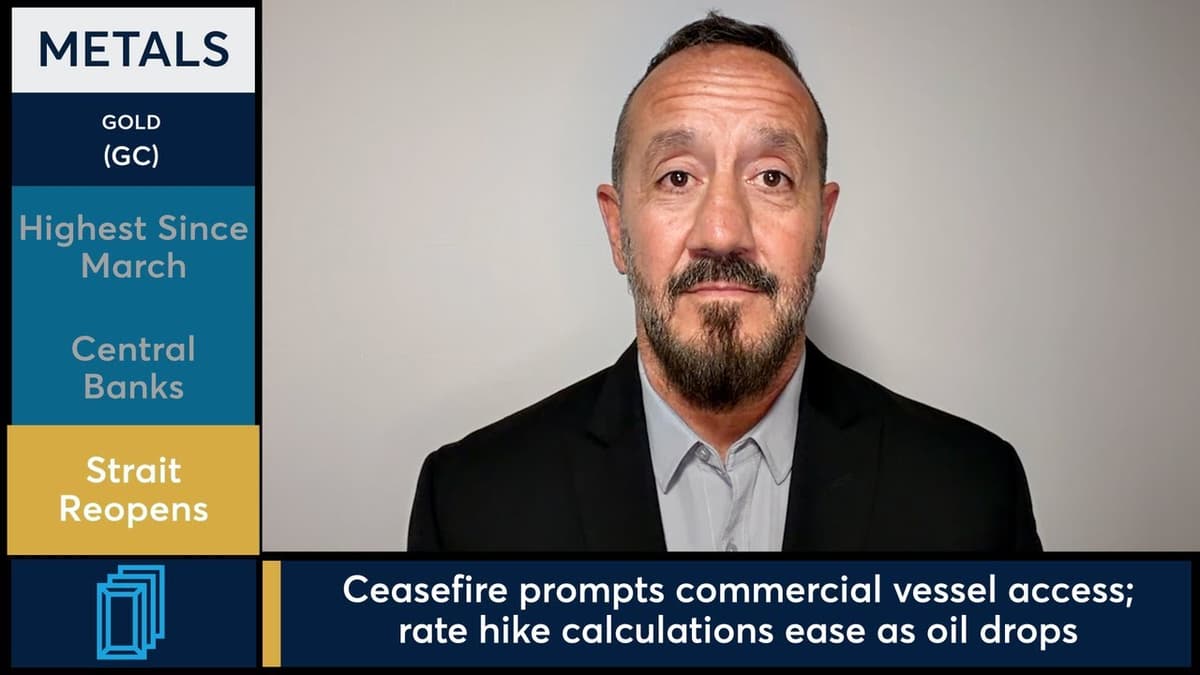
Gold Futures Hit a 1-Month High on Strait of Hormuz Ceasefire. 4/17/26
Gold futures surged to $4,917.70 per ounce on April 17, the highest level since March 18, marking a fourth straight weekly gain. The metal is up more than 54% over the past 12 months, buoyed by sustained central‑bank accumulation, including...
Don't Get Shaken Out! How to Hold Winning Trades During High Volatility
Volatile markets demand that position sizing and risk control become the trade’s foundation rather than an afterthought. The presenters stress that traders must anchor entries, exits, and stop‑losses on objective metrics such as the Average True Range (ATR) and pre‑market...
The DXY Just Did Something Every SMC Trader Needs To See (US Dollar Analysis)
The US Dollar Index (DXY) displayed a bullish change of character on the daily chart, breaking structure and hinting at upside momentum. Traders are eyeing the 97.50 monthly support level, a key discount zone that has held since 2011. A...

LIVE: Stocks Hit Record Highs. Is $SPX 8,000 Coming? $SNDK $TSLA $NVDA
The live broadcast centered on the market’s unprecedented rally, with the Nasdaq climbing 13 sessions in a row and speculation that the S&P 500 could breach the 8,000‑point mark. Participants highlighted the rarity of such an extended upside—only ten comparable rallies...
“Day Trading vs Swing Trading: Which Is Best for Beginners?”
The video titled “Day Trading vs Swing Trading: Which Is Best for Beginners?” argues that newcomers should steer clear of high‑frequency day trading and instead adopt swing or end‑of‑day approaches. The presenter stresses that day trading’s rapid tempo magnifies mistakes, making...
Is It A Pullback Or Reversal
The speaker argues that extended pullbacks within an uptrend are not necessarily trend reversals and that even multiple stop-outs do not invalidate the original bullish thesis. Traders should first establish whether a genuine trend exists, then focus on timing entries...
First Solar (FSLR): The AI Power Trade Nobody’s Watching ☀️ #FSLR #SolarEnergy #TTMSqueeze
First Solar (FSLR) is being highlighted as a hidden AI‑power play, as recent U.S. Energy Information Administration data shows solar accounted for roughly 65‑70% of all new generation capacity. The commentator argues that expanding AI workloads will strain the grid,...
Use Indicators to CONTROL Risk (Not Just Entries) 📊⚠️
The video explains how traders can use the Parabolic SAR indicator not merely for entry signals but as a systematic tool to control risk. By converting the SAR’s trailing dots into a dynamic stop‑loss, investors can let the indicator dictate...
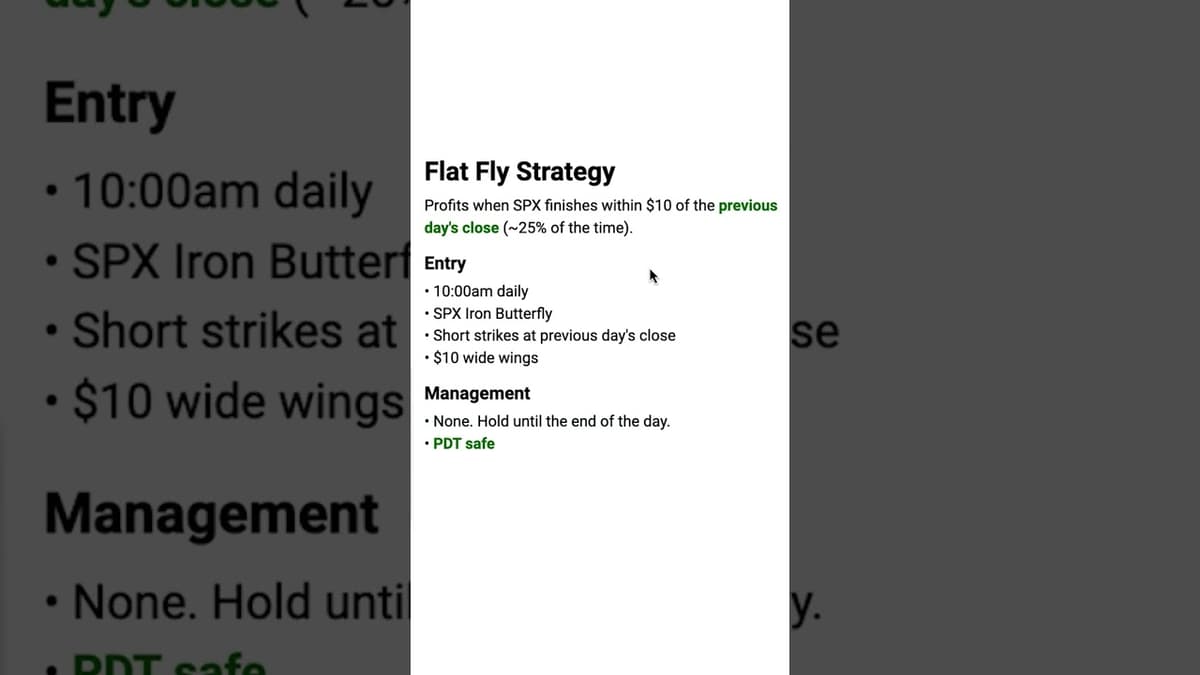
A Strategy for Flat Market Days (Flat Fly)
Jack Slocum of Option Alpha unveils the “Flat Fly,” an iron‑butterfly strategy designed for days when the market trades sideways. The bot “Flat Flyer” automates trade entry, setting short strikes at the previous day’s close with $10 wings, generating a...

Crypto Corner: BTC, ETH Iran Resiliency & Kevin Warsh's Crypto Holdings
The segment opened with Schwab’s Adam Lynch highlighting crypto’s recent price surge, noting Bitcoin’s 14% gain and Ethereum’s 23% rise since the onset of the U.S.–Israel‑Iran tensions. Both assets now sit near their 100‑day moving averages, suggesting a potential new...
April 16th, 2026 LIVE Stocks, Options & Futures Trading with Pros!(Market Open, Last Call & More)
Tastylive, a financial media network, now delivers over 120 original live segments each day, featuring more than 25 on‑air personalities who provide market commentary and trading education. The programming targets both novice and seasoned traders, emphasizing actionable insights while explicitly...

Brent & WTI: Has a Top Formed?
The video dissects current price action in WTI and Brent crude, asking whether a top has formed. It maps short‑term pullbacks against longer wave structures and highlights key Fibonacci‑derived support and resistance zones. Key insights include WTI’s descent to the first...

Trading With Vs. Without Indicators: The Reality?
The video pits technical indicators against pure price‑action trading, featuring a full‑time scalper who has used both approaches. He explains why the debate isn’t about a single “best” tool but about fitting a method to one’s mindset and execution style. He...
![My Confirmation Process For Consistent Wins [LIVE]](/cdn-cgi/image/width=1200,quality=75,format=auto,fit=cover/https://i.ytimg.com/vi/RyTFP22ppU0/maxresdefault.jpg)
My Confirmation Process For Consistent Wins [LIVE]
In a live session, Simpler Trading’s Melissa outlines her “confirmation process,” a rule‑based method for entering supply‑and‑demand zones on the S&P 500 and related instruments. She stresses dropping to a lower timeframe—typically a 2‑hour chart for daily zones—to watch for a change...

WAIT OR CHASE - APR 15 - Stock Market LIVE, Live Trading, Stock News
The live broadcast on April 15, 2026 – tax day – opened with a reminder that the day historically weighs on equities, and the hosts set the tone for a session dominated by market mechanics rather than breaking geopolitical news. They highlighted...

Bullish Signals Are Back — But Inflation Is Still Rising…
The video discusses a rapid market swing, noting that bullish signals have re‑emerged for many of the “MAG‑seven” tech giants and for leading cryptocurrencies after a period of broad bearishness. Google, Netflix, Amazon, Nvidia and Meta now show green trends, while...

Options Corner: UBER Extending Robotaxi Reach
The Options Corner segment dissected Uber’s recent share performance, noting a modest 1.5% decline year‑to‑date while the broader S&P 500 surged roughly 29%. Analysts highlighted that Uber remains entrenched in a downward‑sloping channel, with the price hovering near the channel’s...

SPX Gap: Massive Breakout or $7,000 Bull Trap? 🚨 #Barchart #SPX #Trading
The video examines the recent S&P 500 gap that vaulted the index above its 200‑day, 100‑day and 50‑day moving averages, prompting debate over whether the move represents a genuine breakout or a deceptive bull trap. The presenter emphasizes that the...

Financial Market Preview - Wednesday 15-Apr
Faxet’s Wednesday market preview highlighted a broadly risk‑on environment as Asian technology indexes surged, European equities held steady and U.S. futures pointed to a flat open after Tuesday’s gains. Taiwan’s TX index posted a second‑consecutive record high, while South Korea and...

EURUSD Traders Aren't Ready For What's Next
In this video, trader Justin Bennett cautions that the recent EUR/USD rally may be a temporary correction rather than a durable uptrend, using Smart Money Concepts (SMC) to dissect the price action. He highlights a clear break of structure on...

Trading High Impact News
Mariana explains how traders can harness high‑impact news events to generate outsized moves while mitigating the inherent volatility. She outlines a step‑by‑step workflow that starts with pre‑news preparation, moves through disciplined order execution, and ends with post‑release analysis. The video...

Oil Down, GLD, SLV, BTC & Stocks Up: CFOF LIVE From Cboe
Crude oil prices slipped, opening the door for a risk‑on rally that lifted stocks, gold (GLD), silver (SLV) and Bitcoin. A panel of market strategists from Cboe discussed how lower energy costs are boosting equity momentum while still supporting precious‑metal...

Goldman Got Paid From the Chaos. Here's How Options Traders Can Too.
Goldman Sachs reported earnings that topped analysts’ forecasts, yet its shares slipped after the bell. The bank’s trading and investment‑banking units generated strong revenue, but broader market stress kept the stock under pressure. The profit boost stemmed from heightened trading activity...

THE LONGEST RALLY IN 5 YEARS!?!? - APR 14 - Stock Market LIVE, Live Trading, Stock News
The live stream highlighted that the Nasdaq‑100 ETF (QQQ) is on a nine‑day winning streak, positioning it for the longest rally in five years if today closes green. The host linked the market optimism to broader geopolitical developments, noting cease‑fire...

Tastylive Viewer to NYSE ETF Founder Has Full Circle Moment With Tony Battista
The interview spotlights Robert Pascarella, a longtime tastytrade viewer who has come full circle to launch Peerless ETFs’ NYSE‑listed fund, ticker WHEEL, and even ring the exchange bell in May 2024. His journey from retail futures trader to registered investment adviser...

Bitcoin: The Micro Breakout Vs. The Macro Crash (Watch These Levels!)
In a recent Verified.com video, chief market strategist Gareth Soloway dissected Bitcoin’s chart, contrasting a long‑term bearish flag with a short‑term bullish breakout, and extended the analysis to Ethereum, Solana and XRP. Soloway highlighted a three‑pivot top pattern that historically precedes...

The Complete Day Trading Guide for Canadians 2026
The video delivers a comprehensive roadmap for Canadians who want to start day trading, covering regulatory constraints, platform options, trading strategies, and tax considerations. It explains why TFSA and FHSA accounts are unsuitable for day‑trading businesses, clarifies that the U.S....

S&P 500 Technical Analysis Major Decision Point, Elliott Wave Analysis Today and Price of S&P500 SPX
The video provides a technical update on the S&P 500, focusing on a pivotal decision point after a roughly 10% rally from the March low. The analyst ties the price action to Elliott Wave theory, suggesting the recent advance may...

LIVE TRADING: Trade the Close with Mike Teeto 4/14/2026
Mike Teeto’s “Live Trading: Trade the Close” streams a power‑hour of real‑time market scanning each Tuesday from 2 p.m. to 3 p.m. Central Time. Viewers watch Teeto pinpoint high‑momentum stock setups, construct a next‑day watchlist, and outline entry, exit, and risk parameters...

Turn Losing Stocks Into Income ( The Wheel Strategy Explained )
The video breaks down the "wheel" options strategy, a repeatable income‑generation loop that starts by selling cash‑secured put contracts on stocks you’d eventually like to own. Premiums collected while waiting for a price drop provide cash flow before any shares...

Simple 1-Minute Breakout Trading Strategy I Use Every Day (Live Trades)
The video walks through a one‑minute opening‑range breakout strategy, emphasizing the use of the Market Atlas order‑flow tool to spot large buy orders that signal a bullish breakout. Real‑time examples include AMD’s daily chart breakout above $235 and a rapid...

Most Traders Stop Selling Strangles When the Market Drops 3%. The Data Says That's the Wrong Move.
The video examines a six‑year SPY options study that tests selling 45‑day, 16‑delta strangles after market pullbacks of 1%, 2% and 3% or more. By initiating trades on down‑days, the author isolates how volatility spikes affect premium collection, capital requirements,...

How To Profit When Stocks Crash
The video introduces mean reversion trading as a way to profit when stocks crash, contrasting with typical trend‑following buying. It explains the mechanics: prices revert to their average, likened to a stretched rubber band, and overreactions driven by fear create buying...

Trail Your Stop Loss Like a Pro 📉🔒
The video explains how to trail a stop‑loss using pure price‑action signals rather than arbitrary distances. When price creates a new structure high—marked by a green candle closing above the prior high—the trader moves the stop below that breakout level, using...

Someone Just Bought 6,000 Nvidia Calls in One Block. Jermal Says That's the Signal.
Tastylive highlighted an unusual options surge in Nvidia (NVDA) where $8.3 million of premium changed hands in a single session. While $5 million of that premium backed bearish puts, $3.3 million supported bullish calls. The standout move was a 6,095‑contract call block that...

Palantir Has a ZEBRA Trade That Costs Less Than Buying Shares. Nick Battista Breaks It Down.
The video walks viewers through three option‑based ways to gain exposure to Palantir (ticker: PLTR) without simply buying the dip. Nick Battista first explains a covered‑call on 100 shares near the $130 price, selling a 30‑delta $150 call for roughly...

If You Trade Crossovers… Watch This First
The video introduces an "igniting" trading methodology that focuses on entering a position the moment a new directional bar appears, rather than waiting for a trend to be confirmed. The presenter contrasts this with traditional momentum strategies, which typically require...

Palantir Just Got a Presidential Tweet. Tim Knight Is Still Short.
Tim Knight’s latest market‑watch video centers on the recent presidential tweet praising Palantir (ticker PLTR) and his continued short position despite the endorsement. He outlines a broader market fatigue after two weeks of recovery rallies, noting that major indices sit at...

V-Shaped Rally Lifts Stocks as Semiconductors Lead to All-Time Highs
The video examines a sharp V‑shaped market rally sparked by a de‑escalation between the United States and Iran, highlighting semiconductor leadership and broad market breadth. Semiconductors surged 22% in eight days, pushing the Nasdaq 100 up roughly 4‑5% for the week...

Main Chart | TRACE Walkthru #3
The video walks users through Trace’s main chart, a real‑time heat map that translates S&P 500 options flow into visual signals. By layering three analytical lenses—gamma, delta pressure and charm—the platform aims to show where market pressure is building and how...

GEX Lens | TRACE Walkthru #2
The video walks users through the GEX Lens interface, emphasizing the left‑hand strike plot that visualizes options positioning for different market participants. By toggling between open interest, net OI, and the GEX lens, traders can see contract volumes or gamma...