
QQQ Rally Trap? Here’s the Put Spread I’m Scaling Into Now
Sam’s free Friday video recaps the Mastering the Trade room, zeroing in on a bearish‑biased QQQ put spread strategy ahead of the April options expiration. He opened a 570‑500 put debit spread expiring September, paying roughly $11 and $7 per contract for a total risk of about $3,000. The position is being scaled, waiting for SPY resistance and a confirming down‑arrow momentum signal before adding more contracts. Beyond QQQ, Sam checks HYG, noting it sits just above the 80‑level, signaling continued bullish credit market sentiment. He flags a strong semiconductor chart and proposes a pullback entry on IWM at the 256.5 VWAP, paired with an at‑the‑money put credit spread to capture high IV. The overarching theme is a risk‑first, scalable approach that lets traders adjust exposure whether the market swings down after OPEX or rallies higher, offering flexible hedges for volatile tech‑heavy indices.
PSEi Caps Shortened Trading Week with Modest Gains | ANC
Philippine shares closed the shortened trading week with modest gains as the PSEi tracked a regional rebound—the first weekly rise in Asia since the Middle East conflict began—while investors remained cautious ahead of U.S.–Iran talks. Market participants described the session...

Amazon Is Up 2% Today. Tony Battista Is Fading It With a $400 Iron Condor Before Earnings.
The video focuses on Amazon’s recent 2% rally, with the stock trading around $260, and outlines a options trade that analyst Tony Battista proposes ahead of the company’s May 7 earnings. Battista constructs a wide iron condor, selling a 215‑put and...
![[LIVE] Pre-Market Prep – CPI Inflation Report Live Market Reaction](/cdn-cgi/image/width=1200,quality=75,format=auto,fit=cover/https://i.ytimg.com/vi/Rpg-LcWa0m8/maxresdefault.jpg)
[LIVE] Pre-Market Prep – CPI Inflation Report Live Market Reaction
The Trade Brigade live stream offers pre‑market technical analysis ahead of the U.S. Consumer Price Index (CPI) inflation report, targeting futures and options traders. The program outlines key price levels, market sentiment, and potential volatility before the 8:30 AM EST data...

The “Trifecta” Setup That Hits 92% Accuracy
The video introduces the “trifecta” setup – three concurrent price surges off a flat 200‑period moving average across 2‑,5‑,15‑minute charts, claimed to yield up to 92% accuracy. The presenter explains that the 200‑MA acts as a flat zone; when price drops...

Neocloud Stocks To Watch 🚀 #Shorts
The clip spotlights “Neocloud” high‑momentum stocks that have attracted short‑seller attention, emphasizing their pre‑earnings rally potential. Host highlights Nevus, which surprised analysts with earnings and now trades in a classic pre‑earnings rally, eyeing $160‑$180 targets if it breaks current highs on...

TRACE Reloaded - Trade the S&P with Institutional Precision | SpotGamma
SpotGamma unveiled Trace Reloaded, an upgraded platform that visualizes S&P 500 options gamma (GEX) in real time. The tool updates every minute, delivering a color‑coded heat map that shows where market makers are buying or selling options. The new version adds...

Today's Dow Winners Tell Us Investors Think Rates Are Coming Down, Says Jim Cramer
Jim Cramer highlighted that today’s Dow leaders—Sherwin‑Williams, Caterpillar, Home Depot and Goldman Sachs—signal a market belief that the Federal Reserve will soon ease interest rates. He linked the rally to a tentative cease‑fire in the Middle East and a six‑year‑low...
![Low Risk SPX Day Trading Strategy [Part 2]](/cdn-cgi/image/width=1200,quality=75,format=auto,fit=cover/https://i.ytimg.com/vi/toeDB4W0X6Y/maxresdefault.jpg)
Low Risk SPX Day Trading Strategy [Part 2]
Jack Sloum of Option Alpha walks viewers through the second phase of his Flatfly day‑trading system – an iron‑butterfly spread anchored at the previous day’s S&P 500 close with $10 wings. He explains how the bot automatically opens these low‑risk contracts,...

How to Find High Probability Swing Trade Setups Step by Step
The webinar, hosted by Barchart senior market strategist John Roland, walks viewers through a step‑by‑step method for locating high‑probability swing‑trade setups. It positions swing trading between long‑term investing and day‑trading, emphasizing the blend of sector‑level macro analysis with day‑trader‑style risk...

Gold Analysis - This Rally Might Not Last
The video provides a short‑term technical update on gold, focusing on whether the recent breakout above the April 1 swing high can sustain momentum. The analyst maps the price action onto Elliott‑wave labels, emphasizing that the crucial factor is price staying...
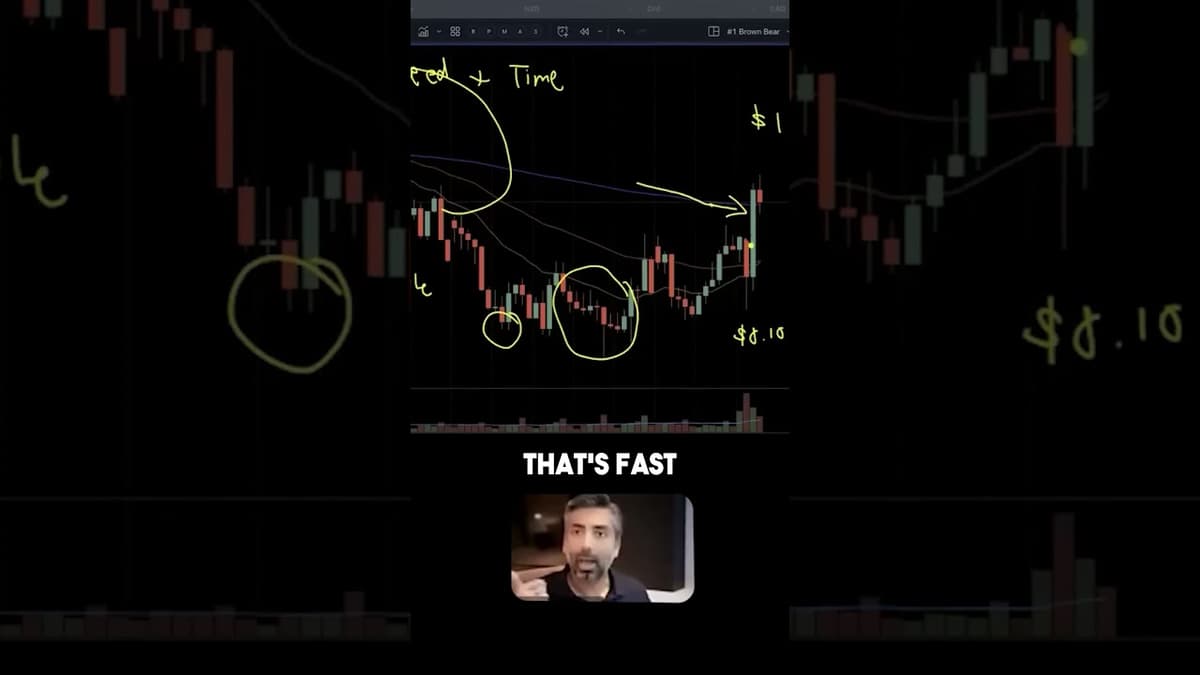
Never Jump On Trend Blind
The video warns traders against blindly jumping on trend moves and urges them to analyze the speed and duration of price changes. It recommends comparing current moves to historical behavior to judge whether a drop is accelerating or decelerating. A...

TRUMP ANNOUNCES IRAN CEASEFIRE - STRAIT OF HORMUZ REOPENS
The video reports that former President Donald Trump and Iran have reached a tentative two‑week cease‑fire agreement, which immediately reopened the strategic Strait of Hormuz. The announcement sent oil prices tumbling about 15% and lifted S&P 500 futures roughly 2.25%,...

Market Call: Colin Cieszynski's Outlook on Technical Analysis (April 7, 2026)
Colin Cieszynski, portfolio manager and chief market strategist at SIA Wealth Management, joined Market Call to field listener questions on technical analysis amid heightened geopolitical tension. He framed the current market environment as a six‑week period of pronounced volatility since...

Mosaic: Supply Tailwinds or Cyclical Risks?
TD Act Trader Live examined Mosaic (MOS) as the focal point, contrasting bullish supply‑side tailwinds with bearish cyclical concerns amid geopolitical tension in the Middle East and an upcoming earnings season. Bull arguments highlighted China’s extended phosphate export ban, removing 1.5 million...

How To Master Trading Reversals On The 5 Min (All You Need To Know)
The video walks viewers through mastering reversal trades on a 5‑minute chart, outlining five (actually six) distinct patterns—strong supply/demand zones, head‑and‑shoulders, double/triple tops, trend‑line breaks, range reversals, and trading with the prevailing trend. It emphasizes entry tactics such as double‑reaction...

Why Your Trading Strategy Still Doesn’t Work
The video argues that a trading strategy is a high‑level framework, not a rigid set of rules, and that many traders mistake a failed trade for a failed strategy. It emphasizes that execution must adapt to the specific market situation...

"Mean Reversion" Explained
The video breaks down the concept of mean reversion, arguing that asset prices and company earnings inevitably drift back toward their historical norms. It stresses that this tendency is a powerful market force, observable in both over‑performing and under‑performing firms,...

Gold Analysis - Has the Breakout Attempt Failed?
The video examines gold’s ongoing corrective phase that began in January, outlining an Elliott‑wave‑style A‑down, B‑up, C‑down pattern and suggesting the market may be approaching the final leg of this move. The analyst notes that if another low materialises, price could...

AMD Just Flipped Bullish — Here’s the Trade Setup (Targets + Risk Levels)
The video focuses on AMD’s recent price action and a revised trade idea from the host, Danielle. After watching the chipmaker hover at its 200‑day simple moving average, the stock failed to break lower and instead rallied, prompting a shift...

STOP BUYING THE TOP🤯 Why Late Momentum Entries Fail
The video warns traders against jumping into the market at the peak of a large opening green candle, using recent AMD and Intel moves as case studies. It argues that the initial surge often triggers FOMO, leading many to chase...

Natgas Natural Gas Technical Analysis Today - Elliott Wave and Price News
The video provides a technical read on natural‑gas futures, focusing on Elliott Wave structures and key price levels. The analyst notes that the market has yet to post a decisive lower low beneath the February trough, and a clear bottom...

Price Action Isn’t an Indicator… But It’s the Best One 📉🔥
The video argues that price action, while not a conventional technical indicator, is the most reliable gauge of market sentiment. The presenter emphasizes that many traders mistakenly treat price action as an indicator, yet it fundamentally reflects buying and selling...

Nike Just Had Its Worst Earnings in Years. This Trader Is Catching the Knife. Here's Why.
The video dissects Nike’s latest earnings report, which missed expectations and slashed guidance, sending the stock down roughly 15% in a single session – the worst performance in years. The host, a day‑trader, argues the move has left Nike dramatically...

DXY Just Flashed a Bullish CHoCH (Here’s What I’m Watching Next)
The video analyzes the U.S. Dollar Index (DXY) after a bullish change of character (CHoCH) on the 1‑hour timeframe, suggesting the pair has shifted from a corrective pull‑back to an upward trend. The host points to a potential new break of...

I Made $5000 Day Trading… Then Gave It All Back😅 #traderlifestyle
The video follows a Toronto‑based day trader who documents a volatile trading day that yielded a $5,000 gain before he partially gave it back. He frames the session against a broader market bounce that surprised many after two weeks of...

ORB Strategy EXPOSED: How to Tell a Real Breakout From a Trap (Don't Trade Without This)
The video introduces the Opening Range Breakout (ORB) framework, a systematic intraday approach that focuses on the first 15‑ to 30‑minute candle after the market opens. By marking the high and low wicks of that candle, traders create clear support‑resistance...

The Safety of Momentum Stocks
The video argues that in today’s down‑trending market, the safest haven is not cash but momentum – stocks that are actively moving. Breakouts and breakdowns no longer signal reliable entry points; most indices are merely chopping in a weak trend. Traders...

Did You Fall for It?!
In the latest Trade Brigade weekend show, host Matt dissected Thursday’s surprisingly strong rally in the S&P 500 (SPY) and concluded that, despite the flash‑gain, the market’s underlying downtrend remains intact. He highlighted that the monthly chart still forms a higher‑low pattern,...

Market Technical Update: Charts Don't Lie
The weekend technical briefing focused on a news‑driven swing in the equity markets, highlighting the S&P 500’s sharp decline earlier in the week followed by a rapid rebound into the 6,580‑6,600 resistance zone. The host emphasized that while the rally appeared...

The #1 Market Takeaway in 2026? Confusion.
The video highlights that retail investors are collectively bewildered by the erratic market behavior in 2026, where rapid swings make conventional strategies feel obsolete. Recent trading days illustrate the dilemma: a short position at the S&P 630 low was instantly reversed...

The Signal Before the Spike | Katie Stockton on What the Charts Tell Us About What Comes Next
In this interview, technical analyst Katie Stockton breaks down the latest chart signals shaping equity and commodity markets. She highlights a fresh monthly MACD sell crossover on the S&P 500, confirming dwindling intermediate‑term momentum and aligning with a DeMark 13 counter‑trend...

Microsoft Just Hit 2025 Tariff Lows Again. Here's the Options Math on Whether It Recovers.
The video examines Microsoft’s slide to its 2025 options‑price low, hovering around $350, and uses options‑pricing models to gauge recovery scenarios. Host Mike outlines recent price action—down from a $550 peak to the mid‑$300s—and highlights analyst price targets near $587,...

There’s No “Best” Indicator… Here’s Why 📊❌
The video argues there is no single “best” technical indicator; traders must select tools that suit their individual style and market philosophy. It emphasizes distinguishing popularity from effectiveness, and advises aligning indicator choice with whether one trades trends, counter‑trends, extensions or...

⚠️ NFP WARNING: Low Liquidity + NFP = DANGER
The video warns traders about the hazardous combination of a major economic release—non‑farm payroll (NFP)—and unusually thin market liquidity caused by bank holidays surrounding Good Friday and Easter. With U.S. banks closed, trading volumes contract, making price discovery harder just...

Seismic Market Rotations with Travis Prentice, CIO of Informed Momentum Company
The Planet MicroCap Podcast featured Travis Prentice, CIO of Informed Momentum Company, discussing his "informed momentum" framework—where price trends intersect with fundamental health—to navigate today’s AI‑driven, physically‑oriented market rotation. Prentice explained that while classic academic momentum uses a 12‑month look‑back,...

SPX Squeeze Fired… and Bears Should Be Worried
Taylor’s nightly market recap highlighted a rare bearish rating turning neutral, focusing on the S&P 500 weekly squeeze that fired short and prevented a catastrophic drop. He explained that the S&P’s squeeze, built since January, released upward momentum instead of a...

Daily Profits From Micro Futures “Quick Trades”?
Taylor Horton of Simpler Trading outlined a micro futures day-trading strategy aimed at generating consistent weekly income by trading lower-timeframe setups rather than hunting large, multi-week breakouts. He relies on a custom ‘squeeze’ indicator and a watchlist that flags A+...

Link Your Brokerage to Barchart | Turn Your Portfolio Into a Trading & Screening Tool
The video walks users through linking a brokerage account to Barchart’s Investor Portfolio, turning a simple holdings list into an interactive trading and screening hub. After selecting the Investor Portfolio under the Tools tab, users can choose to link a brokerage,...

How To Catch The Turn
The video walks viewers through a specific price‑action setup called "the turn," emphasizing how candle movement changes from a steady rise to a chaotic finish. By tracking the shift in candle dynamics, traders can spot an early warning sign that...

How to Identify the Trend and Ignore the Noise
The video teaches a practical framework for spotting genuine market trends while discarding the visual clutter that misleads most traders. By focusing on clear market structure—higher highs, higher lows in uptrends and lower lows, lower highs in downtrends—the presenter shows...

This ONE Indicator Made Me A Profitable Trader
The video introduces a proprietary market‑context indicator that the presenter credits with turning his systematic trading from erratic to consistently profitable. The tool condenses three core market‑context variables—trend direction, relative volatility and market noise—into a single dashboard that flashes a green...

Gold’s 200-Day Bounce: Reversal Signal or Market Trap? #barchart #gold #investing #markets #gld
The video examines gold’s recent bounce off its 200‑day moving average, asking whether the move signals a genuine reversal or a market trap. The presenter notes that the last time gold rebounded from this technical level in late 2023, it...

Option Trades To Profit From Market Volatility (Backtest and Automate a Strategy)
Jack Sloum of Option Alpha walks viewers through live option‑trade selection aimed at profiting from heightened market volatility. He demonstrates how to filter millions of potential iron condor and spread setups to isolate a handful of high‑probability, high‑reward opportunities that...

Options Corner: BA Sees Tight Correlation with SPX
In this Options Corner segment, lead market technician Rick Duquette examines Boeing (BA) stock, noting its unusually tight correlation with the S&P 500 and how that relationship can serve as a trading signal. Duquette points out that BA is trading in...

Chart of the Day: PLTR Sideways Trading Action
The video spotlights a technical‑focused chart of the day for Palantir Technologies (PLTR), featuring senior manager Rachel Deshele of Charles Schwab’s trading services. The discussion centers on the stock’s recent month of flat, sideways movement and the potential for a breakout...

Oil Spiked to $102. Banks Are Screaming Recession. Here's the Trade That Profits Either Way.
The video examines the confluence of rising recession forecasts from major banks and a sharp jump in crude oil prices to around $102 per barrel, asking whether the market can profit regardless of the outcome. Goldman Sachs now sees a 30%...

WTI & Brent Crude Oil Technical Analysis - Elliott Wave Update
The video provides an Elliott‑wave‑based technical update on both WTI and Brent crude, focusing on current pull‑backs and the levels that could dictate the next move. For WTI, the analyst identifies a micro‑support zone between $96.11 and $96.12. As long as...

GLD Trade Update: Fixing Downside Risk Fast
In this brief update, the trader reviews a GLD iron condor position that was initially structured with a skewed payoff—limited upside loss but significant downside exposure. Gold has rebounded to around $400, lifting the trade about 12% in value. To tighten...

Full Trade Breakdown: How This Setup Made 7R (Uncut)
Navin Prithyani’s new video offers an uncut, real‑time walkthrough of a single price‑action setup that generated a 7R (approximately eight‑times the risk) profit. The trade is displayed on TradingView with live chart annotations, revealing his entry, stop‑loss placement, and position‑scaling...