

Hiring Associate to Scale Advisor Relationships After $1B Growth
We're hiring. 3 years: $0 → $1bn+ AUM. 7 ETFs. A category we're taking mainstream. Now we need someone to help scale the advisor relationships that got us here. Associate, Advisor Solutions — internal sales, clear path to external. Remote. If you've got distribution experience, know ETFs or alts, and want to sell something you actually have to understand — link below.

Portable Alpha Gains Momentum Amid Liquidity Challenges
State of the Portable Alpha Landscape I sit down with Shane McCarthy of LAB Quantitative Strategies for a deep dive into the portable alpha and return stacking landscape, including fresh survey data on how allocators are approaching this space today. 00:00 Welcome...

Big‑Bank Collars Neutralize Retail Bets on S&P
Don't even ask the question. The answer is yes, it's within the collar. Think the S&P is going to rip to new all-time highs? Sorry, there's a short call at 7155 capping your upside. The hedge fund already sold it....

AQR Launches Delphi Fusion: Stacked Global Equity UCITS
People often ask when we're going to bring Return Stacked® funds to Europe. Unfortunately, no time soon. But others are starting to bring interesting product to that market. AQR just launched the Delphi Fusion Global UCITS Fund — global equities stacked with their...

Diversification Cost Driven by Funding, Not Strategy
"If You Can't Beat 'It, Stack 'It" Quantica's latest on why the cost of diversification depends on how you fund it, not the diversifier itself. Worth your time. https://t.co/w7oKWKy3Ot

Dune III Trailer Feels Like Star Wars Ripoff, No Lawsuit
just watched the dune: part three trailer. really crazy to me that george lucas doesn't sue for how much this series rips off star wars.

Team Secures Exclusive License for S&P 500 Perpetual Product
Alright, y'all, looks like I'm eating crow on this one. This post from @bxunit very much says it is truly exclusive. "While this is the first product of its kind, it is also the only official S&P 500 perp product, meaning trade[XYZ]...

Explore Historical Return Stacking with Our New Tool
We get lots of questions around what return stacking looks like. So, we built a simple tool to explore how different stack sizes and blends, when layered on different stock/bond bases, behaved historically. (Link below.) https://t.co/ogWicOHDD6

Implement Revenue‑Based Weekly LIT Buybacks with Transparent Reporting
As I follow-up to this tweet, I had a call with the Lighter team with one very clear recommendation: Until regulations allow a DAO structure that treats $LIT as equity, you have to define a percentage of revenue that systematically goes...

Higher‑Vol Strategies Shift Burden, Damage Manager Track Record
A lot of people ask me for higher volatility alternatives for "capital efficiency" reasons. And on it's face, it makes sense. Instead of putting $100 in a 10% vol strategy, you can just put $25 in a 40% vol strategy. But there are...
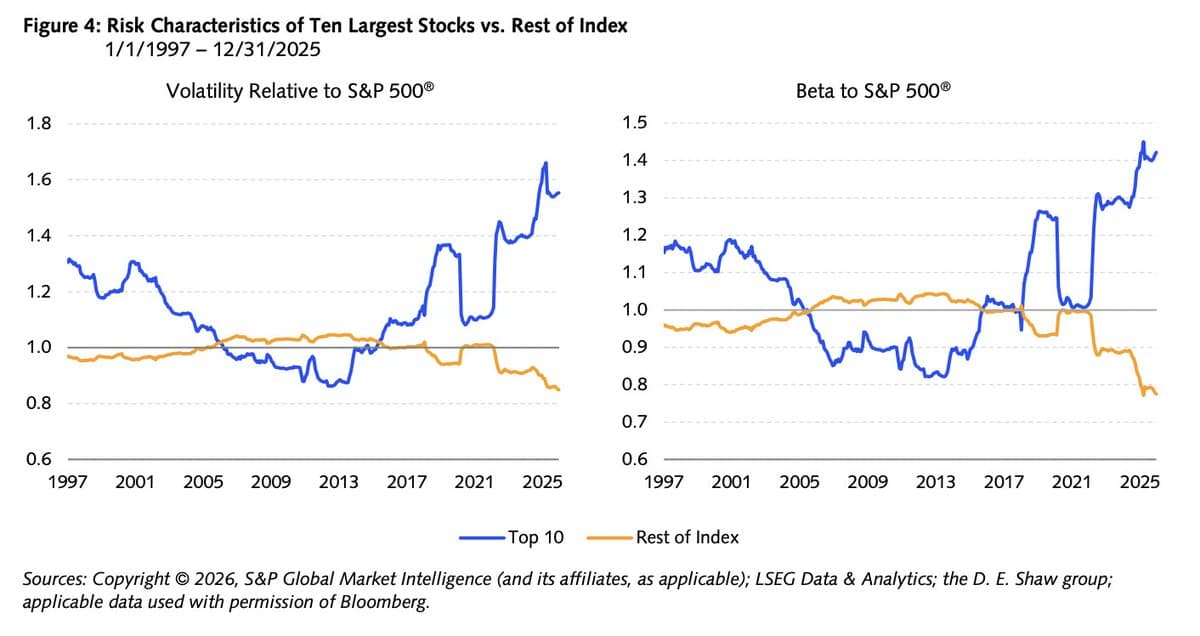
Big‑Cap S&P Leaders 50% More Volatile Than Index
The top 10 largest stocks in the S&P 500 are 50% more volatile than the S&P 500 itself right now. Important for risk... but more important for alpha right now. https://t.co/yqBR2QU8nK
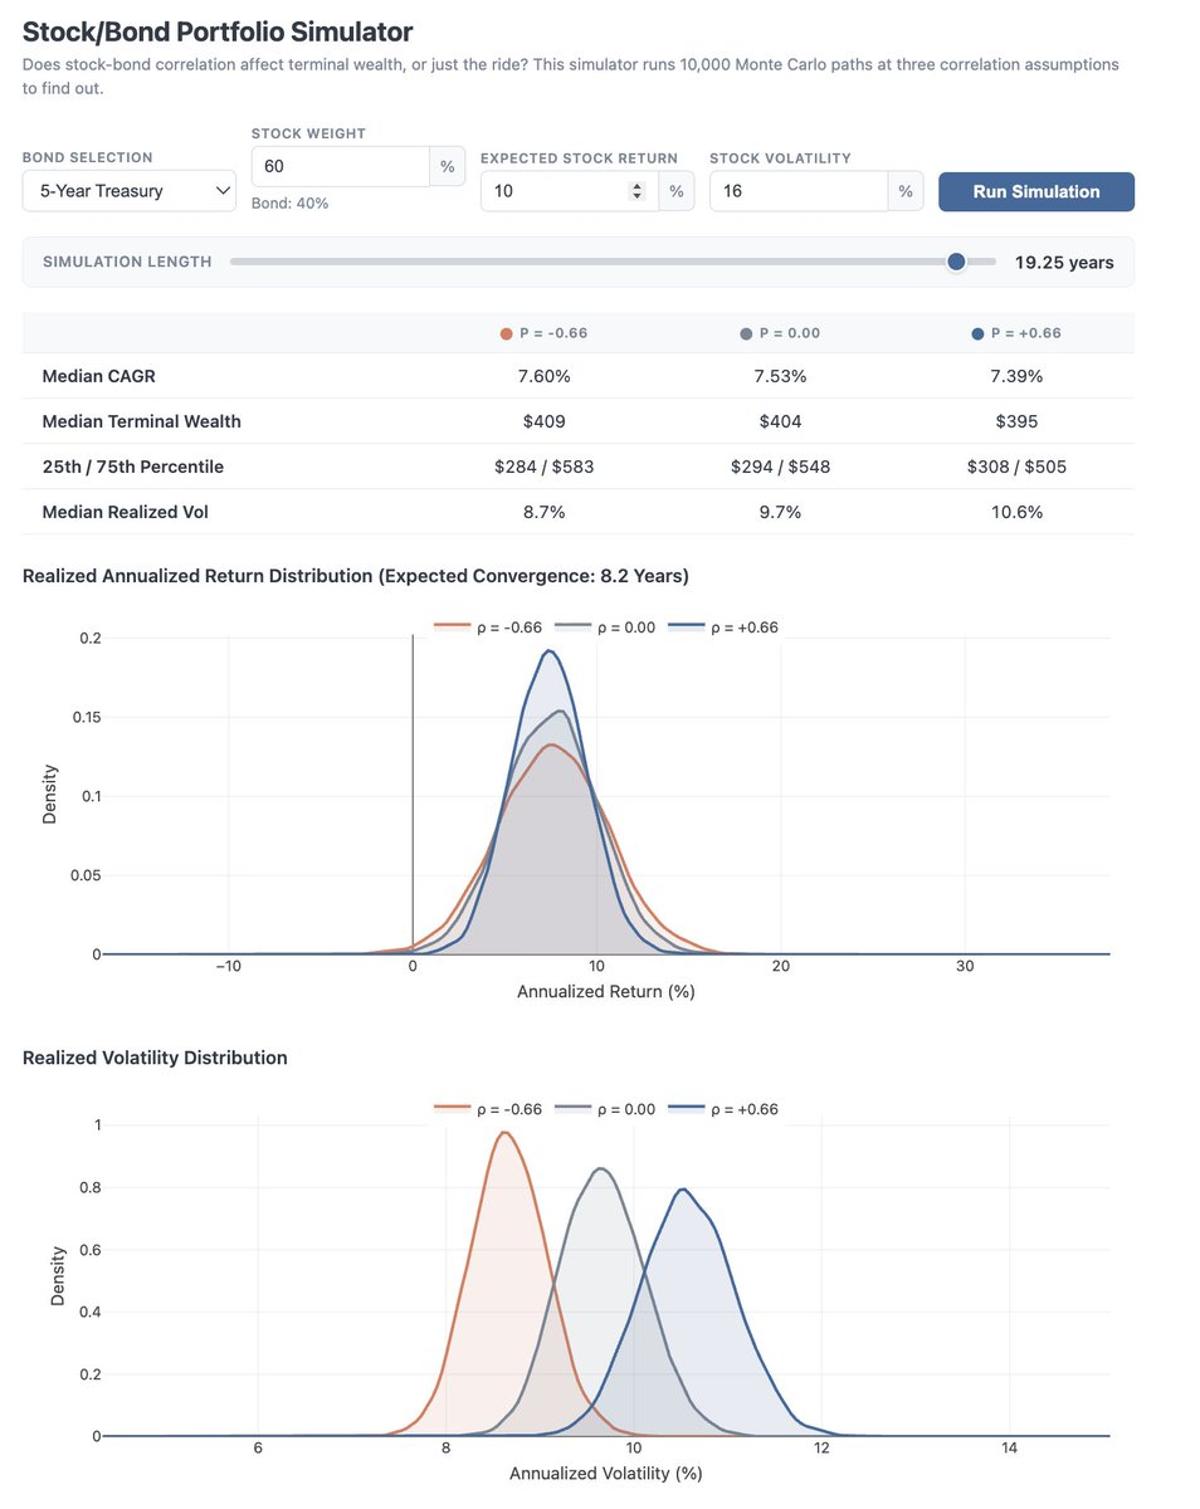
Annual Returns Converge Across Correlations, Volatility Varies
I vibe coded a widget to show the idea of the blog post below. It simulates yield curve evolutions and equity market returns. Then it plots the distribution of annualized returns and volatilities over a given horizon using...