
Karina | Python | Excel | Stats | DataScience | DataAnalytics
Data analytics/science educator; active, high‑engagement posts on pandas/Python and big‑data‑adjacent workflows for analytics.
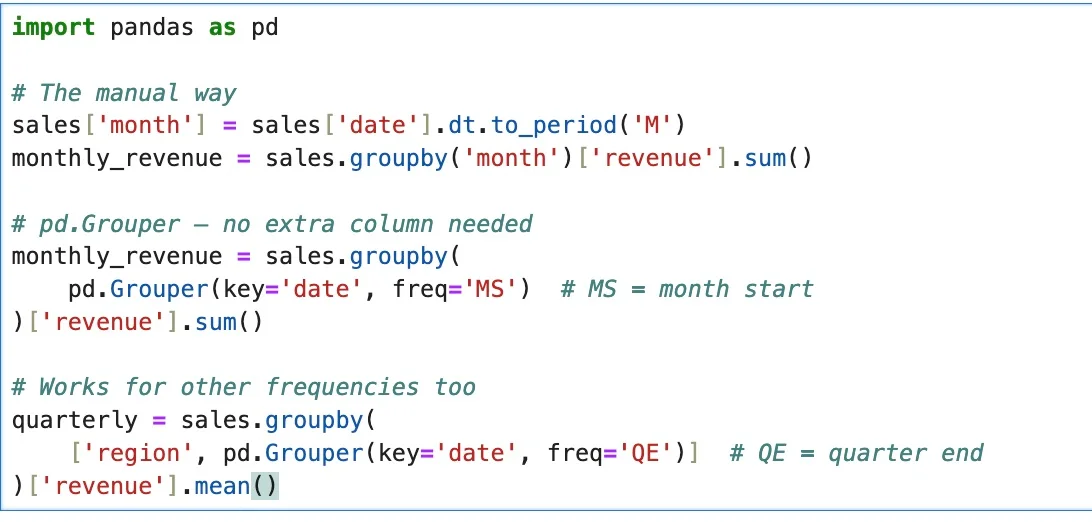
Group by Time with pd.Grouper—no Extra Columns
Python tip You've been creating extra columns just to group by month. pd.Grouper does it in one step, inside the groupby. Same result. No extra column. It works for any time frequency -- weekly, quarterly, custom intervals -- without touching your data.
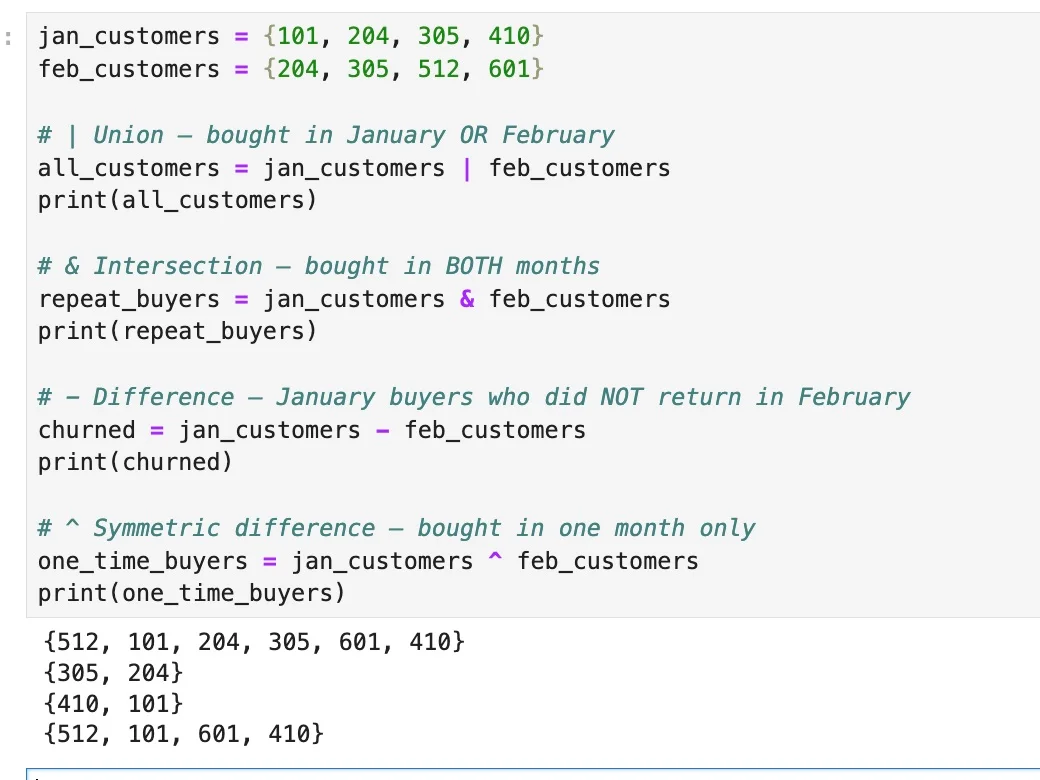
Use Python Set Operators to Compare Lists Instantly
Python set operators analysts actually use You already know sets remove duplicates. But they also do something more useful. Compare lists without a single loop. | union -- combine two lists, no duplicates. i.e. all customers who bought in January OR February & intersection...

Segment Customers with RFM‑Based K‑Means Clustering
Let's build a mini data science project. Customer segmentation using K-Means clustering. What are we building? We're grouping customers by behaviour using RFM: Recency — days since last purchase Frequency — total orders placed Monetary — total spend Three numbers per customer. That's...

Claude Skills: Reusable Prompts Boost AI Efficiency
I've been using Claude Skills and they're genuinely useful once you understand what they are. Think of them as reusable instructions Claude reads before doing a task. Anthropic has an official repo and there's a solid community list too. 🔗 github.com/anthropics/skills 🔗 github.com/travisvn/awesome-claude-skills
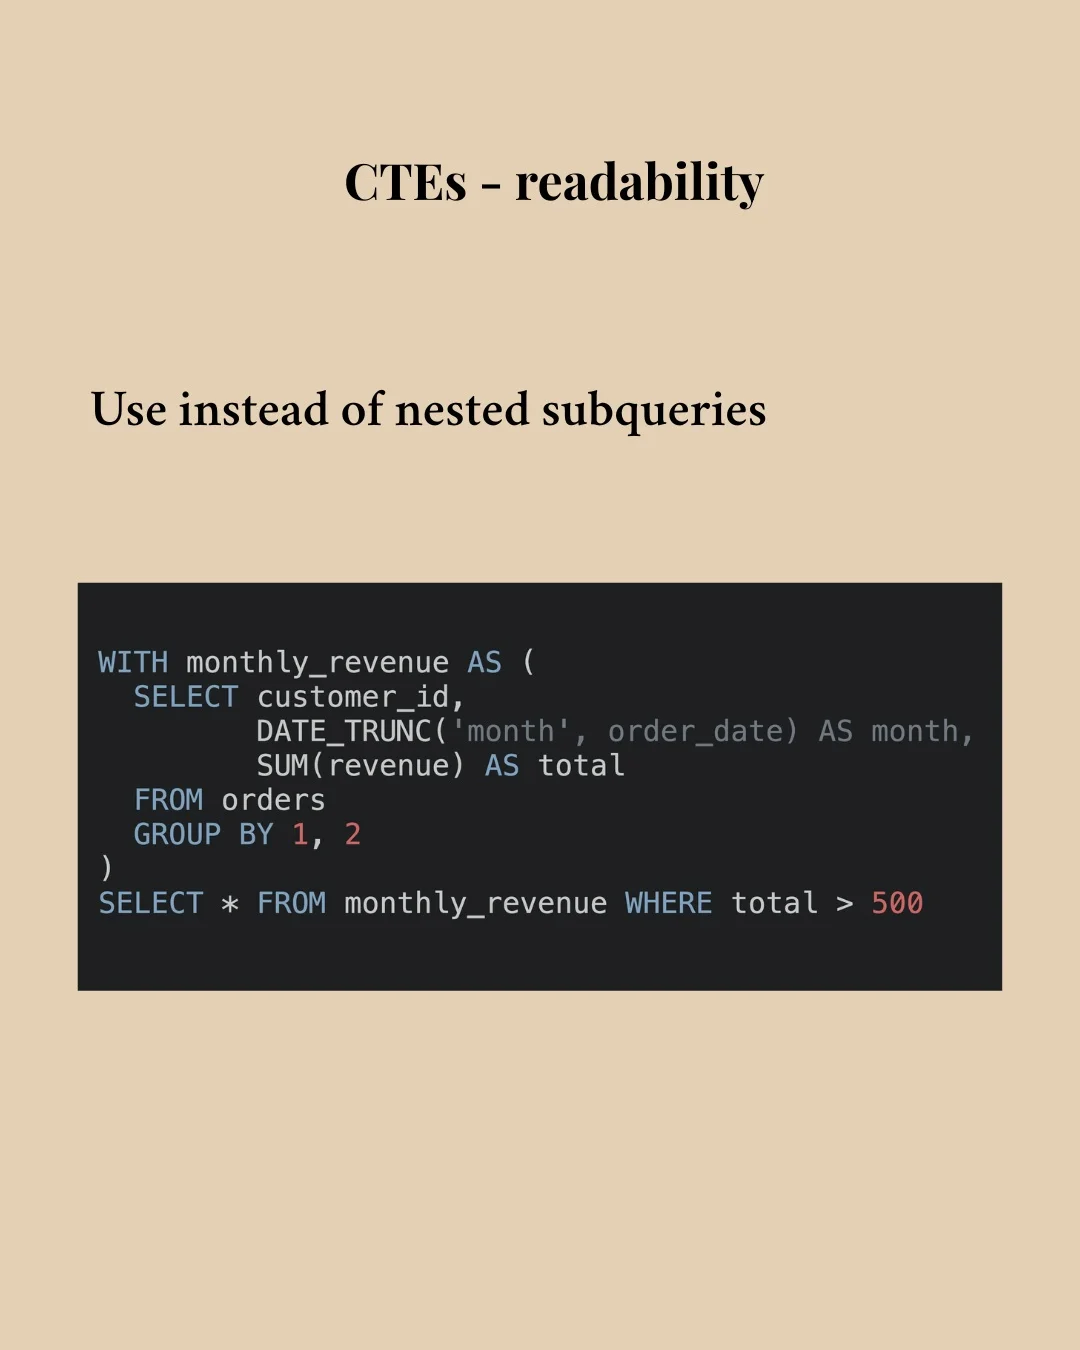
CTEs Turn Complex SQL Into Readable, Maintainable Code
SELECT, FROM, WHERE and JOINs will get you started. Then the work gets complicated and you realise tutorial SQL and production SQL are two very different things. Here's level 2 CTEs — readability I was lost in my own nested subqueries. Couldn't follow...

Pixel Agents Turns Claude Code Into Tiny Office Simulator
Someone turned Claude Code into a pixel office simulator. And it’s oddly satisfying. A VS Code extension called Pixel Agents creates a tiny pixel office where every Claude terminal becomes an animated agent. You can design the office layout and watch multiple AI...
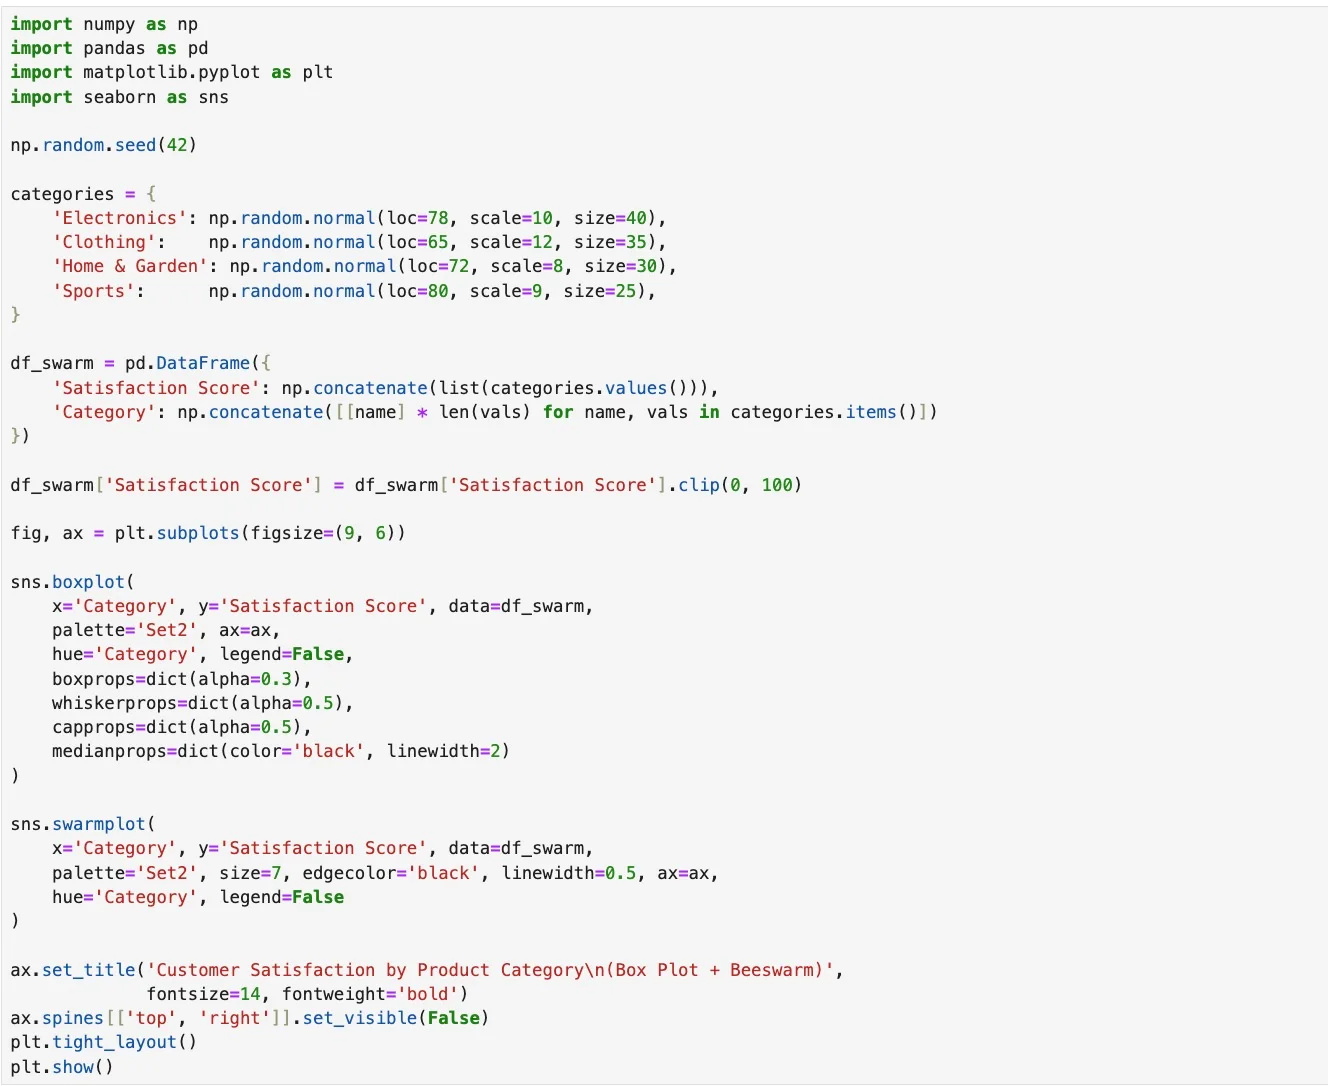
Beeswarm Plots Reveal Hidden Data Clusters Beyond Box Plots
Part 3 of 3 underused chart types worth knowing. A box plot with 15 points looks identical to one with 1,500. You lose all sense of where measurements actually cluster. Beeswarm plots fix this. Every data point is visible. Nothing gets absorbed into...
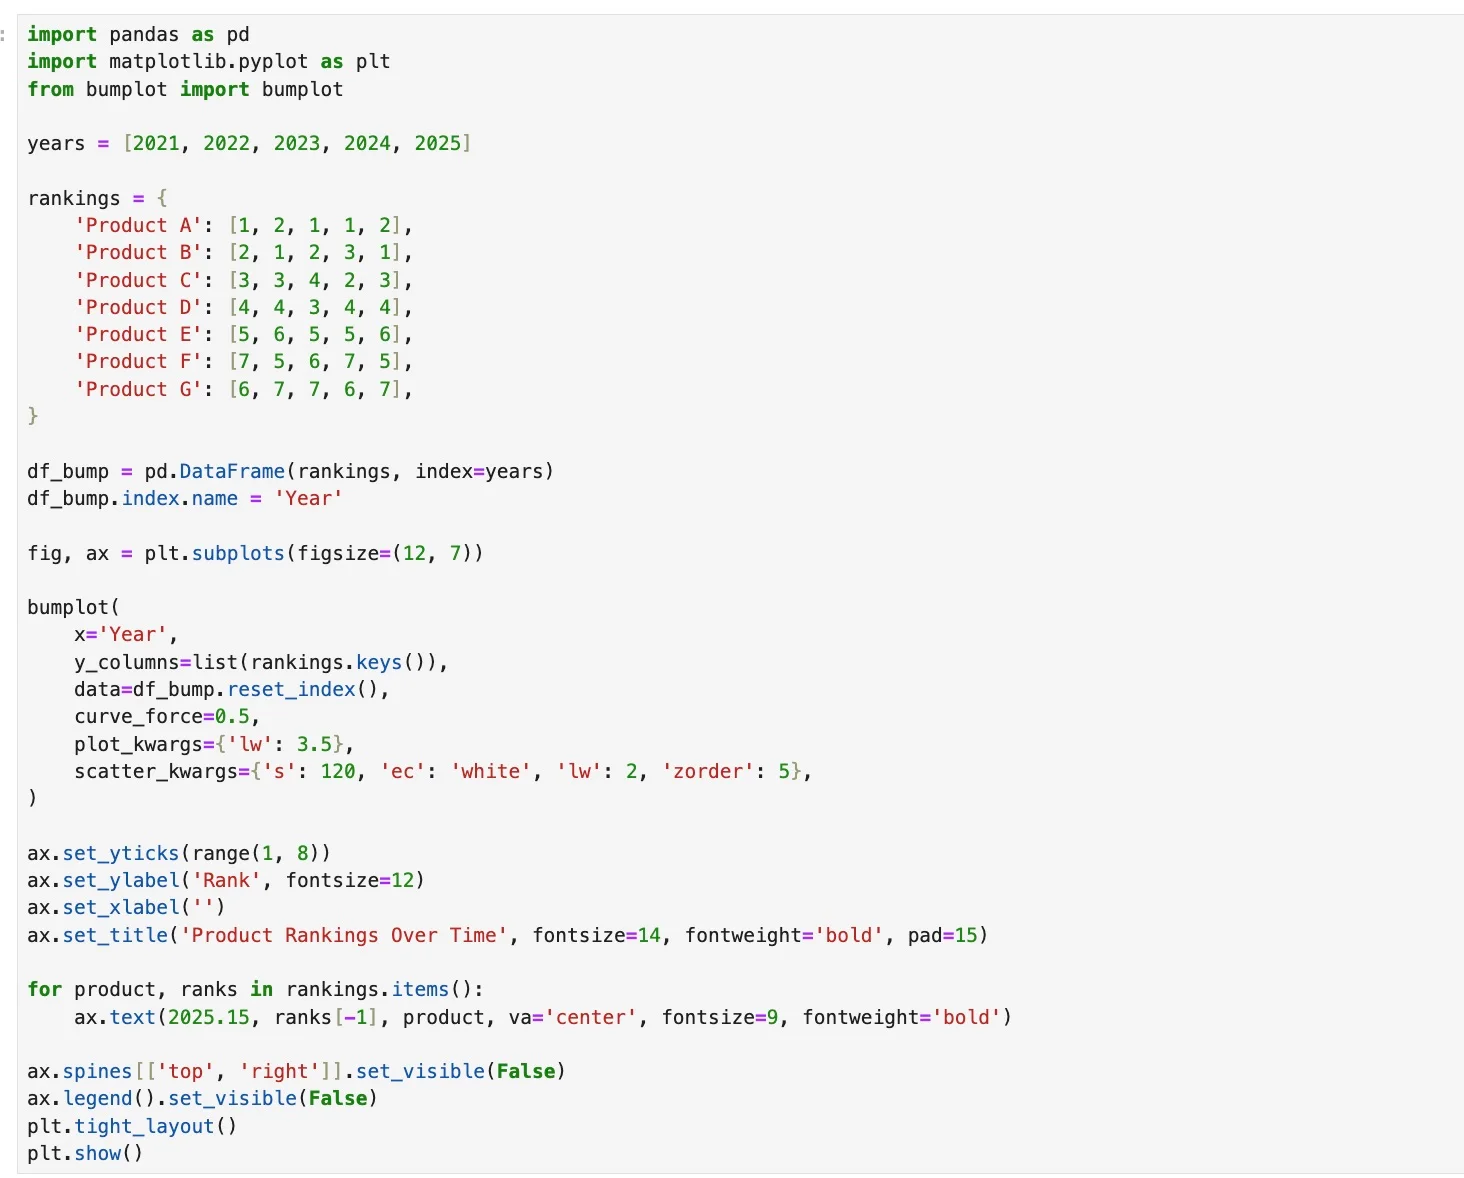
Bump Charts Simplify Ranking Changes over Time
Part 1 of 3 underused chart types worth knowing You reach for a line plot to show ranking changes over time. The lines cross. It turns into spaghetti. Bump charts fix this. When you care about relative position — not raw values —...
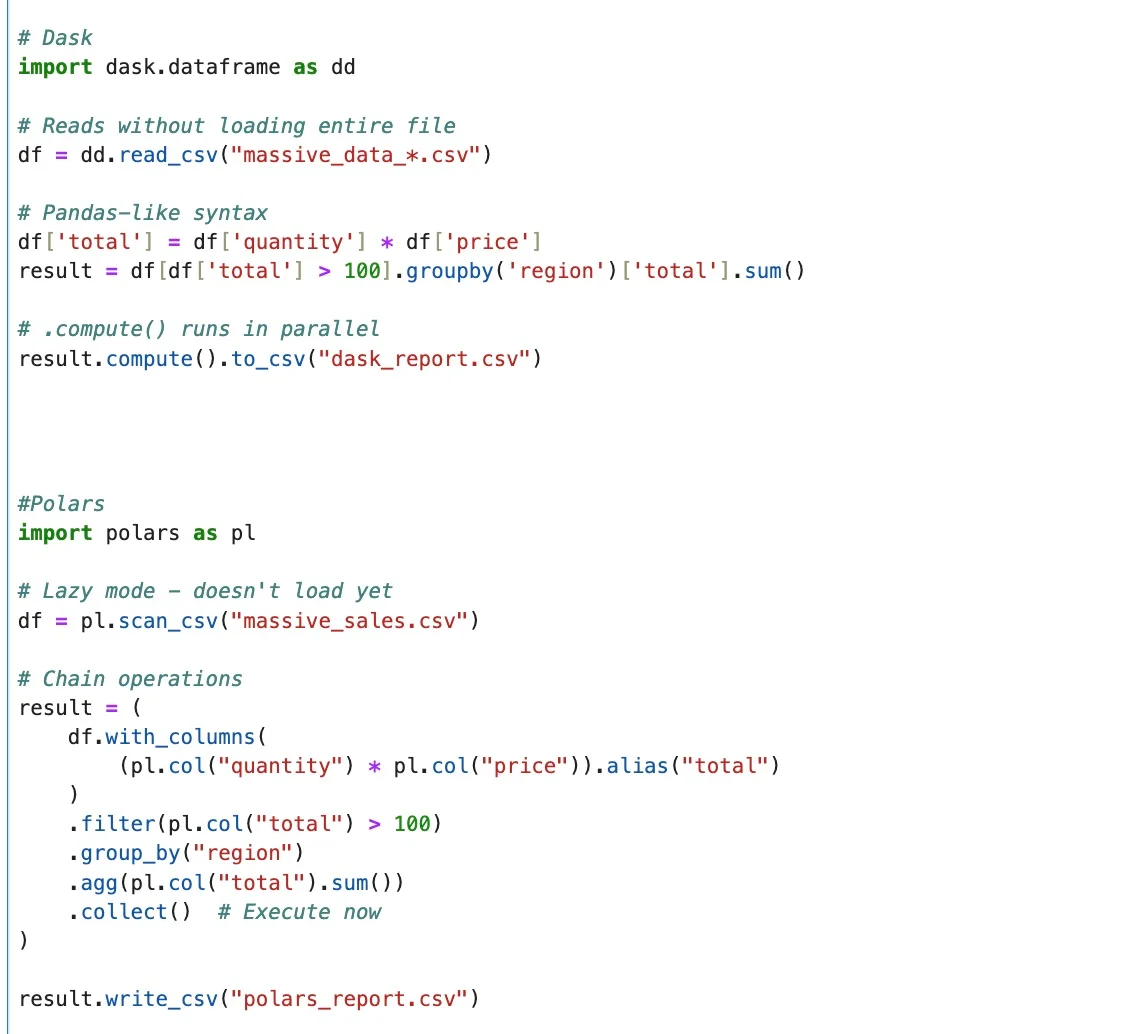
Boost Pandas Performance with Modin, Dask, Polars
Python Tip When pandas is too slow, there are other libraries to rescue: - Modin - Easiest switch from pandas Change one line: import modin.pandas as pd Same syntax. Uses all CPU cores - Dask - When data > RAM Processes data in chunks across CPU...
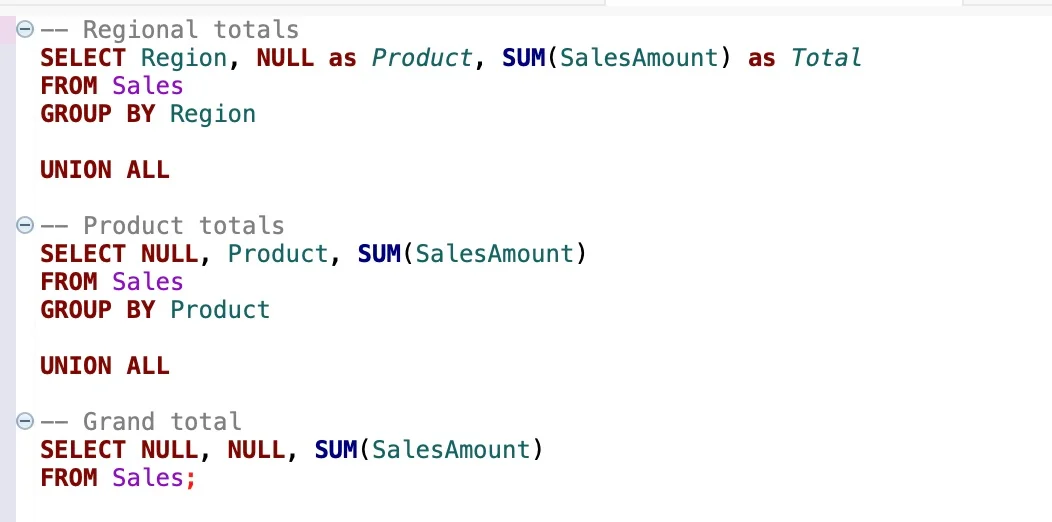
Replace UNION ALL with GROUPING SETS for Faster Aggregations
Stop Writing UNION ALL for Multi-Level Aggregations You need regional totals AND product totals AND grand totals. So you write three separate queries with UNION ALL. There's a better way: GROUPING SETS. UNION ALL - Scans the table 3 times. Slow. GROUPING SETS - One...

Query CSVs Directly with DuckDB—No Load, Faster
Instead of loading CSVs into pandas just to run one query, you can use DuckDB to run SQL directly on files. No loading. No waiting. Just query the file and get results. It’s also 20x faster and uses way less memory. Here’s how...
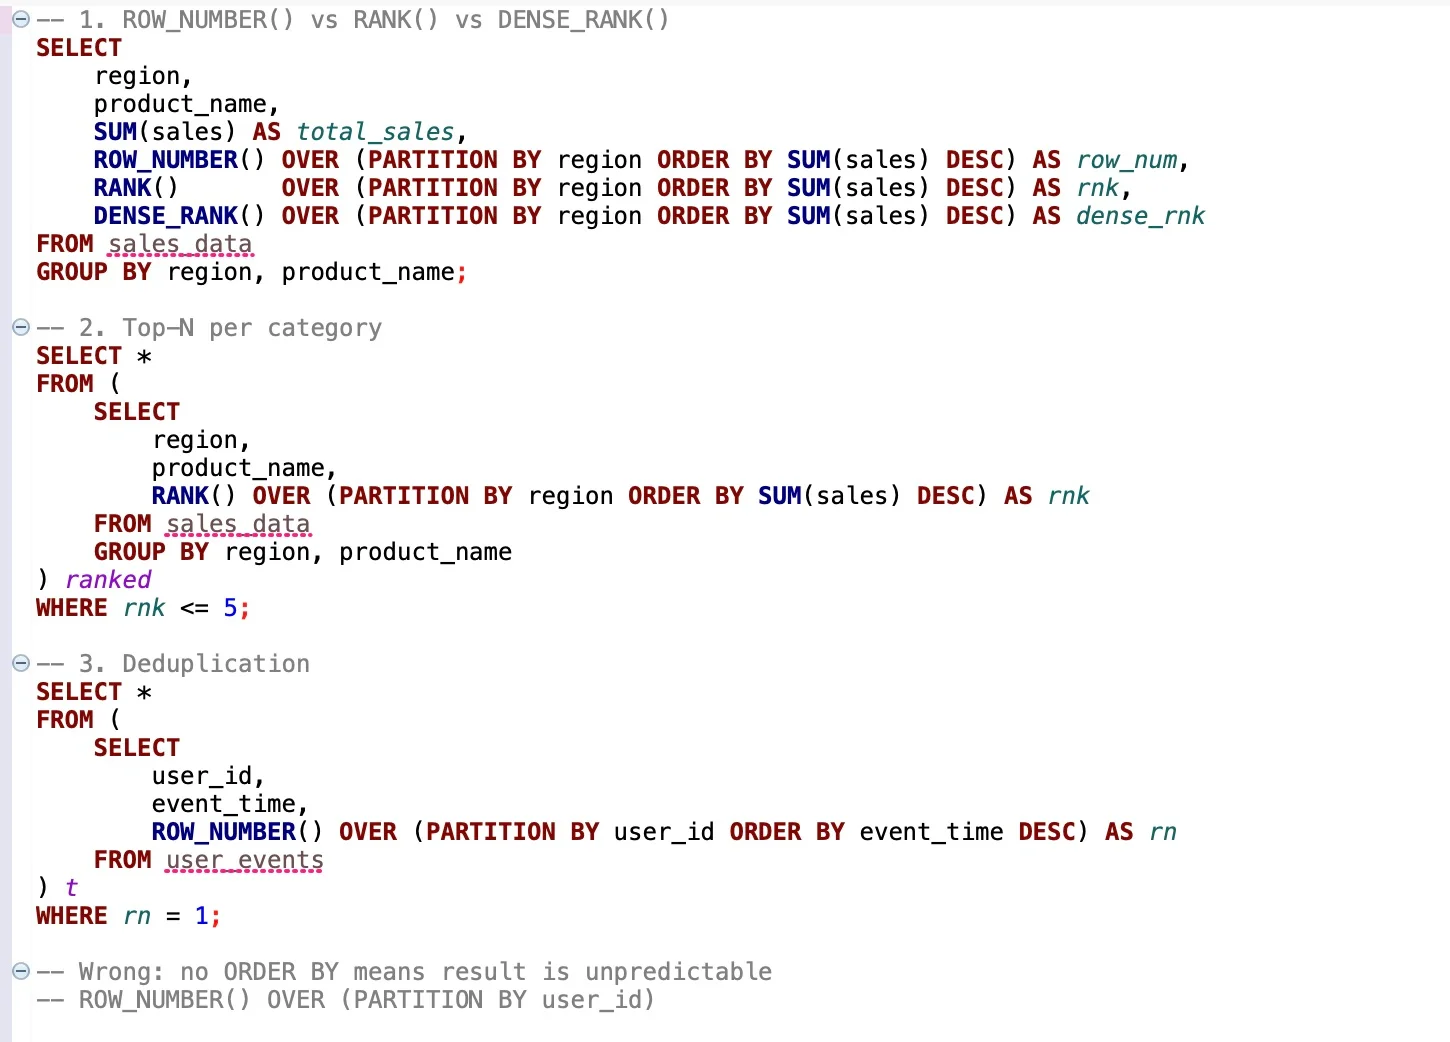
Choose the Right SQL Ranking Function to Avoid Misleading Gaps
ROW_NUMBER(), RANK(), DENSE_RANK(). Three functions, three different behaviors. Pick the wrong one and your rankings mislead. Here are 4 patterns to get it right: - ranking with gaps vs without - top-N per category - deduplication - running totals 1. ROW_NUMBER() vs RANK() vs DENSE_RANK() Three functions, three behaviors...

Analyst Ads Overpromise Python; Excel, SQL Dominate Daily
Unpopular opinion: Data analyst job postings ask for Python. Data analyst jobs don't actually use Python. What you'll use daily: Excel — every single day SQL — every single day Power BI or Tableau — multiple times per week Python — maybe once a month This pattern holds...
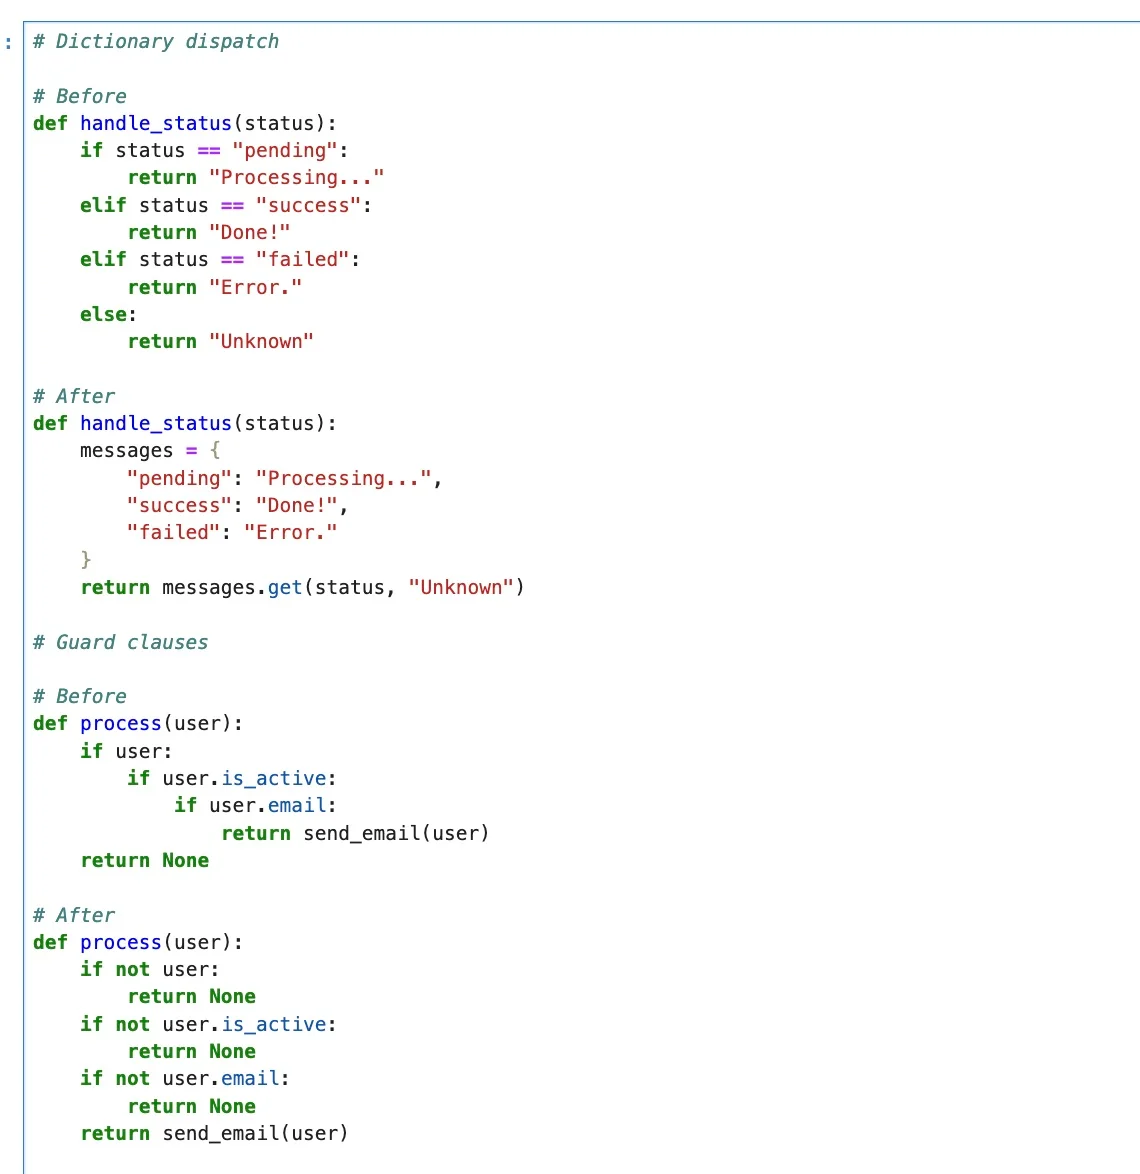
Replace If‑elif Chains with Clean Python Dispatch Patterns
The more if-elif chains you write, the harder your code gets to change. Python has cleaner patterns for this. Here are 4 worth knowing: - dictionary dispatch - guard clauses - match/case - conditional expressions 1. Dictionary dispatch. Replace long equality checks with a dict. Constant-time lookup. No branching....

Free Resources Replace Costly Bootcamps—Discipline Is Key
You don't need a bootcamp to become a data analyst. Everything you need is free: Excel/SQL/Python/Power BI tutorials — YouTube SQL practice — SQLZoo, LeetCode, HackerRank Datasets for portfolio projects — Kaggle, data.gov, Google Dataset Search Resume feedback — Reddit (r/datascience, r/resumes), LinkedIn communities Interview prep...

Master Six Core Concepts to Decode Regression Results
Most analysts can run a regression. Very few can explain what the output actually means. That gap is a statistics fundamentals problem. Not a tools problem. Not a Python problem. Not a years-of-experience problem. If you can't explain what your numbers mean, you...
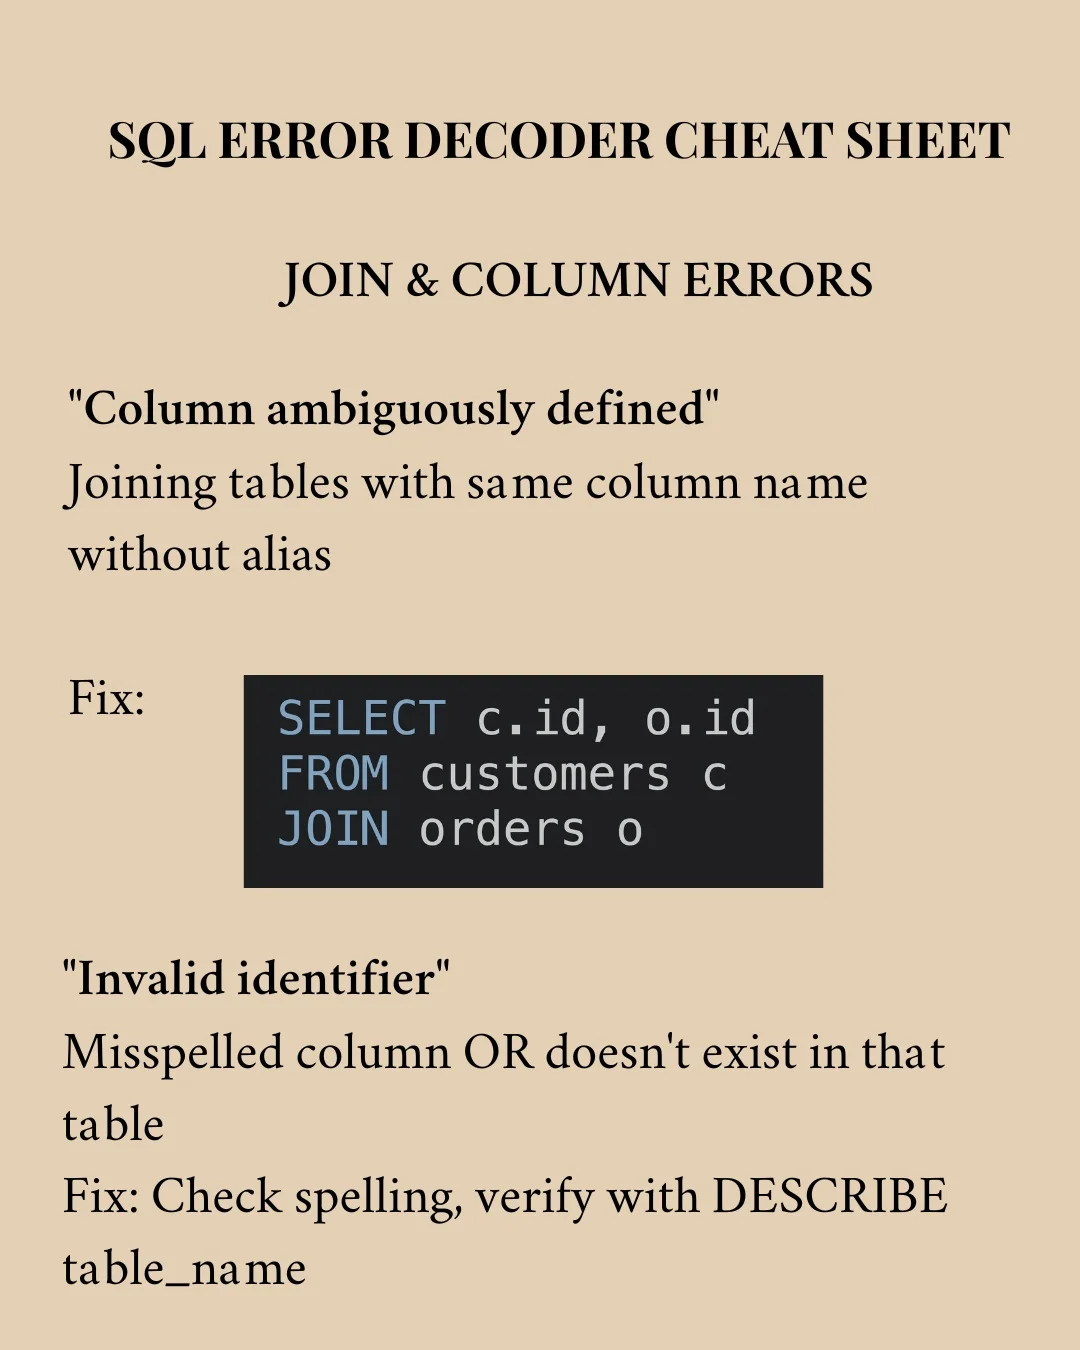
Decode Common SQL Errors and Their Real Fixes
Common SQL errors and what they REALLY mean "Column ambiguously defined" You joined tables with the same column name. Fix: Add table aliases (customers.id not just id) "Not a single-group group function" You mixed aggregated + non-aggregated columns. Fix: Add all non-aggregated columns to GROUP BY "Division...
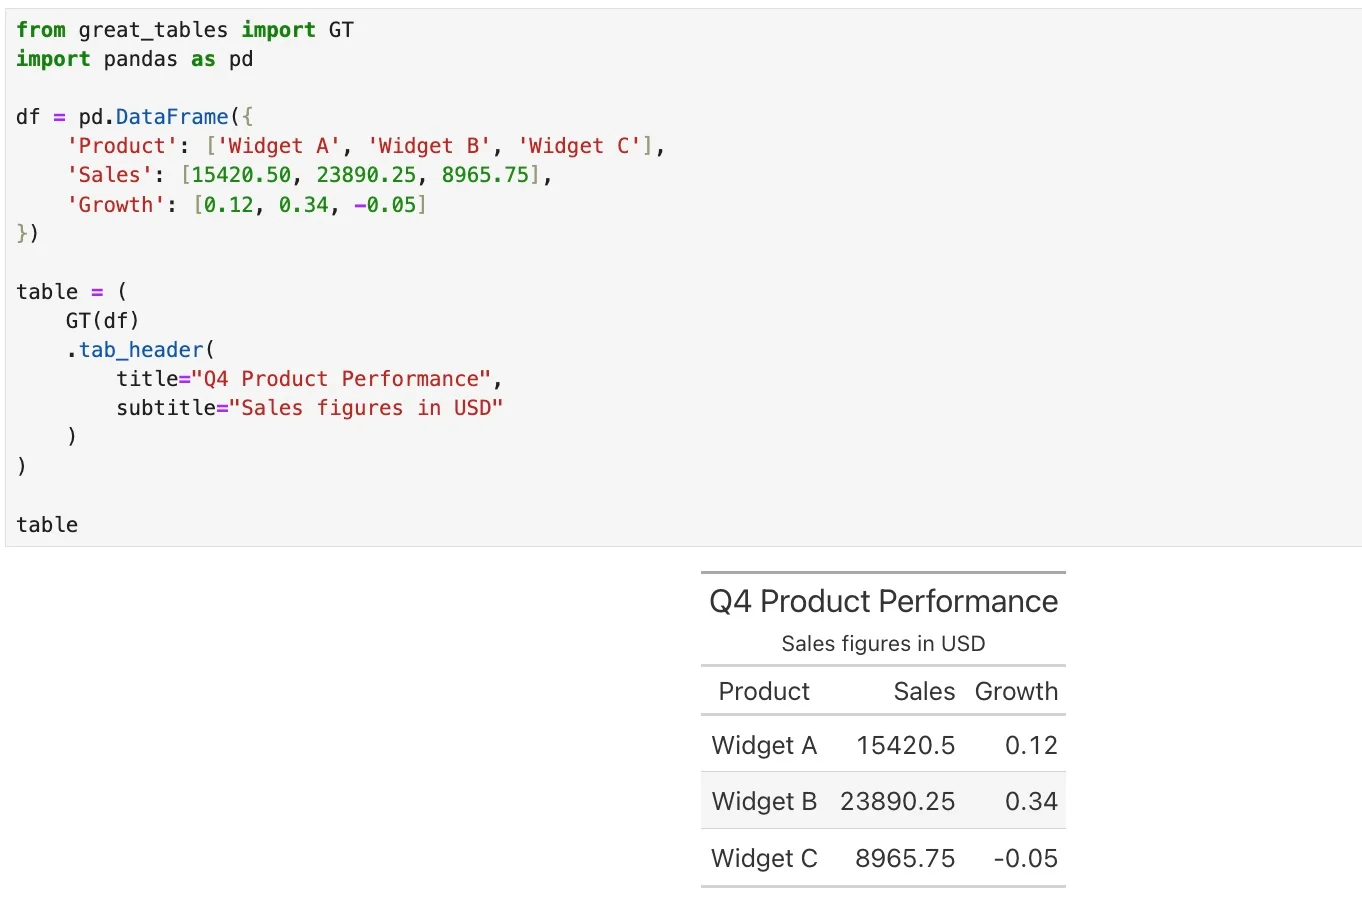
Great Tables Turns DataFrames Into Presentation‑ready Tables
Turning a DataFrame into a presentation-ready table in Python. Recently I tried a library called Great Tables and it makes formatting tables very easy. - Works with Pandas & Polars - 19 formatting methods (currency, percentages, dates, scientific notation) - Export to HTML, LaTeX,...
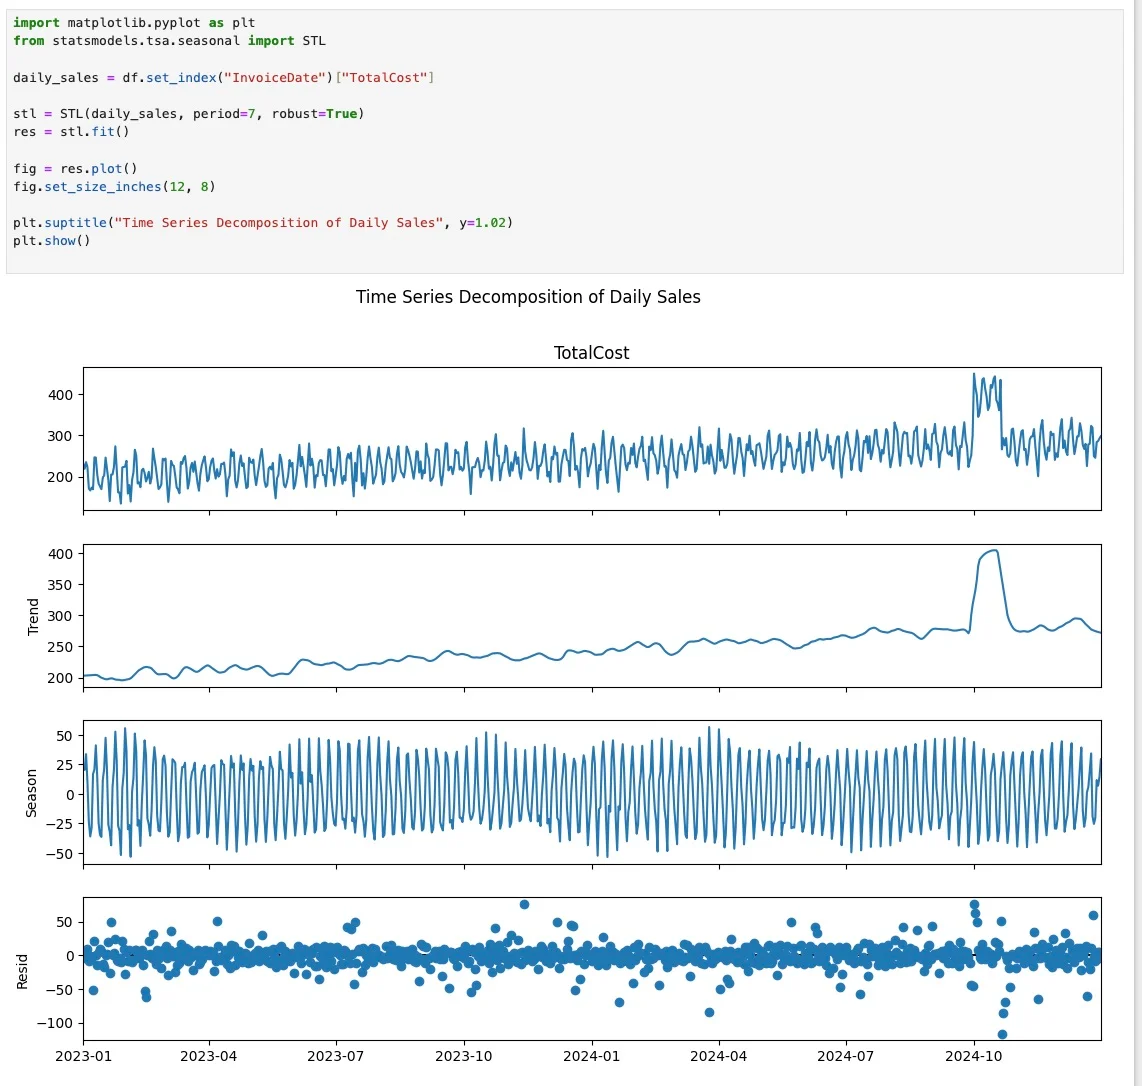
Decompose Sales Data to Distinguish Real Growth
Your manager asks: "Sales jumped in December — is that a real growth or seasonality?" You pull up a line chart. Sure, it shows the spike. But it doesn't tell you why. And that's what they actually want to know. This is where time...
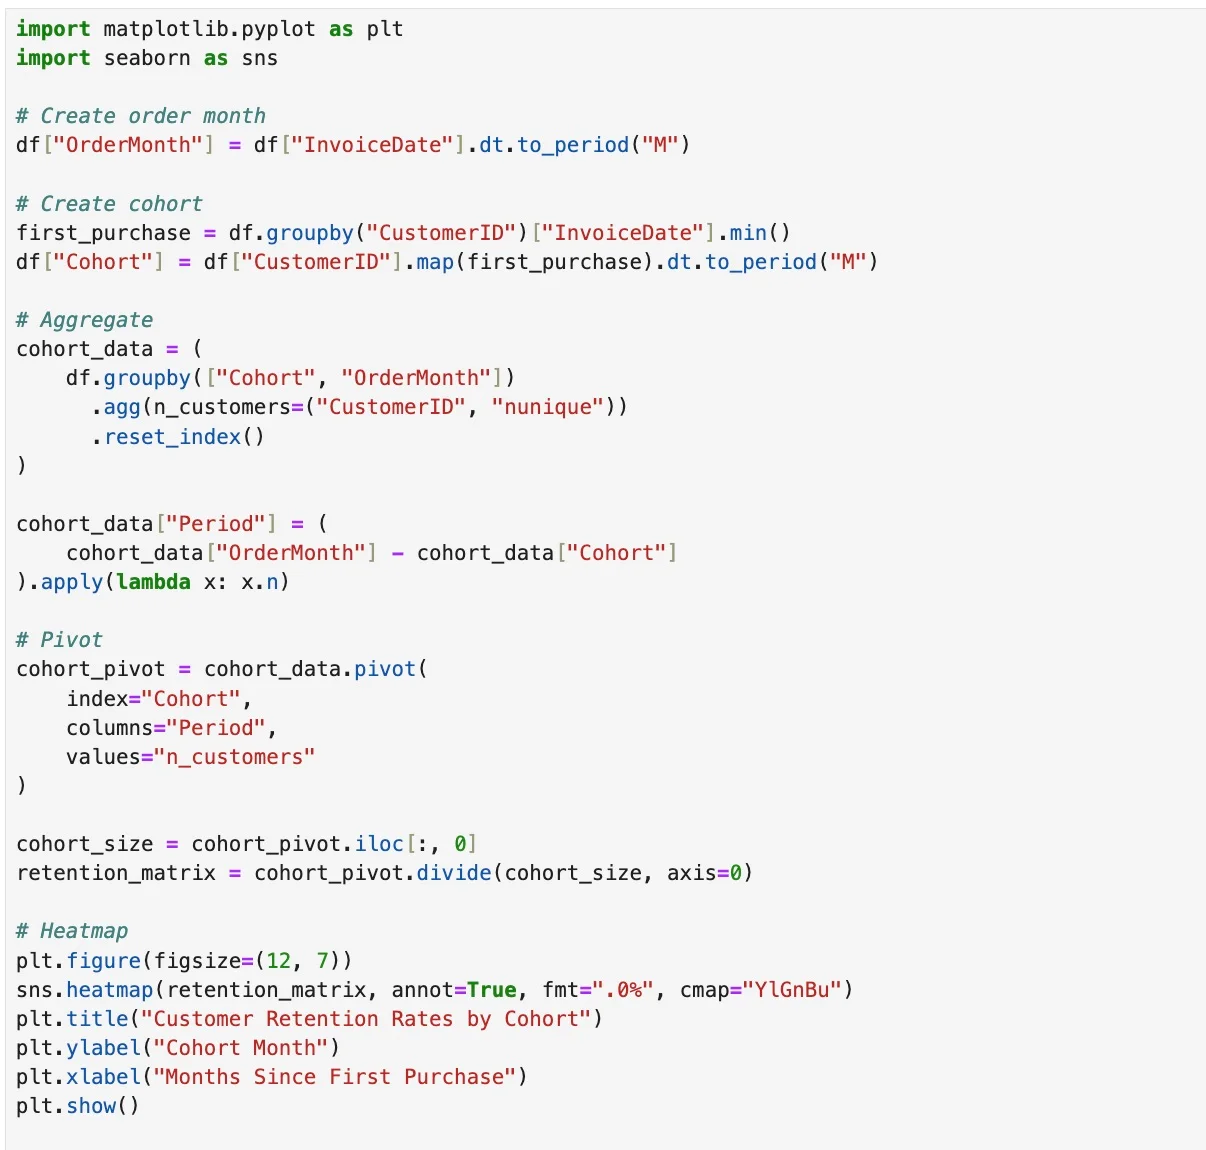
Visualize Churn Timing with Python Cohort Heatmaps
At my work every month we look at customer retention. A single churn rate doesn't tell the whole story. You need to show when customers are leaving. Here's how you can do it with a cohort analysis heatmap in python