
The Habit That Separates 99% of Traders
The speaker argues that trading success is driven more by psychology and disciplined process than by technical tools or indicators. Traders should start with a base system but must discover their own “personal truth” or edge through rigorous recordkeeping, purposeful trades, and metric-driven review of times, price ranges, and symbols. Without documenting and learning from trades, traders will rely on luck and fail to make lasting progress. The talk includes an anecdote about a veteran who wrote down his stop after every trade to maintain discipline.
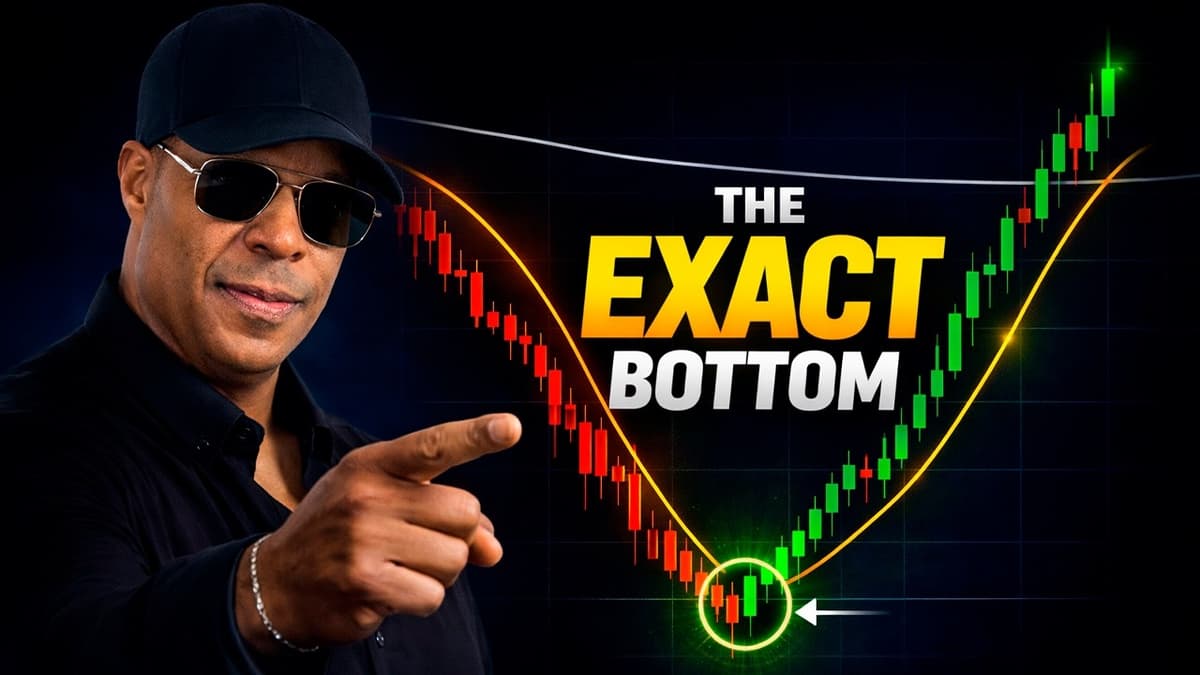
How to Pick Market Bottoms With Precision
A veteran trader outlines a reproducible technique for pinpointing market bottoms—especially the more reliable ‘‘second leg’’ of a V-bottom—using candlestick charts overlaid with a 20-period simple moving average and a 200-period moving average. He demonstrates primarily on a two-minute chart...
You Break Your Own Rules — Then Blame the Market
A trader laments inconsistent adherence to their plan, prompting a lesson that trading success hinges on rigidly following self-imposed rules rather than blaming market action. The speaker contrasts mechanical, platform-driven stops with consciously executed actions, arguing that intentionally keeping your...
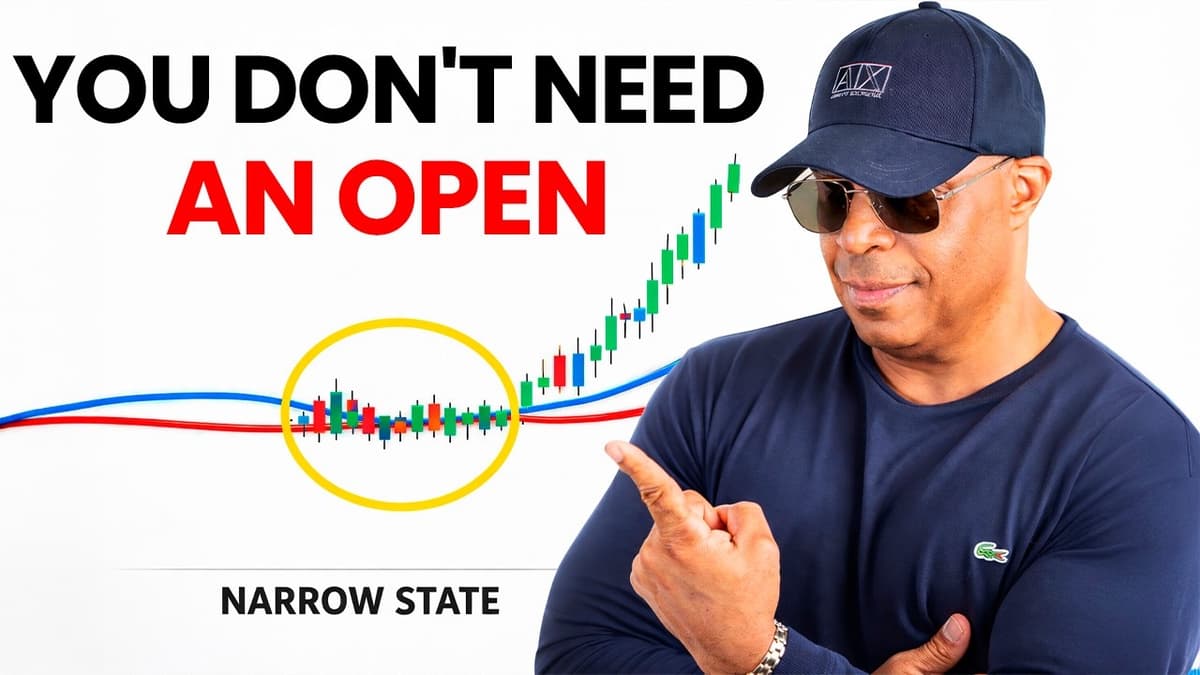
How to Find the “Open” In ANY Market
The speaker argues that every market— including 24-hour futures and forex—has an effective “open” defined by a narrow state where the price, the 20-period moving average and the 200-period moving average converge. Those narrow states, which alternate with wider states,...