
DailyChartBook
Curator sharing momentum/TA insights and JC Parets commentary with tactical regime notes and levels.
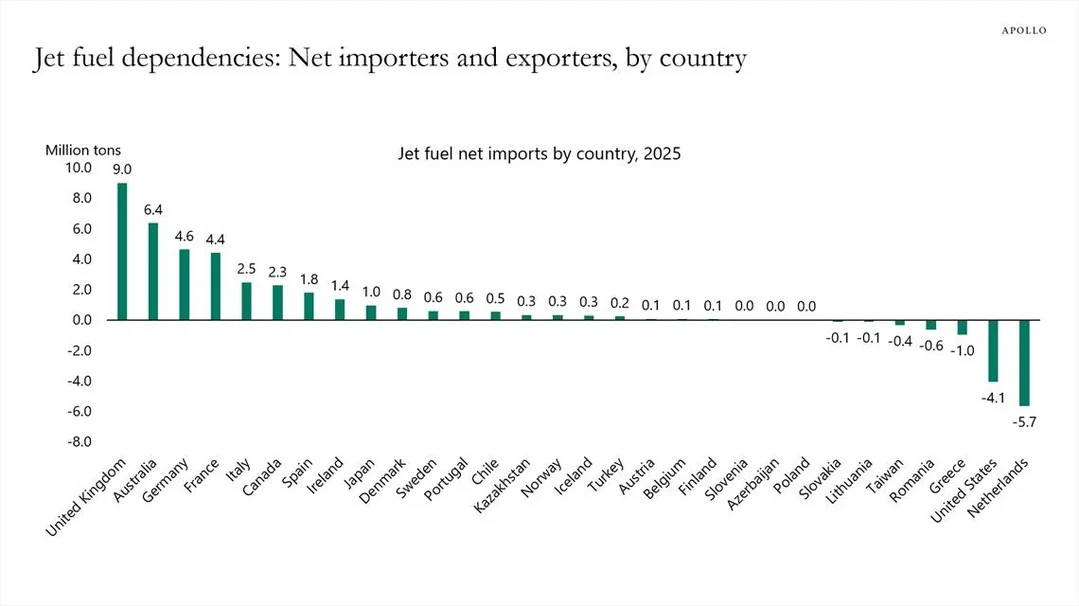
UK, Australia, Germany, France Face Jet Fuel Price Risks
"The UK, Australia, Germany and France are more vulnerable to higher jet fuel prices" -Apollo Slok
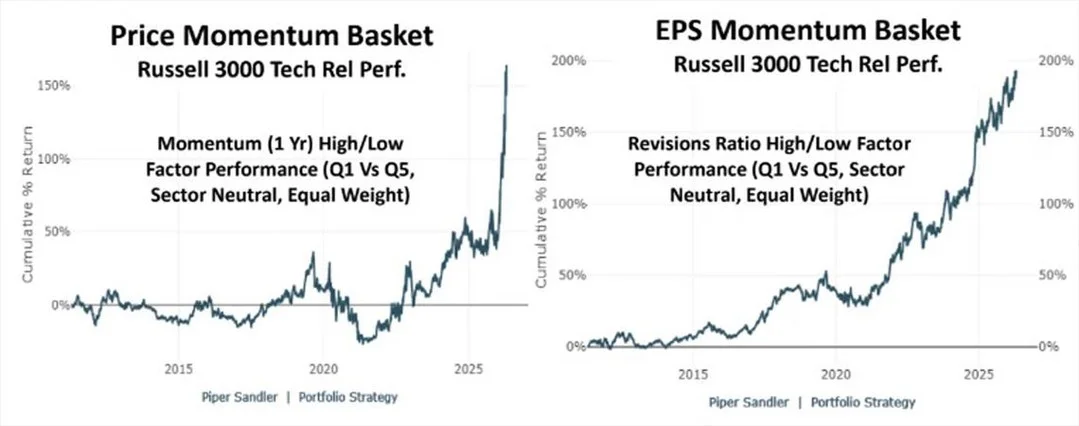
Earnings‑driven Stocks Outperform with Lower Volatility
"Stocks where earnings are doing the heavy lifting have performed far better over time, with less volatility and smaller drawdowns. Price mo, driven by EPS mo, is the best mo" -Michael Kantro, Piper Sandler
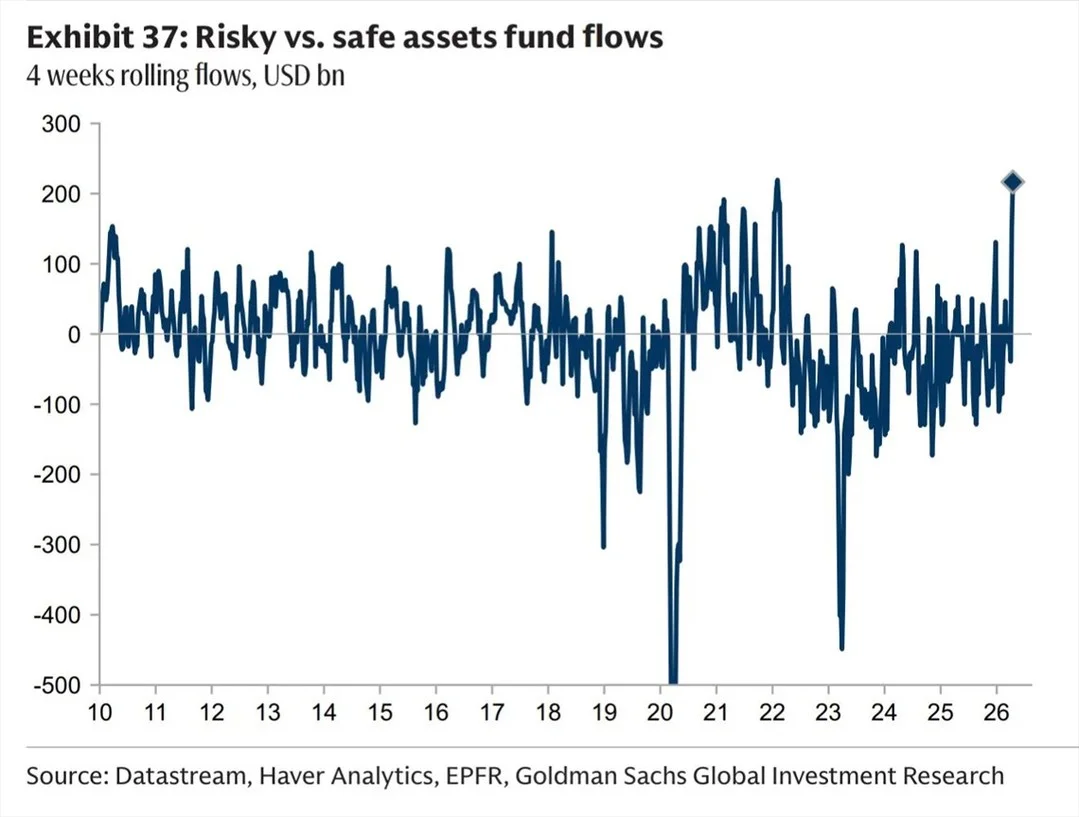
Risky Asset Inflows Outpace Safe Funds in Four Weeks
Over the past 4 weeks, flows into risky asset funds have overwhelmed those into safe asset funds. Goldman Sachs via WallStJesus

Higher Inflation Dampens S&P 500, IG, HY Returns
"Periods of higher inflation are associated with weaker returns in the S&P 500 and the IG and HY indexes, consistent with a policy backdrop of elevated interest rates that restrain risk-taking" -Apollo Slok
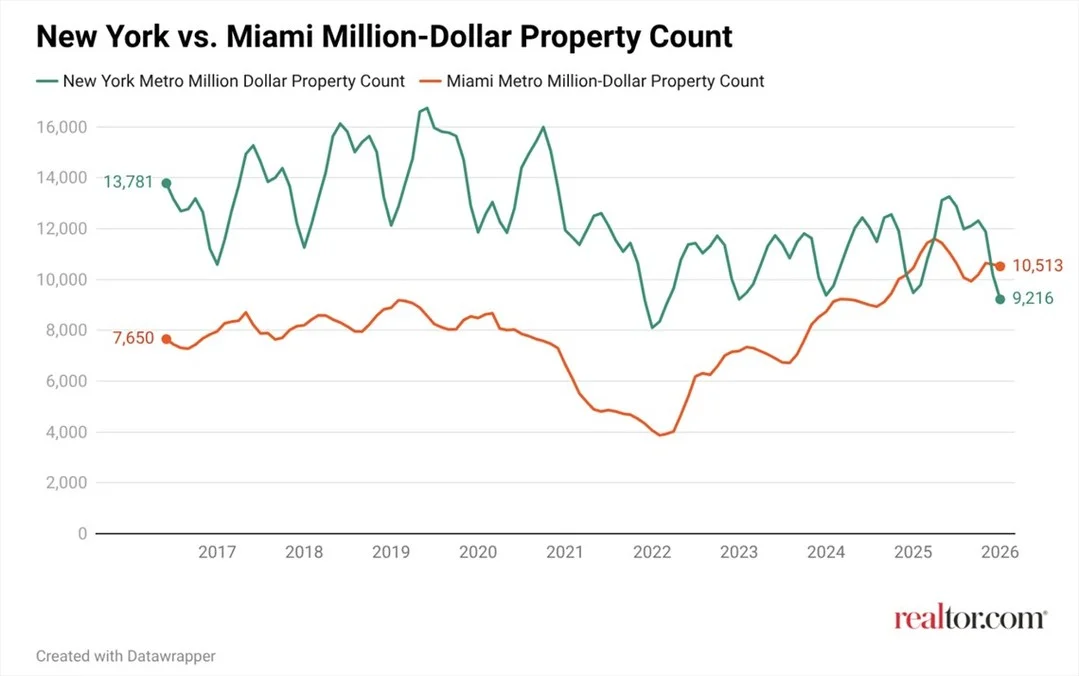
Miami Overtakes New York as Top Million‑Dollar Home Market
For the better part of a decade, New York consistently held the nation’s largest inventory of million-dollar homes. However, in a major geographic realignment, the Miami metro officially surpassed New York by the end of 2025" -NAHB
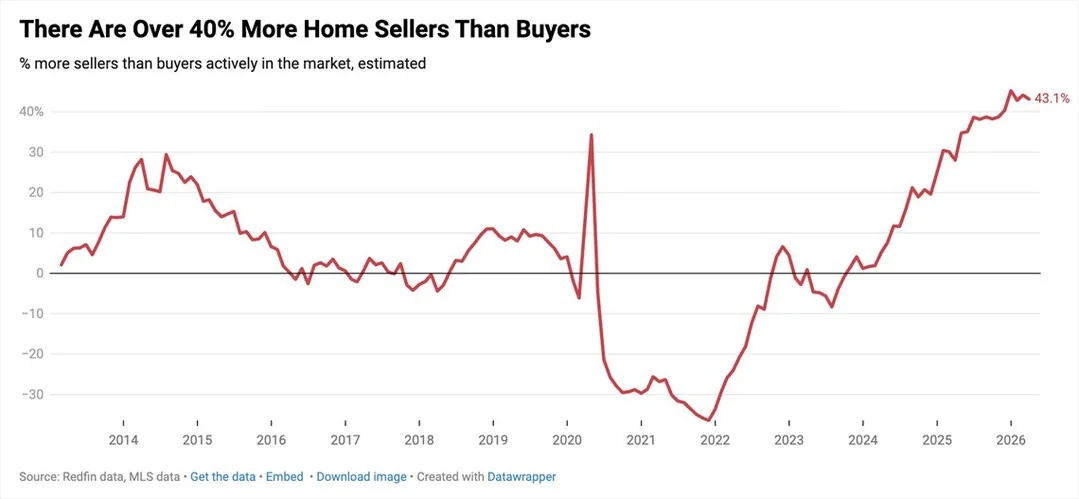
Sellers Outpace Buyers by 43%, Largest Gap Since 2013
"Nationally, sellers outnumber buyers by 43%—just shy of the largest gap in records dating back to 2013" -Redfin
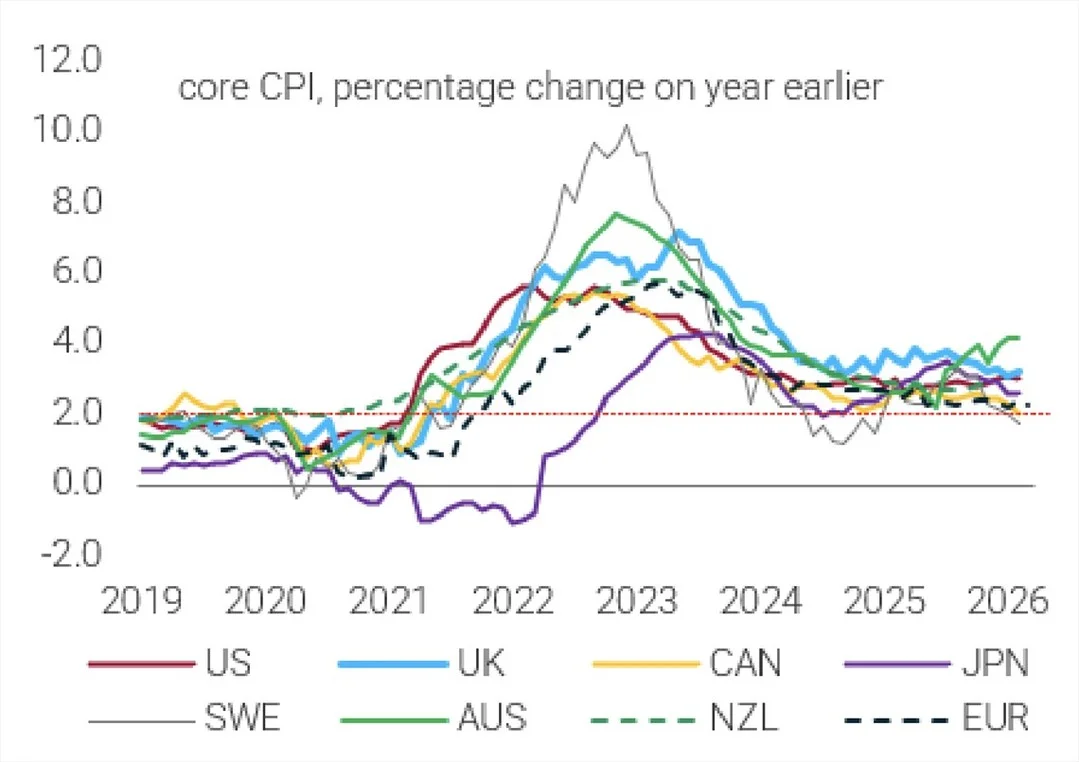
Central Banks Ignore Markets, Overshoot Inflation Targets for Years
"Even if markets can look through the impact of the shock, maybe central banks won’t. They have a nasty habit of believing their own hype, and as inflation moves higher ... They have already overshot their targets for 5 years,...
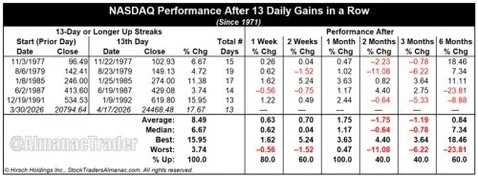
NASDAQ's 13-Day Streak Ends, Still Bullish Outlook
"Although NASDAQ’s daily winning streak has come to an end at 13, its outlook for the next month remains positive." -Jeff Hirsch
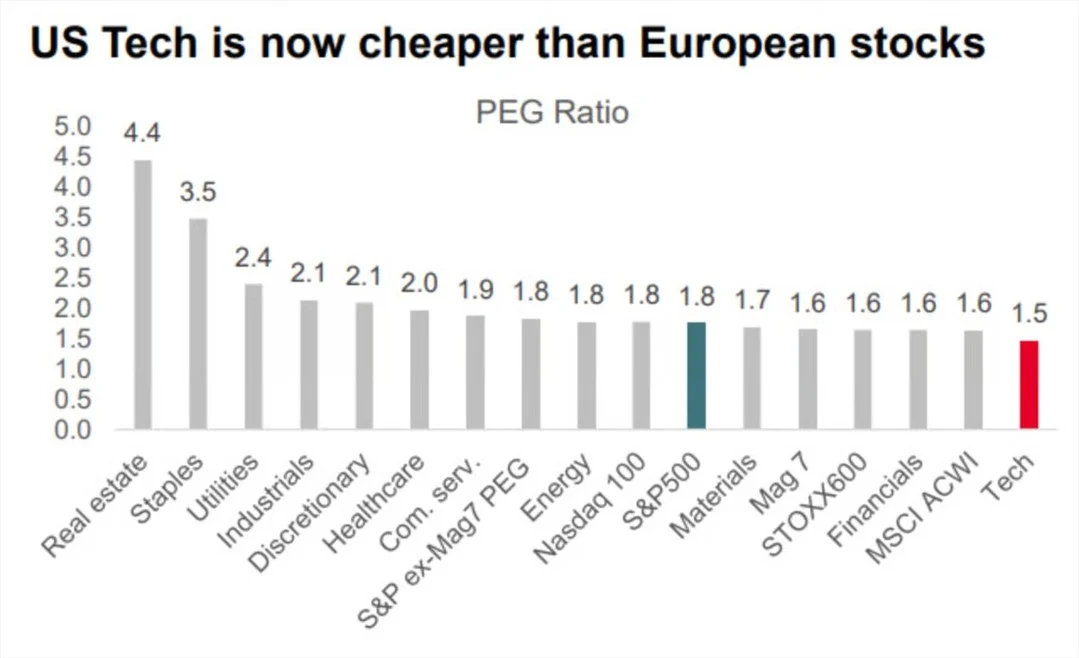
Tech Stocks Deeply Discounted vs Projected Earnings Growth
Relative to projected earnings growth, the Tech sector is trading at a steep discount. via SocGen Kabra
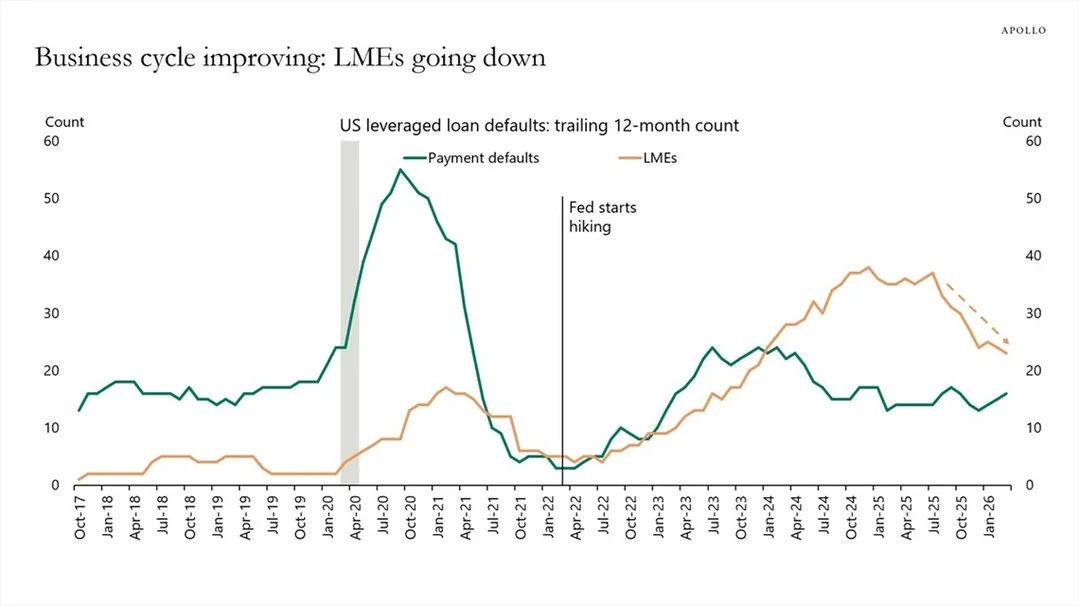
LMEs Fall as Fed Rate Hikes Reverse Trend
"As the Fed began raising rates in 2022, LMEs increased as companies faced higher borrowing costs ... That trend is now reversing. Over the past nine months, LMEs have declined." -Apollo Slok
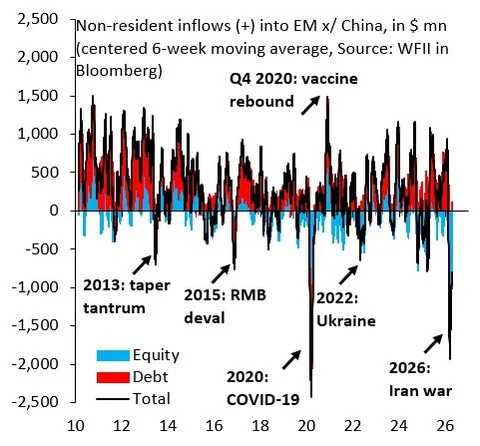
Emerging Market Outflows Near COVID-Level Severity
EM "outflows have been almost as bad as during COVID, i.e. they’ve been massive." -Robin J. Brooks, Shadow Price Macro
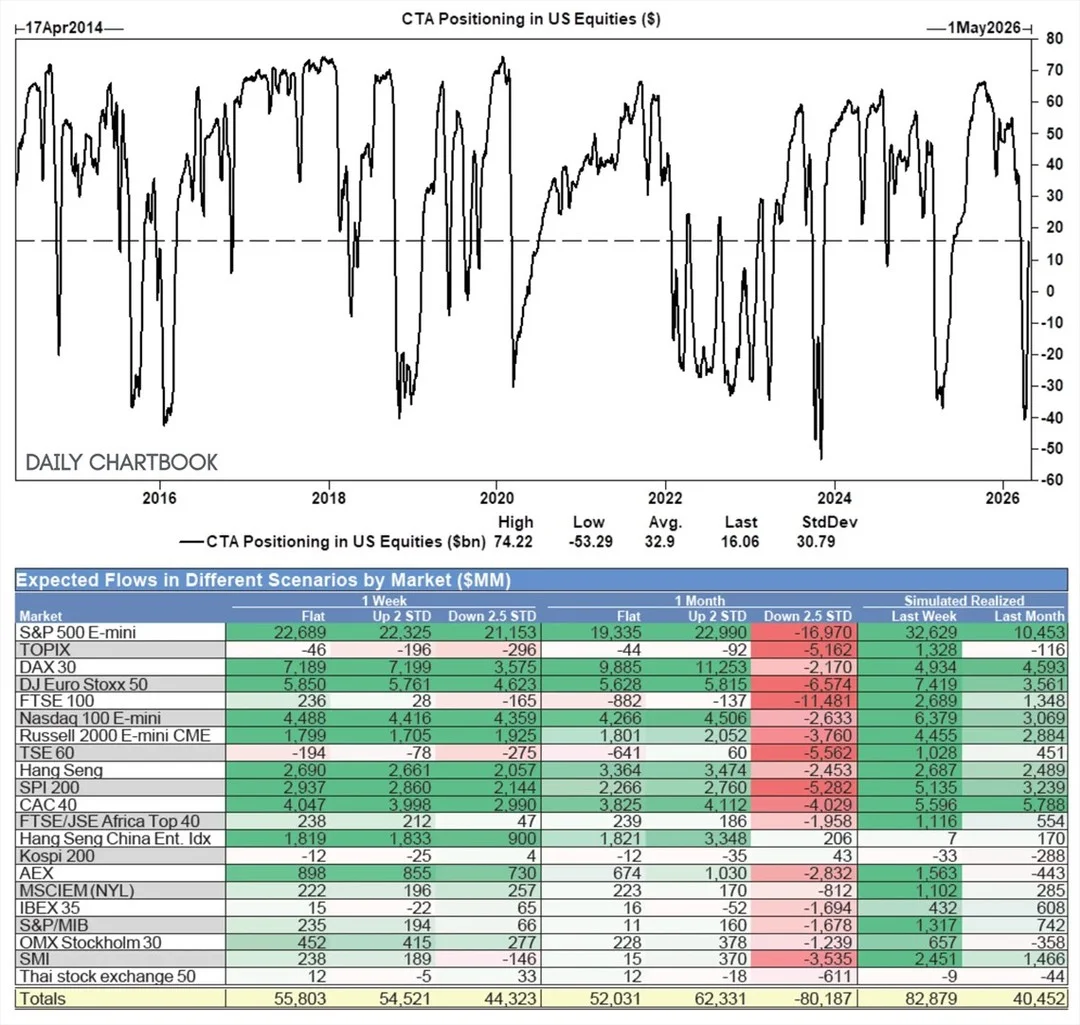
GS Morgan Reports Record 5‑Day US Equity Buying Surge
"We've witnessed the largest 5d stretch of buying of US equities on record. Our latest positioning estimate is long $16bn (this has gotten as high as $74bn). Still wood to chop but imagine the pace is less violent." -GS Morgan
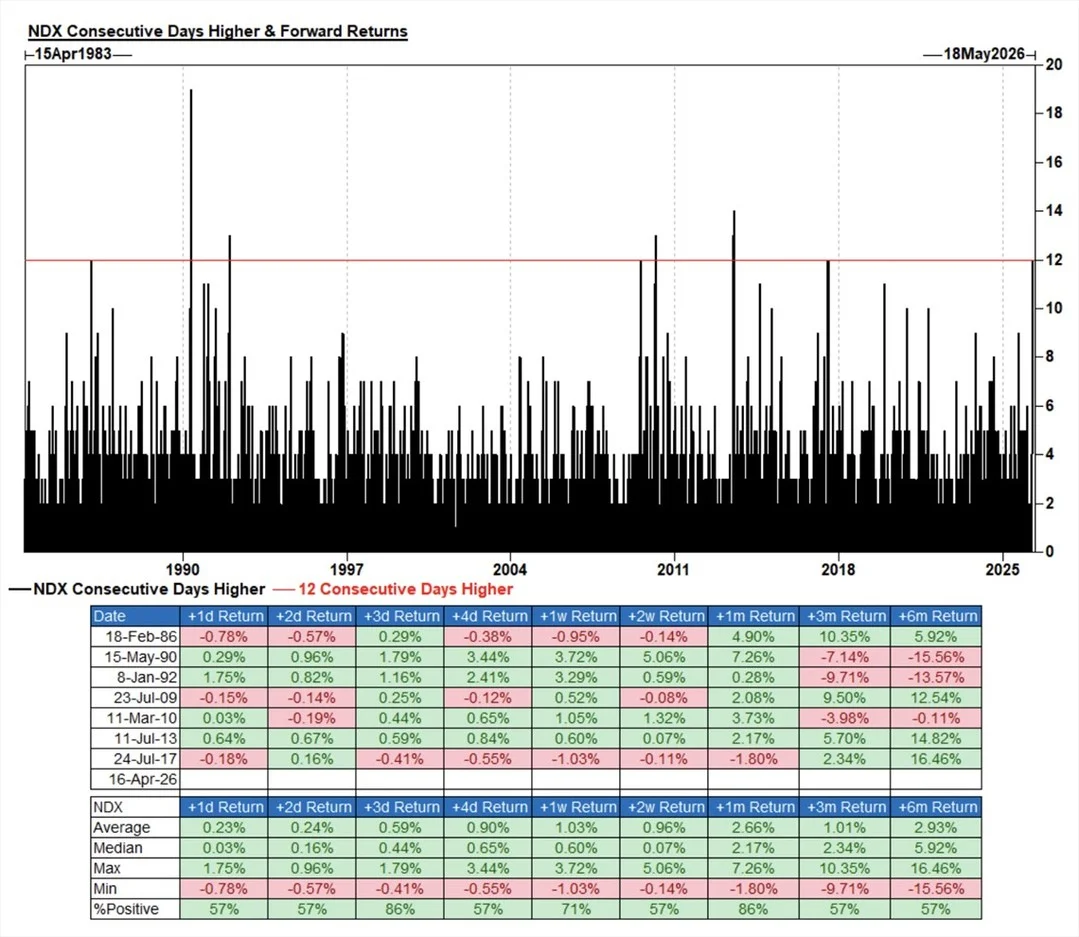
NDX's 12‑Day Rally Hits Rare 14.7% Surge
"NDX has now rallied for 12 consecutive sessions for a whopping +14.7% ... Since 1983, we’ve only seen seven other comparable streaks… forward returns were strong." -GS Morgan
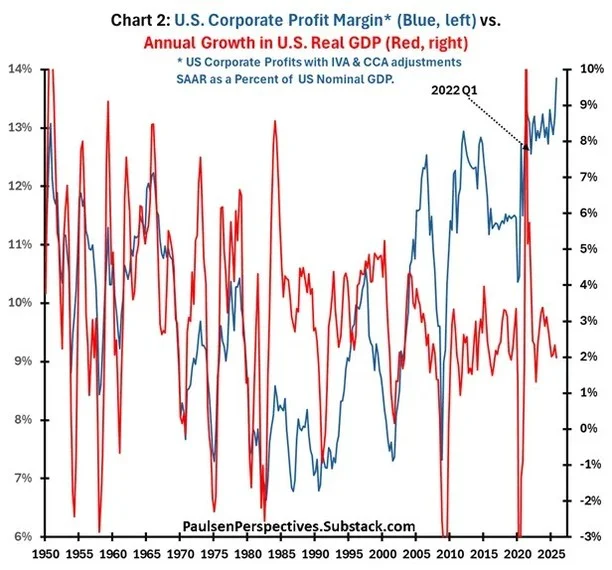
Profit Margins Soar While Economic Fundamentals Decline
"Alarmingly, in recent years, the trend of rising profit margins has become increasingly divorced from underlying traditional economic fundamentals." -Jim Paulsen, Paulsen Perspectives
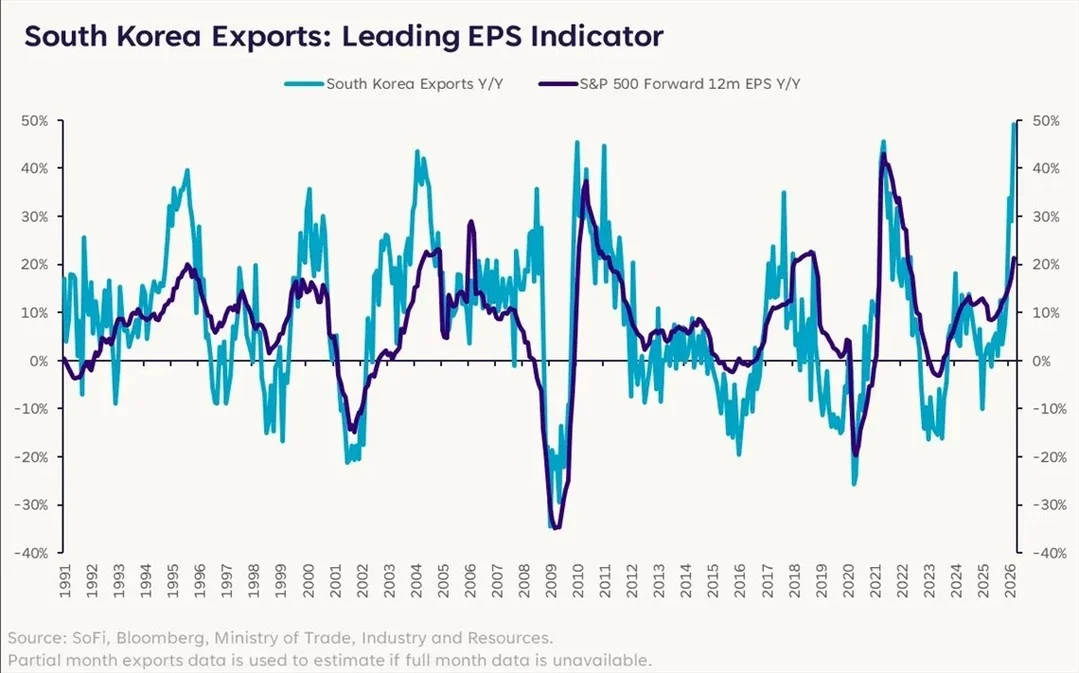
South Korean Exports Precede U.S. Earnings Growth by Month
"South Korean exports tend to lead U.S. forward earnings growth by roughly one month, largely due to the technology ordering cycle" -Liz Thomas, SoFi
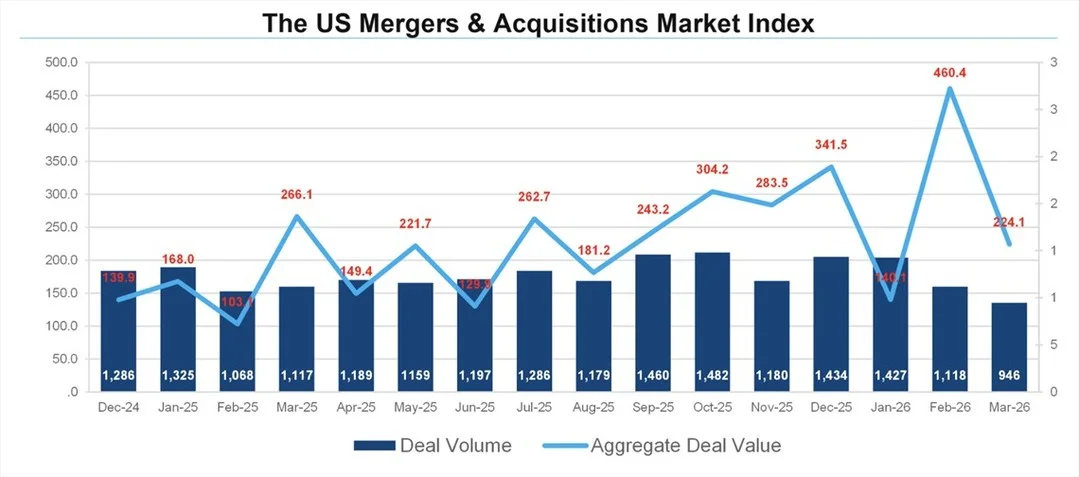
US M&A Deal Volume Drops 15% in March
"U.S. M&A deal activity decreased in March, going down 15.4% with 946 announcements compared to 1,118 in February. Aggregate M&A spending decreased as well. In March, 51.3% less was spent on deals compared to February." -FactSet
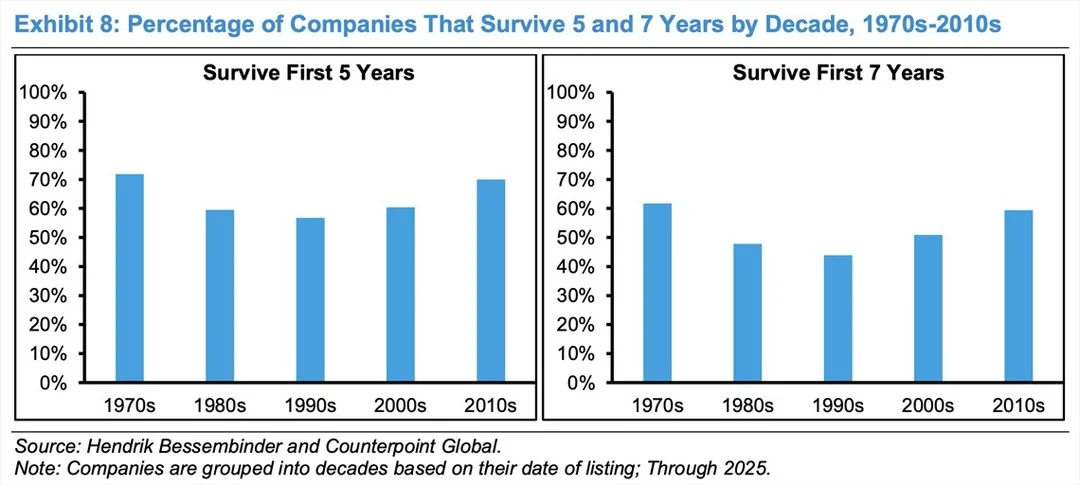
Public Companies Now Outlast Since 1970s
"The longevity of public companies is the longest it has been since the 1970s." -Michael Mauboussin, Morgan Stanley
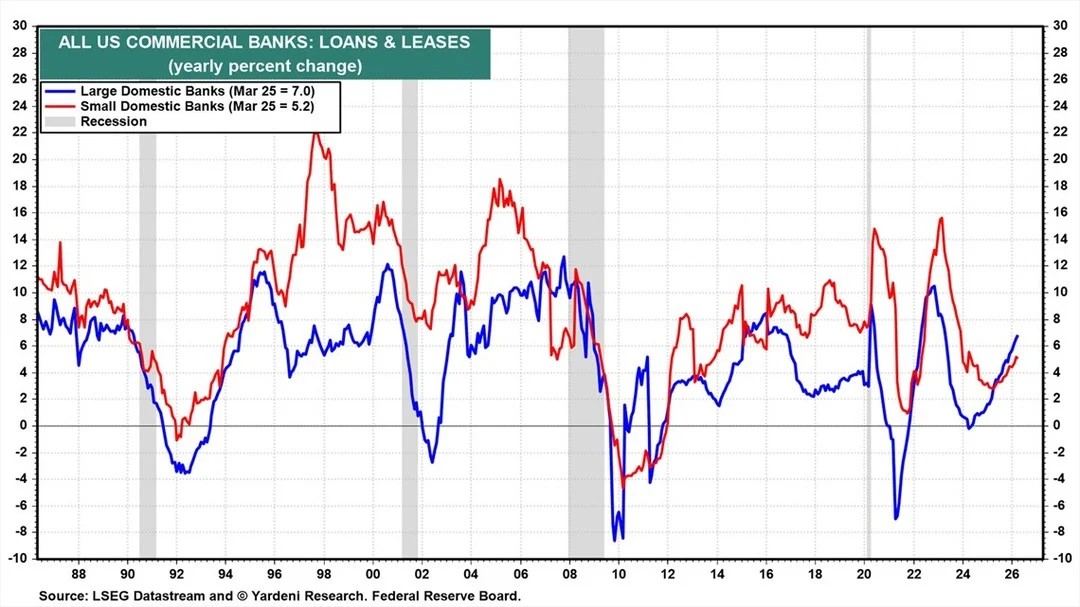
Commercial Banks Boost Lending Amid Shadow Banking Strains
"While there are cracks in the 'shadow' banking system, commercial banks are actually increasing their lending. There's no sign of a credit crunch in the Fed's weekly bank loan data." -Yardeni
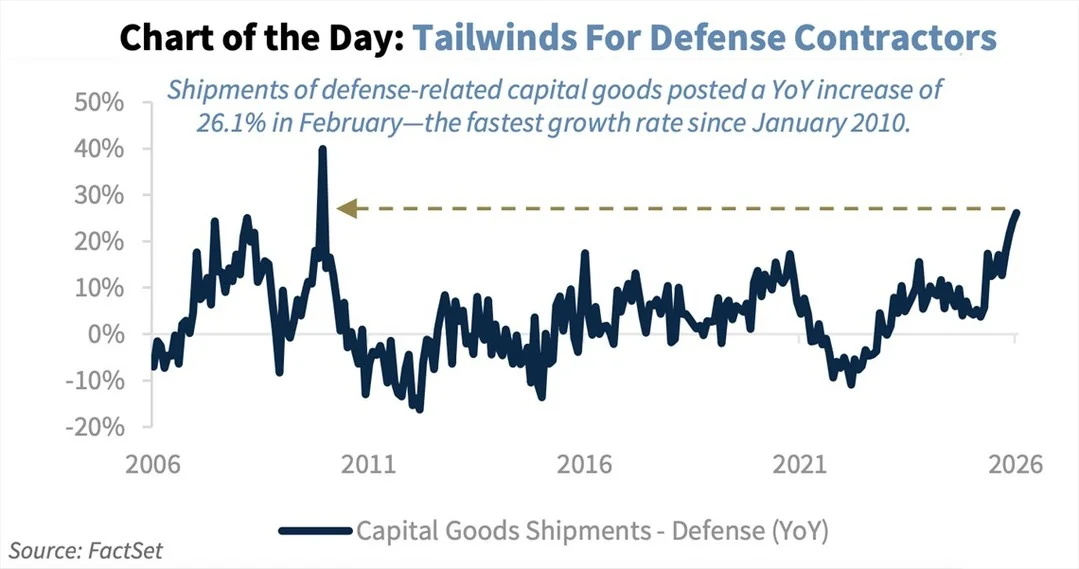
Defense Capital Goods Shipments Jump 26% YoY, Fastest Since 2010
"Shipments of defense-related capital goods surged 26.1% YoY in February—the fastest pace since 2010" -Larry Adam, Raymond James
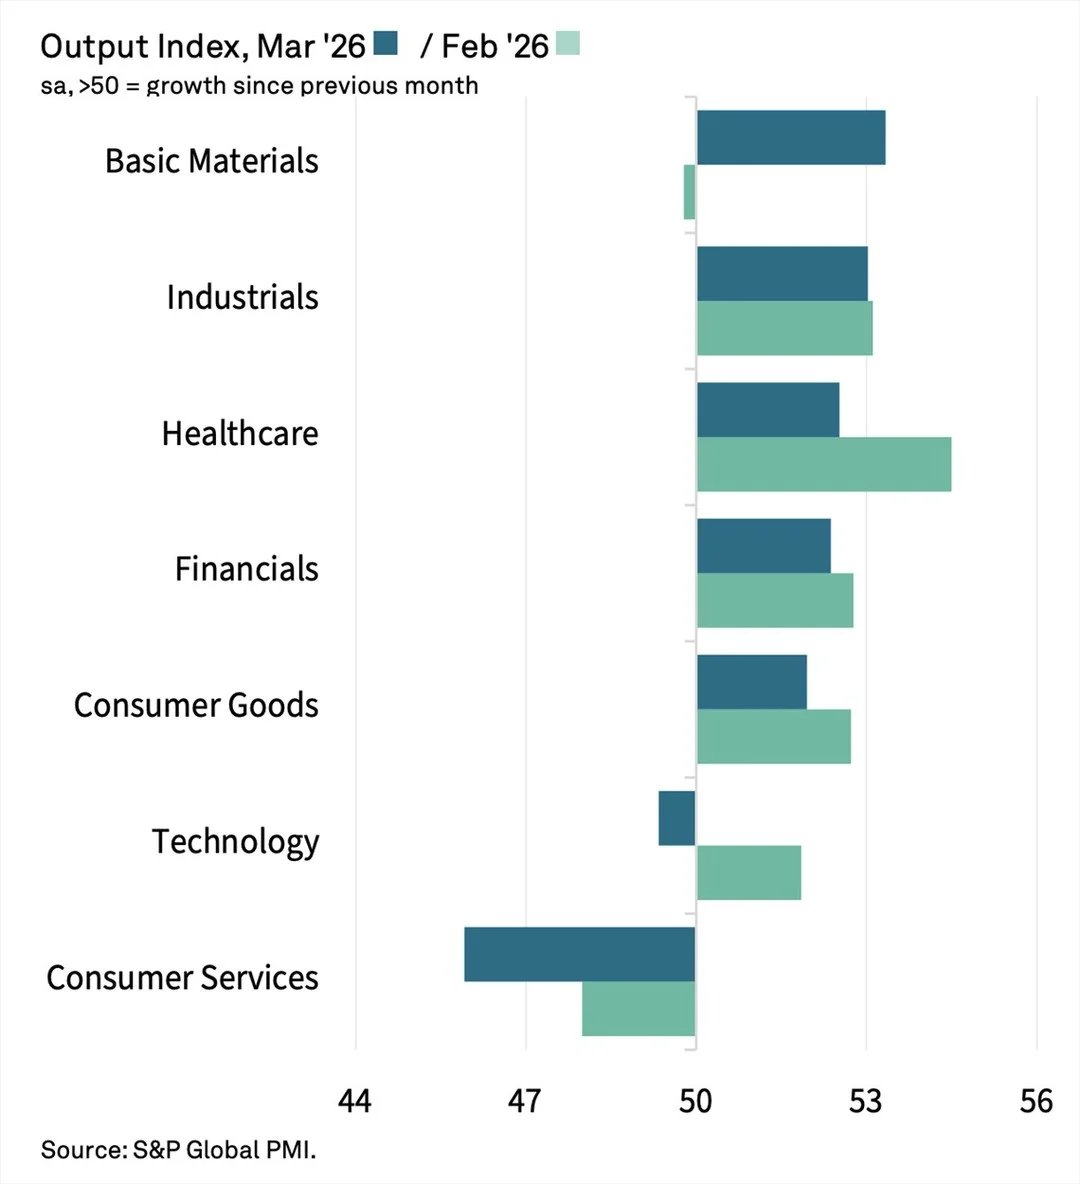
US PMI March: Broad Growth, Slowing Expansion Across Sectors
US sector PMIs: "March data pointed to higher levels of business activity in five out of seven US sectors, but in almost all cases the pace of expansion slowed since the previous month." -S&P Global
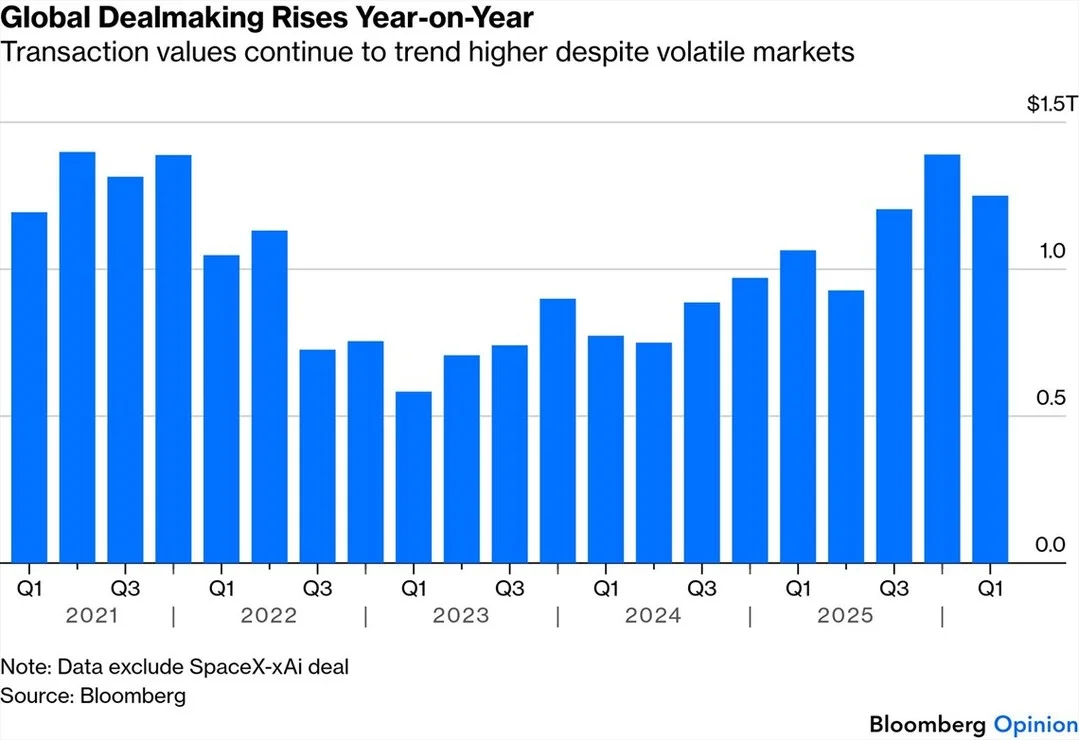
Q1 Global M&A Surges 20% to $1.3 Trillion
Global M&A: "Transaction values of about $1.3 trillion [in Q1] were almost 20% higher than the same period last year" -John Authers, BBG
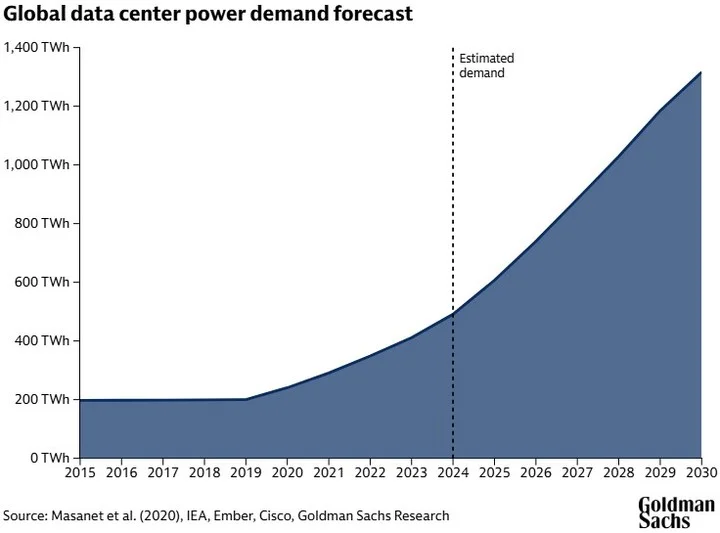
Data Centers to Consume 220% More Power by 2030
Goldman Sachs "now projects global power demand from data centers to grow 220% by 2030 relative to 2023 levels, up from 175% previously."
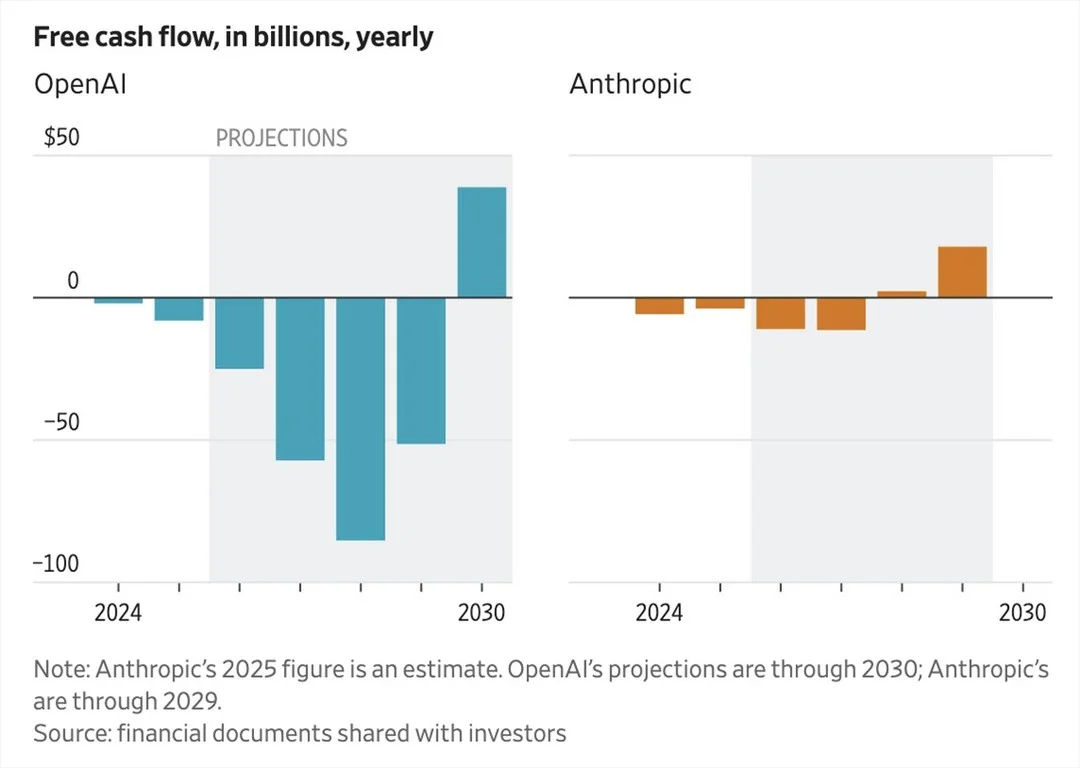
OpenAI, Anthropic Face Massive Cash Burn, Depend on IPO Funding
"Both OpenAI and Anthropic will burn through a giant amount of cash in the coming years, and are counting on their IPO investors to help buoy their businesses." -WSJ
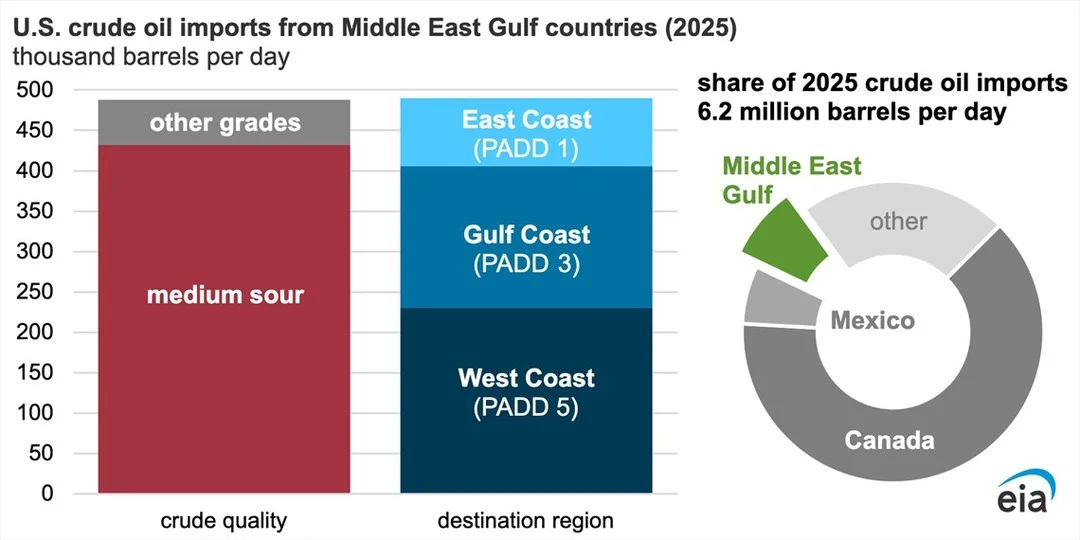
Middle East Gulf Supplies only 8% of U.S. Crude Imports
"Imports from the Middle East Gulf region made up 8% of the 6.2 million b/d of U.S. crude oil imports in 2025" -EIA
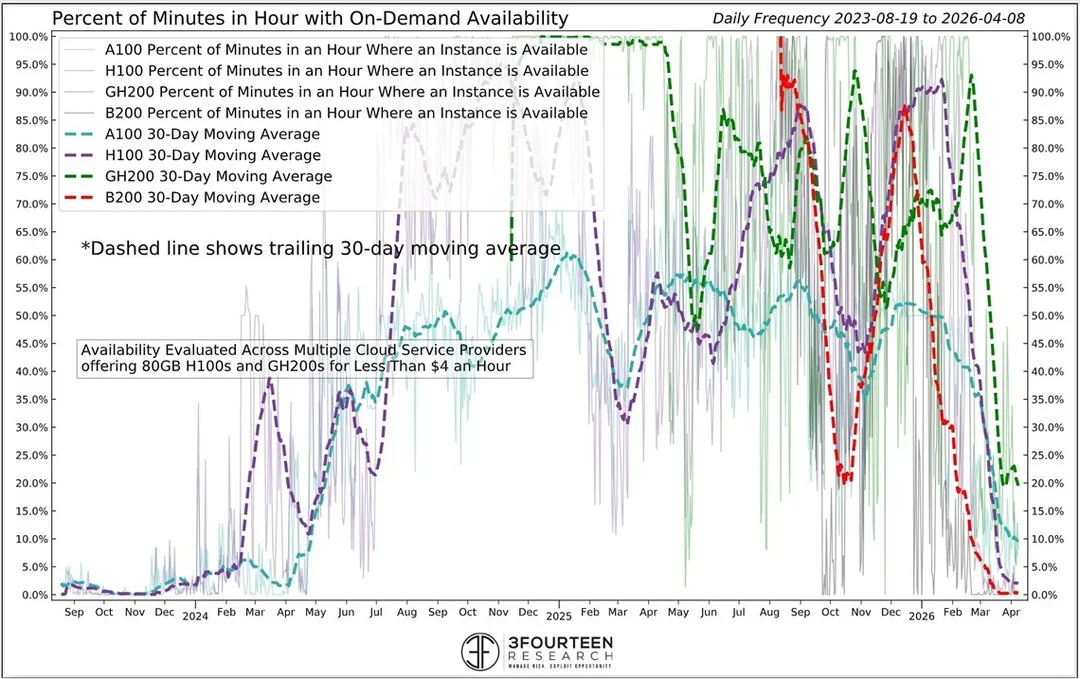
AI Will Fuel Bull Market Despite GPU Scarcity
"As the Iran War has ebbed and flowed, GPU availability for B200s has collapsed to zero...H100s close behind. Whatever happens with the war, the AI complex is likely to lead any true sustainable bull market" -Warren Pies, 3Fourteen Research
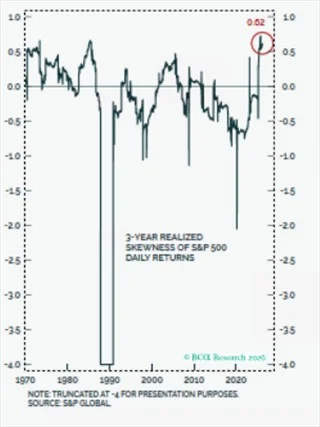
S&P 500 Shows Decade‑Best Positive Skew,
"On a 3 year basis S&P500 returns have had the most positive skew in decades. We are in a 'stairs down, elevator up' environment. The era of TACO" -Juan Correa-Ossa, BCA
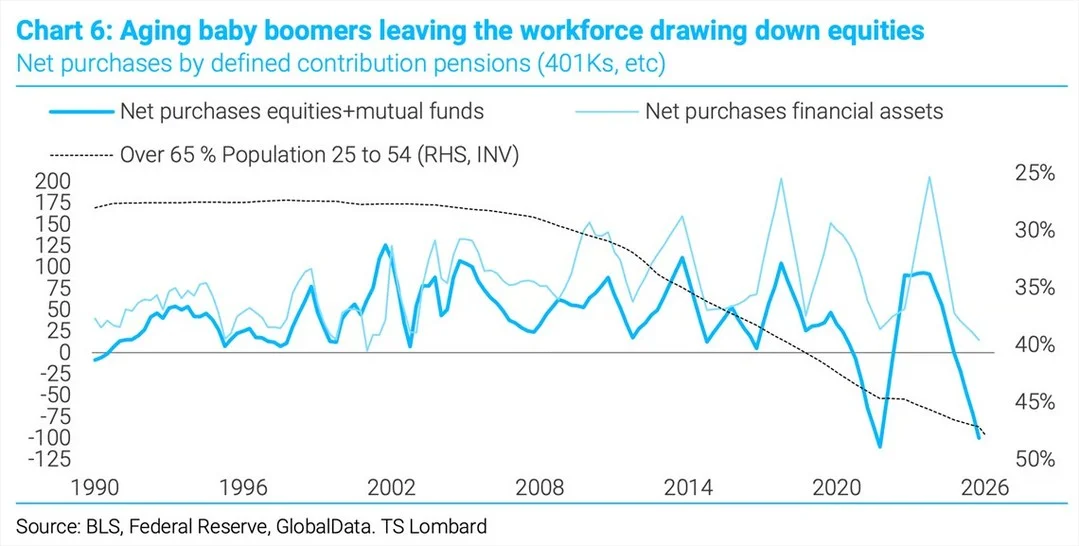
Aging Boomers Push Pensions to Dump Stocks for Bonds
"As the population is aging, defined contribution pensions are increasing net sellers of equities as net purchases of financial assets slow ... the baby-boomer generation is at the cusp of swapping equities for debt (bills and notes, mostly)." -Steven Blitz, TS...
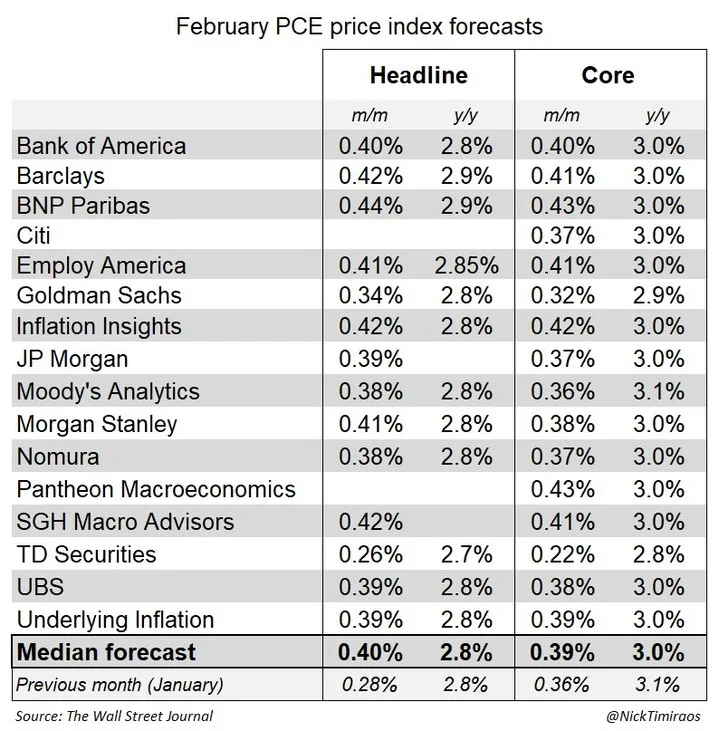
Core PCE Climbs 0.4% for Third Consecutive Month
"Wall Street forecasters estimate the core PCE index (due Thursday) rose 0.39% in February, which would round to 0.4% for the third straight month" -Nick Timiraos, WSJ
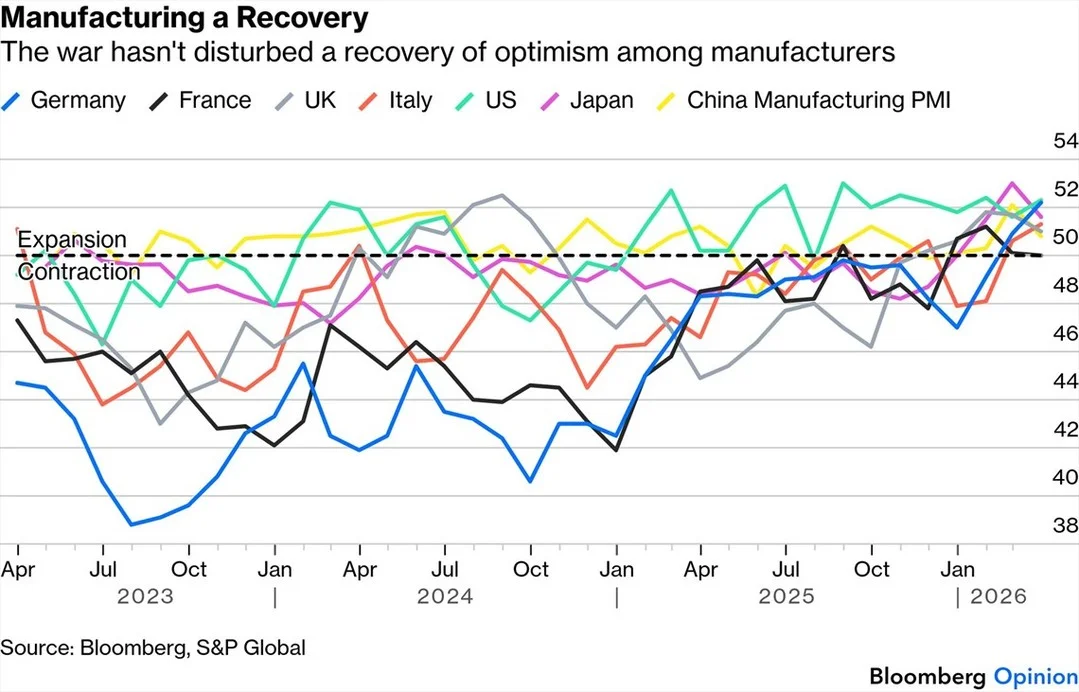
Manufacturing Grows Amid War, S&P Global Shows
"Data collected by S&P Global suggest that manufacturing is expanding despite the war" -John Authers, BBG
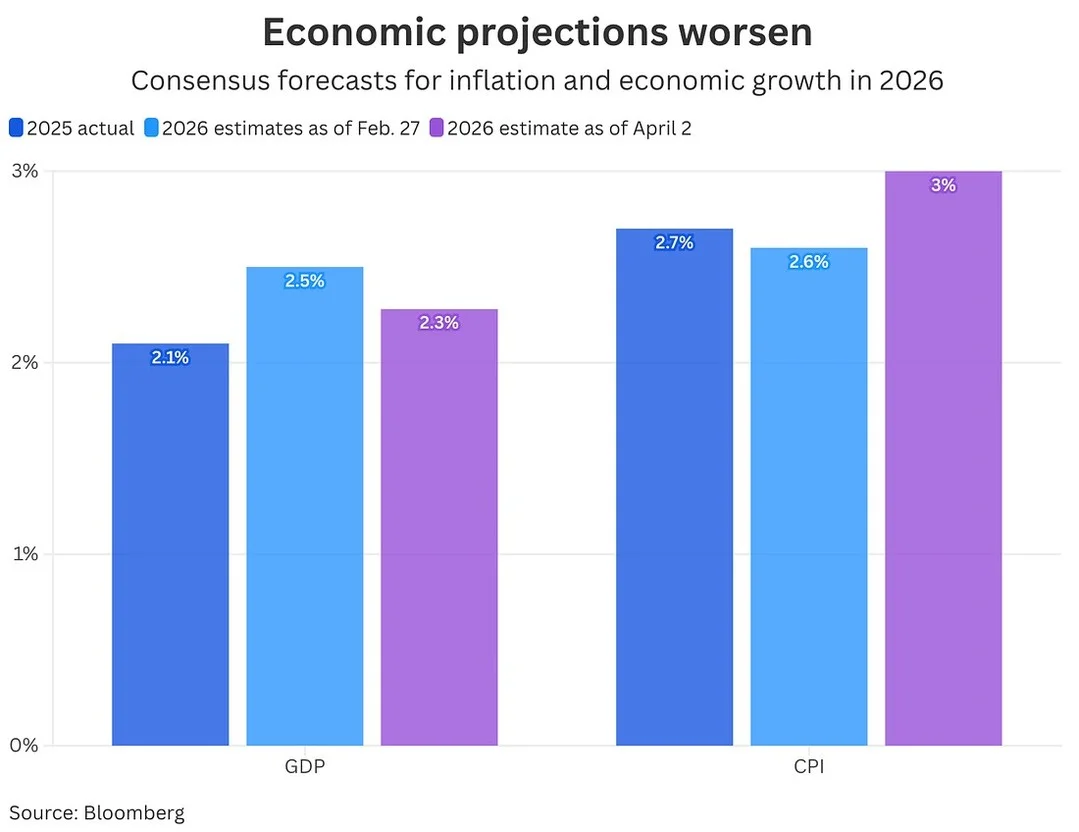
GDP 2.3% Growth, CPI Near 3% by Year-End
"Consensus estimates from Bloomberg now project GDP at 2.28% and headline CPI inflation at 3% to end the year." -Josh Schafer
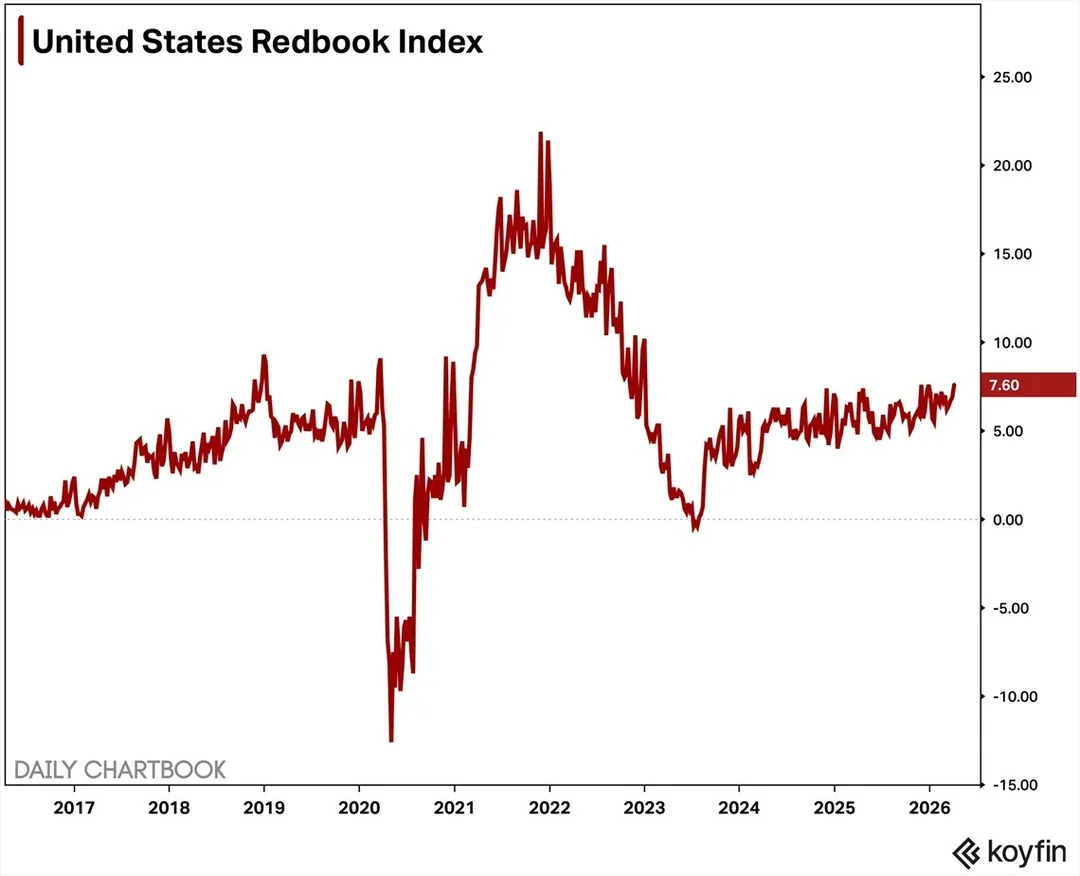
Same‑store Sales Hit YTD High, up 7.6% YoY
Same-store retail sales rose by YTD high 7.6% YoY for the week ending Apr 4 (6.9% prev).
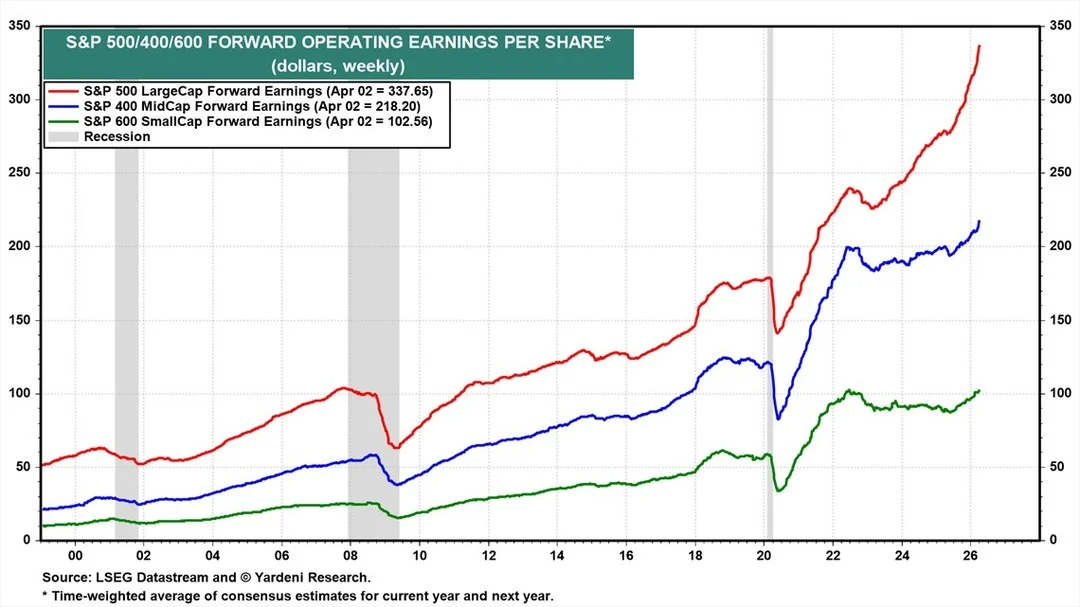
Broadening Forward Earnings Signal Bullish Market Momentum
"S&P 500 forward earnings continues to rise rapidly, while S&P 400 and S&P 600 forward earnings are also moving higher. The broadening breadth of forward earnings in recent months is a bullish development." -Yardeni
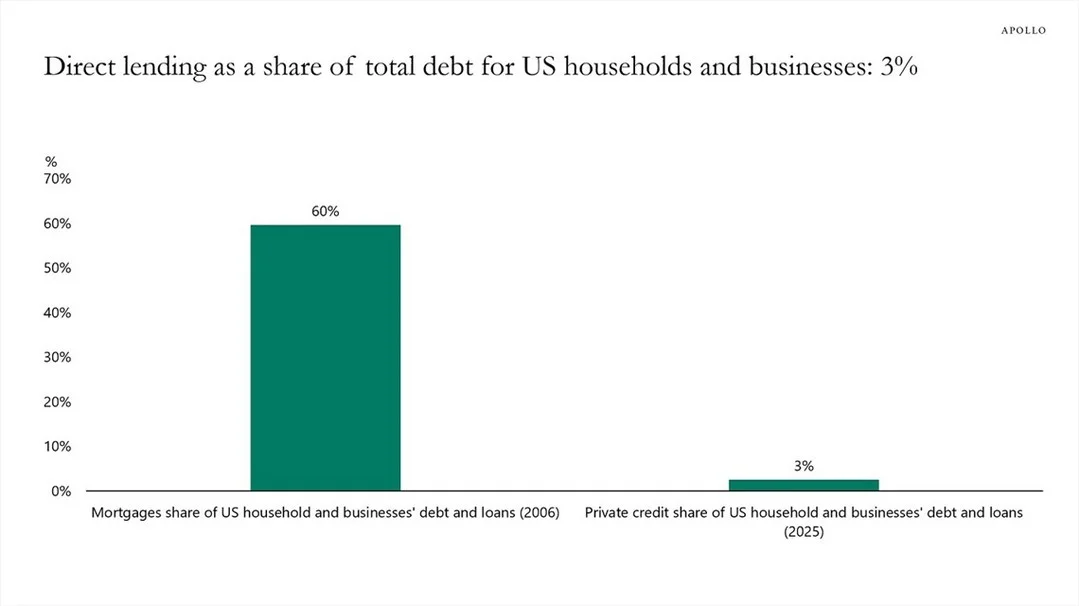
Direct Lending Is Just 3% of US Debt, Mortgages Dominate
"The direct lending market is roughly $2 trillion, or about 3% of total debt outstanding for US households and businesses. By comparison, mortgages accounted for about 60% of total household and corporate debt at the peak of the housing bubble...
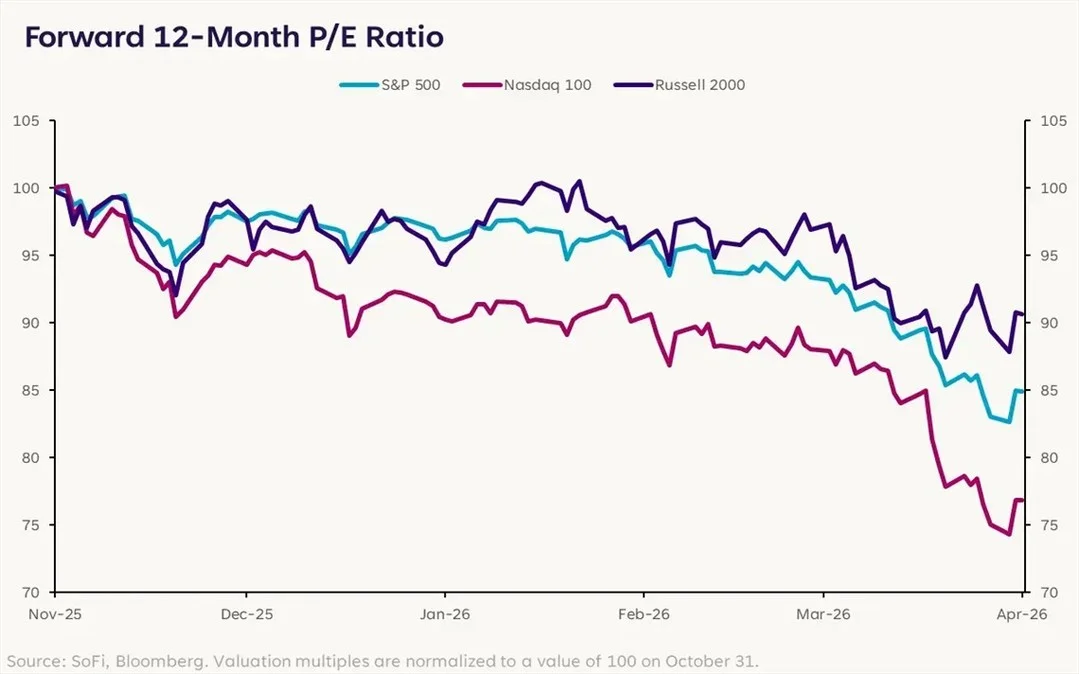
Nasdaq 100 P/E Drops 23%, Russell 2000 Lags
"The Nasdaq 100’s forward price-to-earnings ratio (P/E) has compressed by 23% since the highs at the end of October, while the Russell 2000 P/E has only compressed by 9%." -Liz Thomas, SoFi
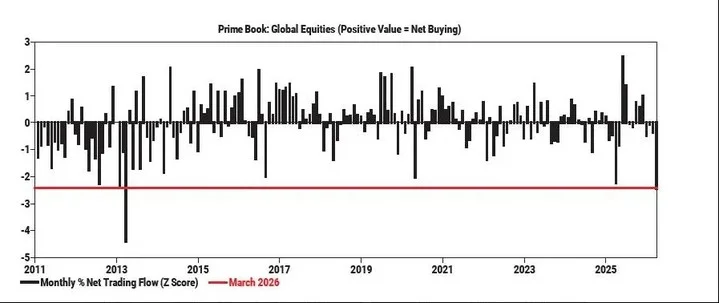
Hedge Funds Dump Global Stocks at 13‑Year High
"Hedge funds sold global stocks at the fastest pace in 13 years in March ... The pace of selling was the second-largest since [Goldman] started collecting the data in 2011." Goldman Sachs via BBG
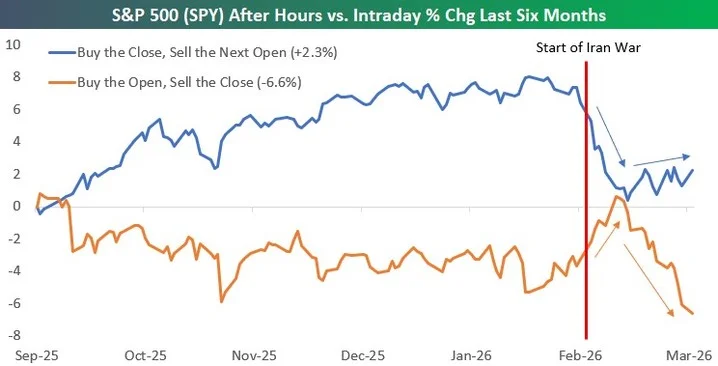
Close‑to‑open Trades Outpace Buy
"Buy and hold has seen a drop of roughly 5% for the S&P over the last six months. Had you only owned the market after hours by buying at the close every day and selling at the next open,...
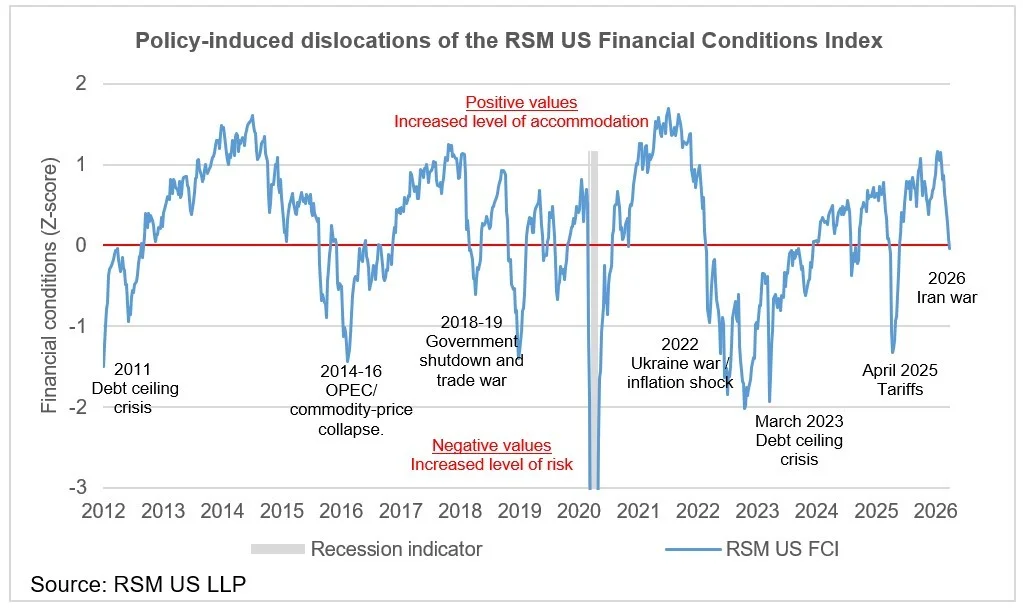
RSM US Financial Conditions Index Turns Negative, Slight Growth Drag
"Our RSM US Financial Conditions Index, which has been decelerating since early February, has turned negative, implying a modest drag on growth." -Joe Brusuelas, RSM
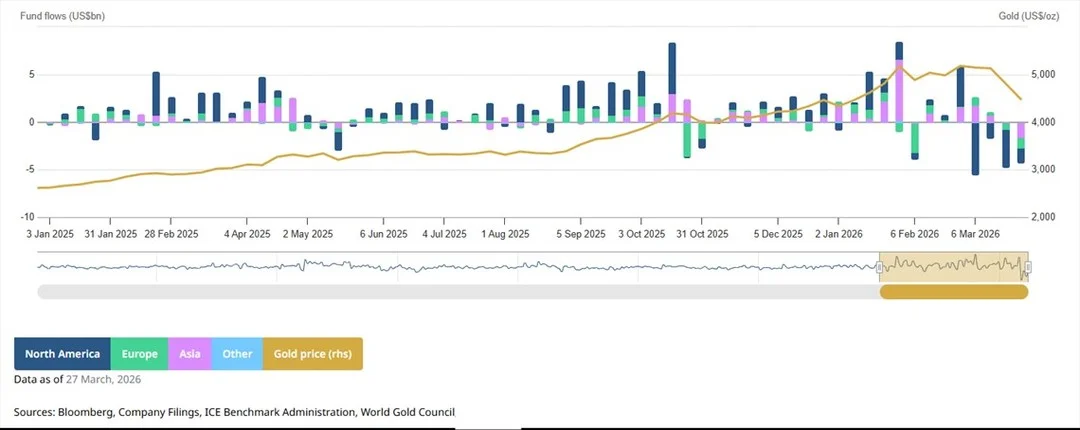
Gold ETFs Face Fourth Straight Week of $4bn Outflows
"It's now four consecutive weeks of outflows for gold ETFs - they saw net outflows of US$4bn (~34 tonnes) last week. That's the fourth consecutive weeks of outflows. All regions saw losses, lead by Asia and North America." -Krishan Gopaul, World...
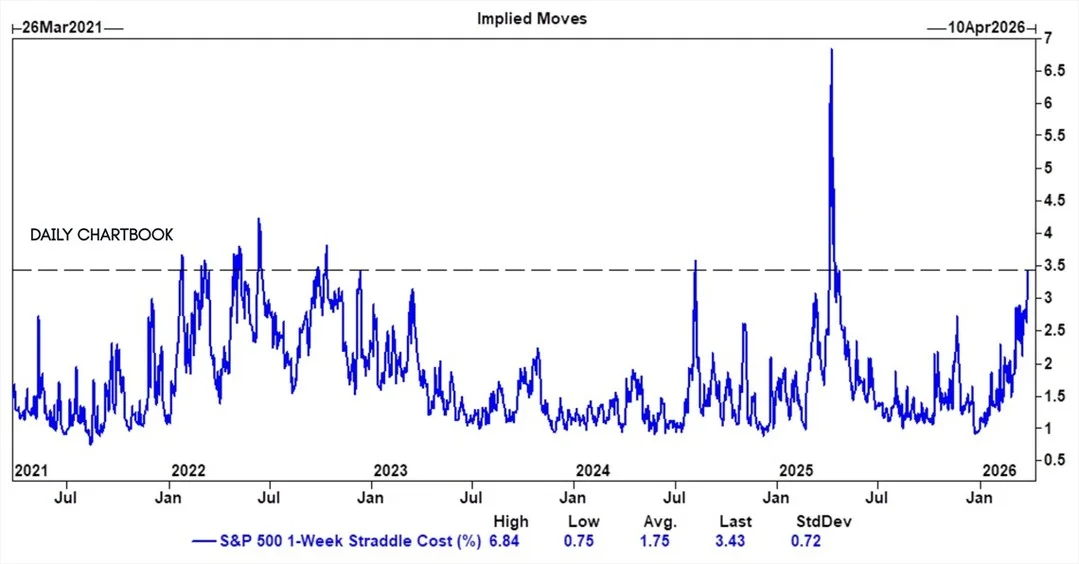
Options Signal Over 3.4% One‑Week SPX Move
"Despite the shortened week, the options market is implying over a 3.4% move for SPX. Not quite as extreme as we saw last year, but still one of the largest 1-week implied moves we have had over the last five...
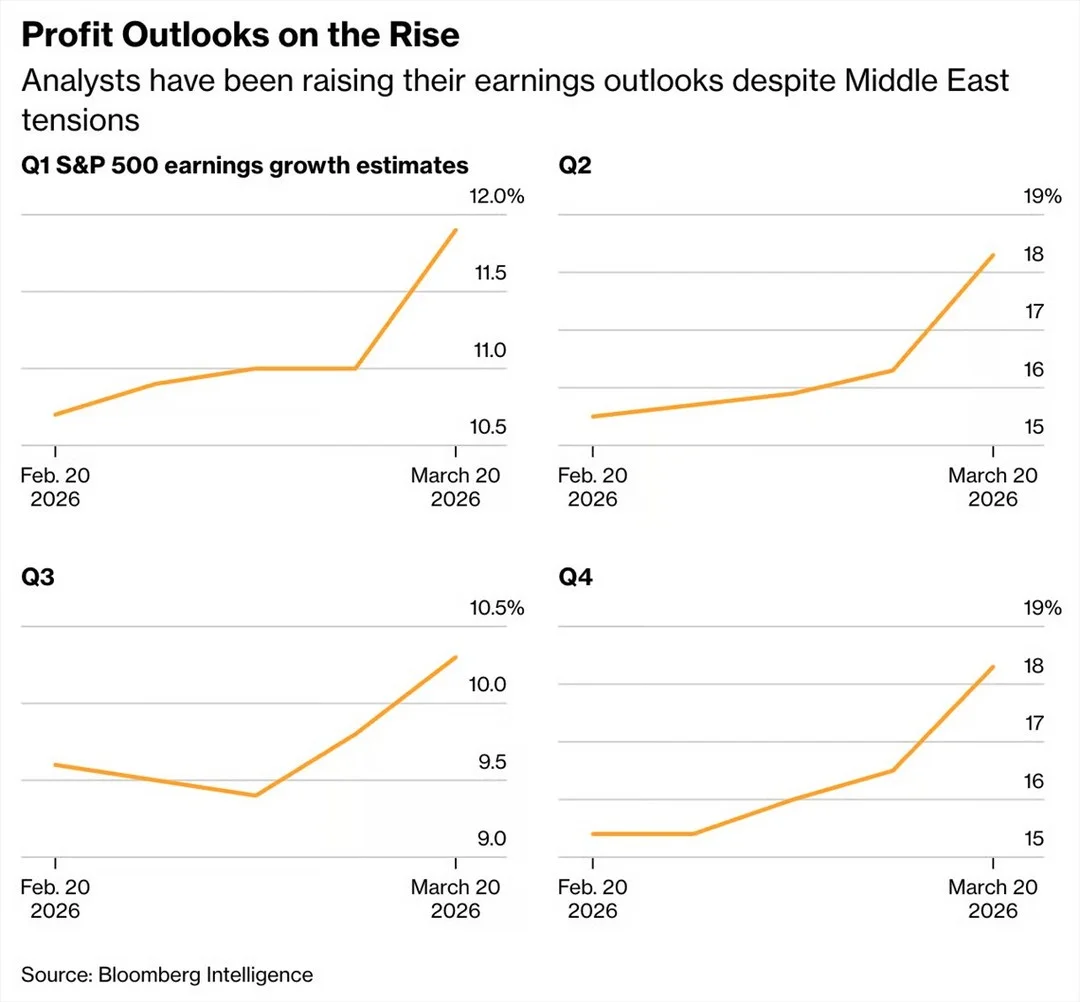
Profits Rise While S&P Prices Drop: Look Past Pain
"The profit outlook for S&P 500 companies has been improving even as share prices have fallen - a dynamic rarely seen during episodes of geopolitical uncertainty ... The setup has historically rewarded investors willing to look through near-term pain." -Bloomberg
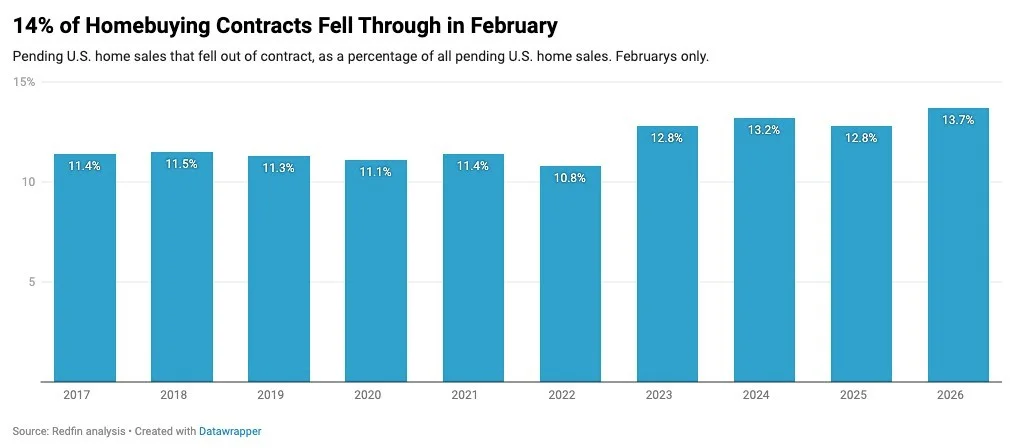
Feb Home-Sale Contracts Fail at Record 13.7%
"More than 42,000 U.S. home-sale agreements fell through in February, equal to 13.7% of homes that went under contract that month. That’s up from 12.8% a year earlier, and the highest February share in records dating back to 2017." -Redfin
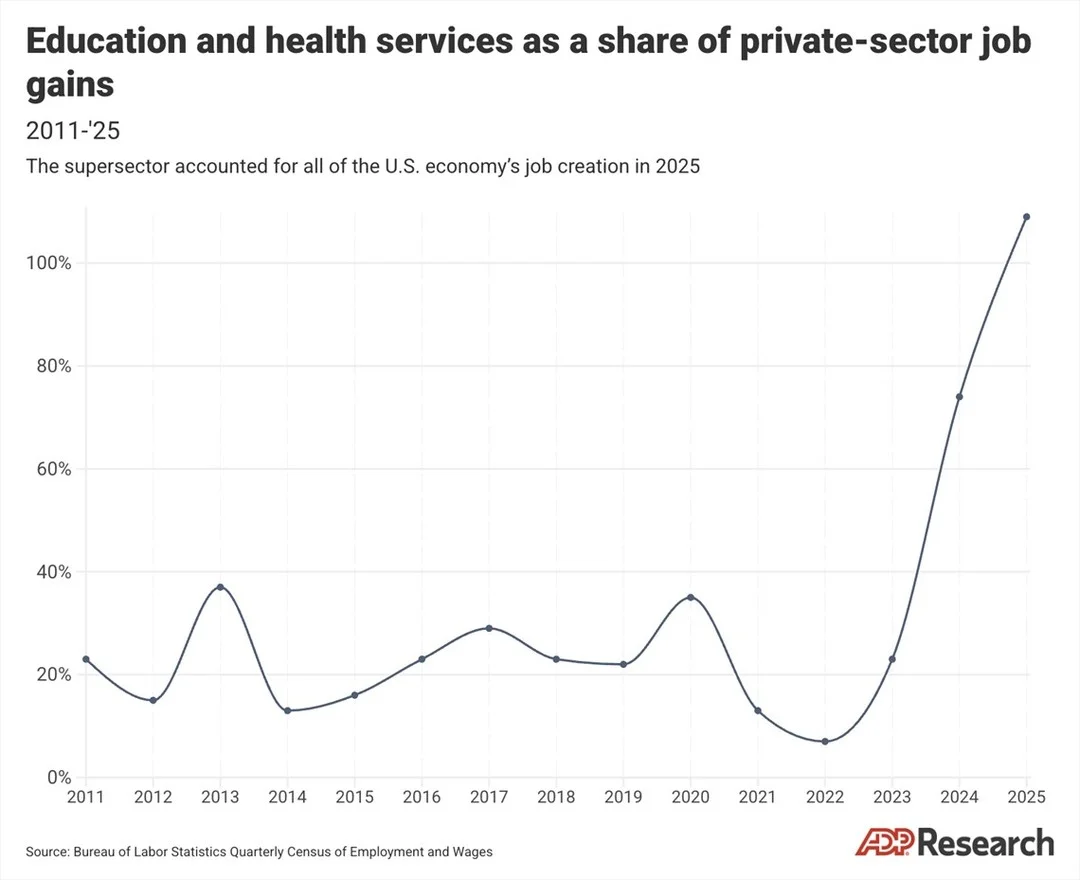
Education and Health Drive Over 100% Private‑Sector Job Growth
The education and health services sector has accounted for 109% of private-sector job creation since January 2025. via ADP
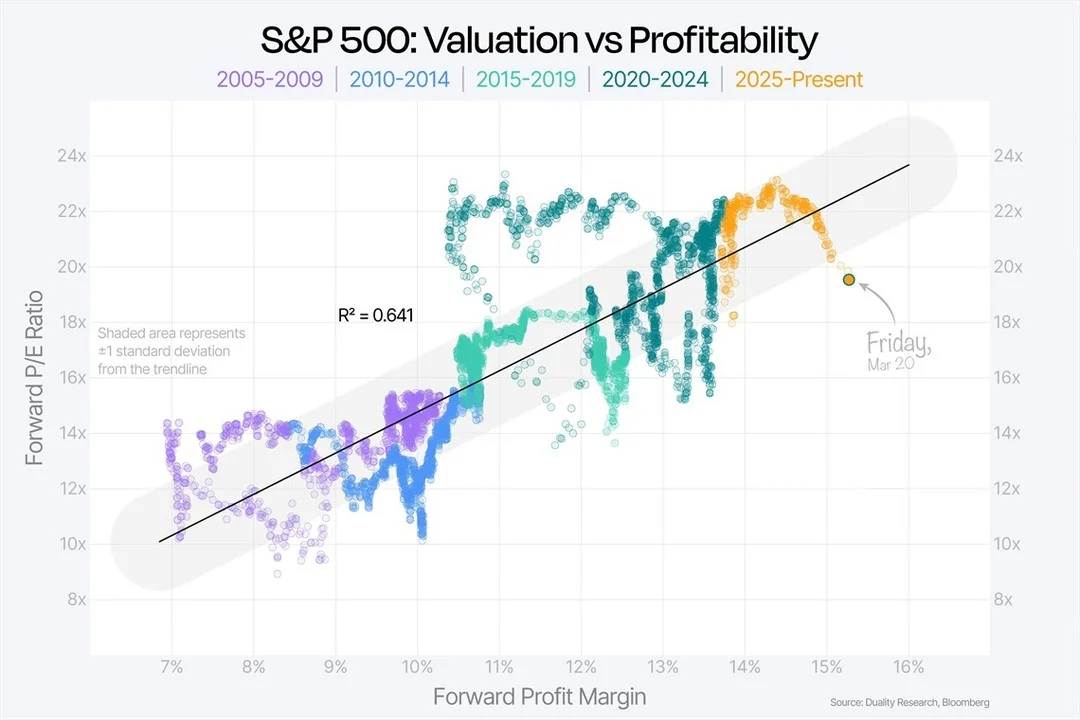
Market Prices Over One Std Below Long‑Term Trend
"When we map recent developments onto our Valuation vs Profitability framework, we can see that the market is now trading more than one standard deviation below its long-term trend." -Duality Research
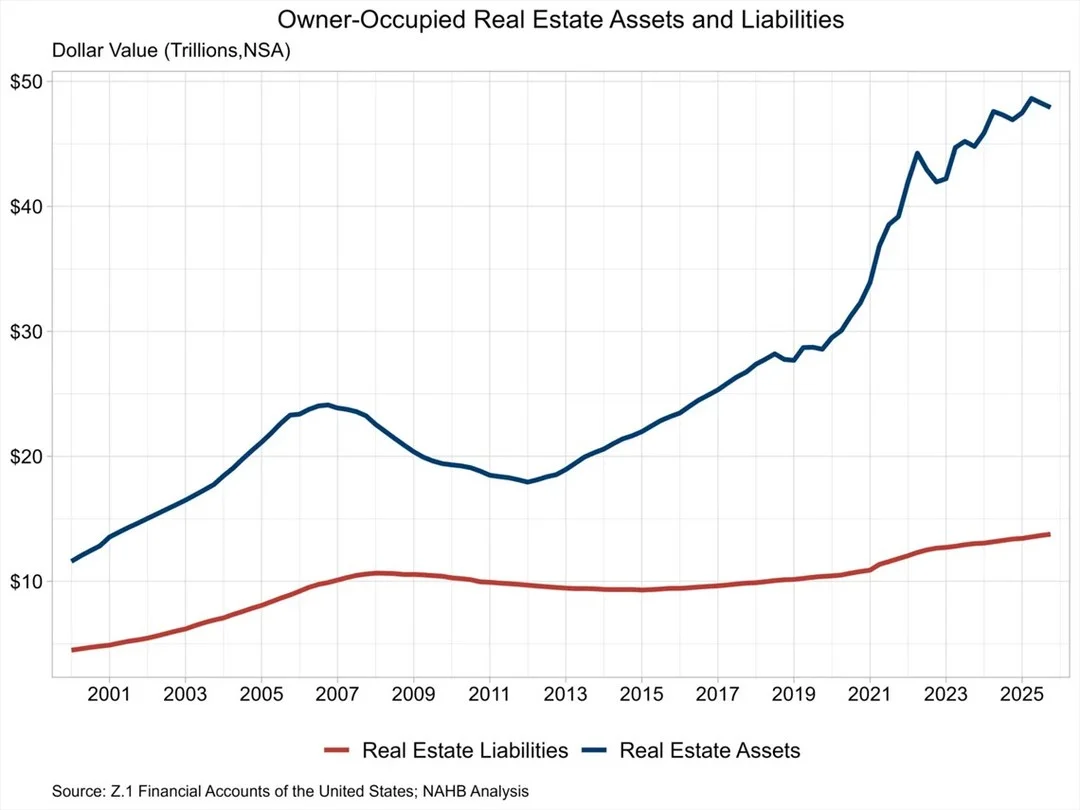
Household Real Estate Value Drops to $47.9 T
"The market value of household real estate assets fell for the second consecutive quarter to $47.9 trillion in the fourth quarter of 2025" -NAHB
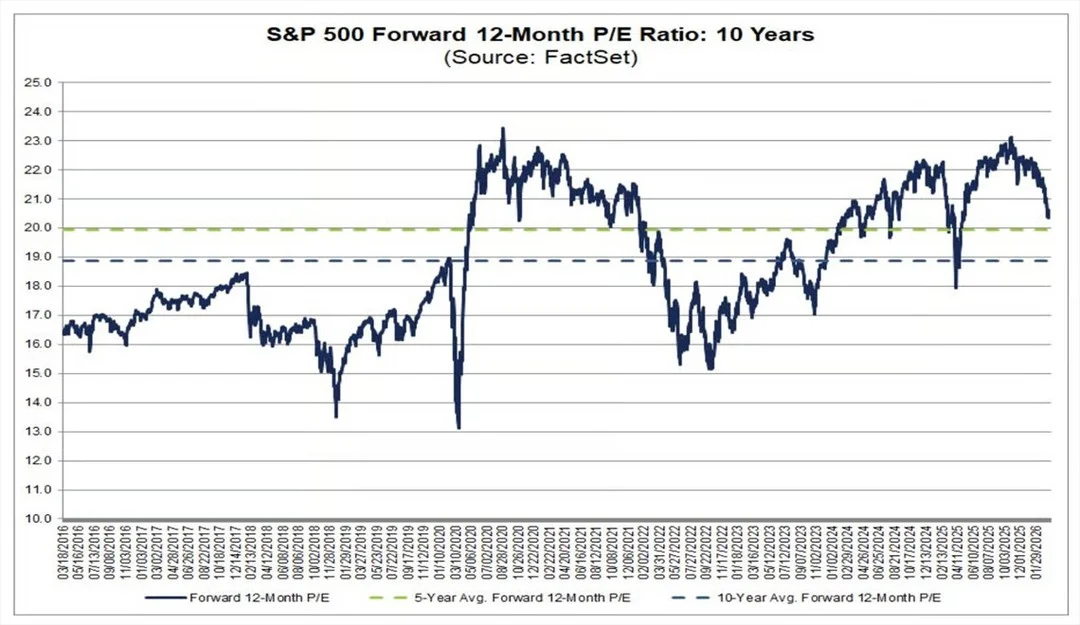
S&P 500 Forward P/E Falls to 20.3
"The forward 12-month P/E ratio for the S&P 500 is 20.3. (down 2.8pts from the high... the market multiple hits correction territory)" -Mike Zaccardi
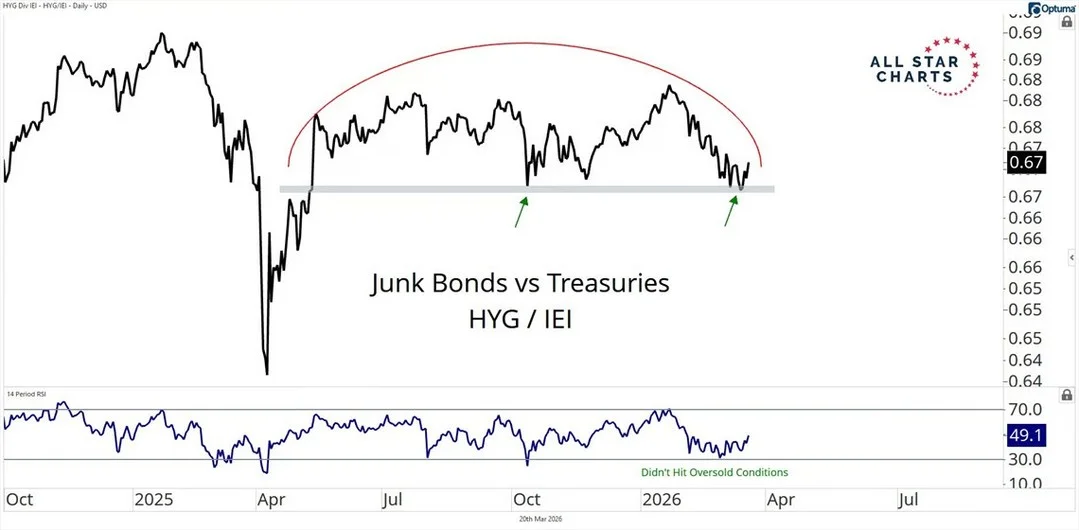
Rising Junk‑Bond/Treasury Gap Threatens Stock Bulls
"A big distribution pattern is carving out in the Junk Bonds vs. Treasuries ratio. A breakdown here would be the last thing stock market bulls want to see." -Alfonso De Pablos, All Star Charts
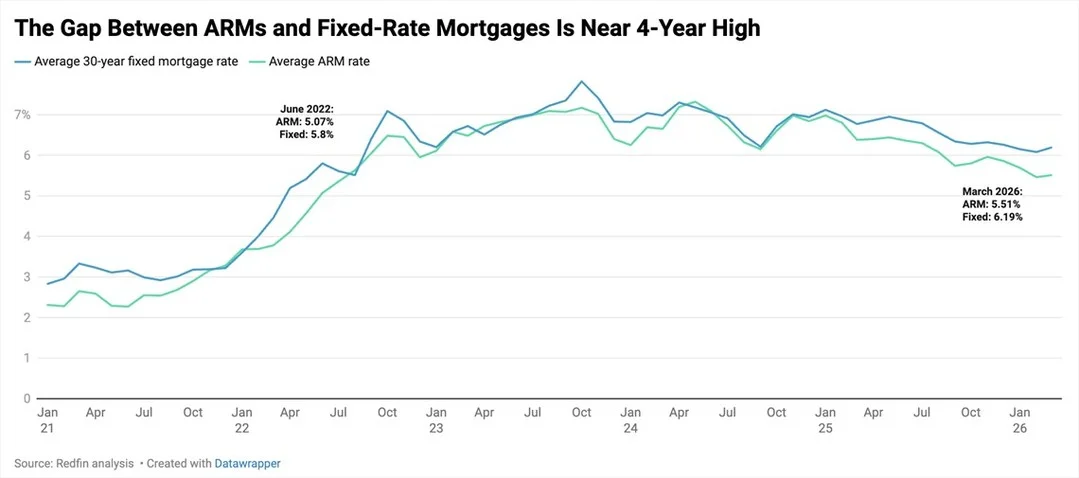
ARMs Offer $150 Monthly Savings, Biggest Discount Since 2022
"The typical homebuyer would save $150 per month taking out an adjustable-rate mortgage instead of a 30-year fixed rate mortgage. That’s a 5.8% discount, the biggest ARM users have had since June 2022 in both dollar and percentage terms." -Redfin
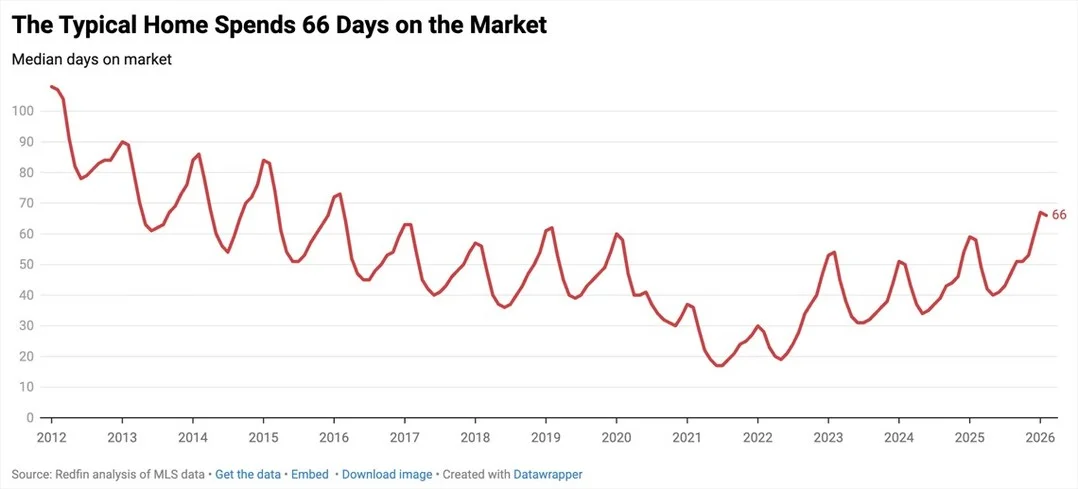
February Home Sales Slowest Since 2016, 66-Day Average
"U.S. homebuyers are taking their time as we head into spring, which is usually the busy season for the housing market. The typical home that went under contract in February spent 66 days on the market. That’s the slowest February...
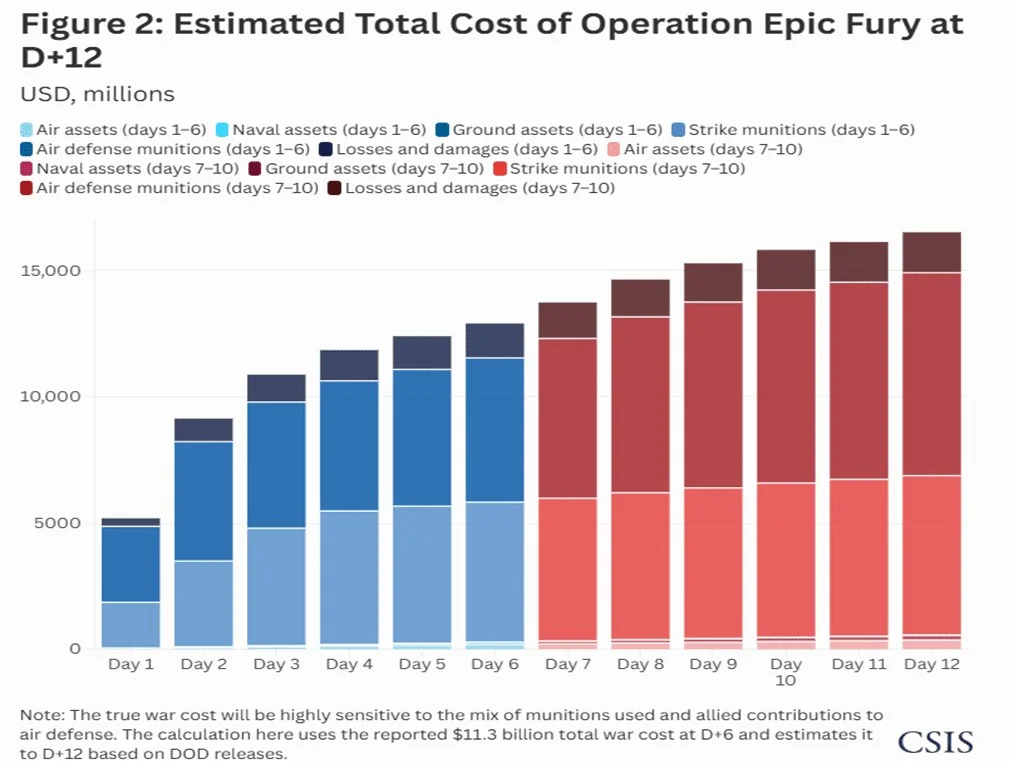
Operation Fury Costs $16.5B in 12 Days, $1B Daily Thereafter
Operation Fury: "In the first 12 days, the estimated cost was $16.5 billion and some have said that the cost going forward could be $1 billion per day." -Charlie Bilello
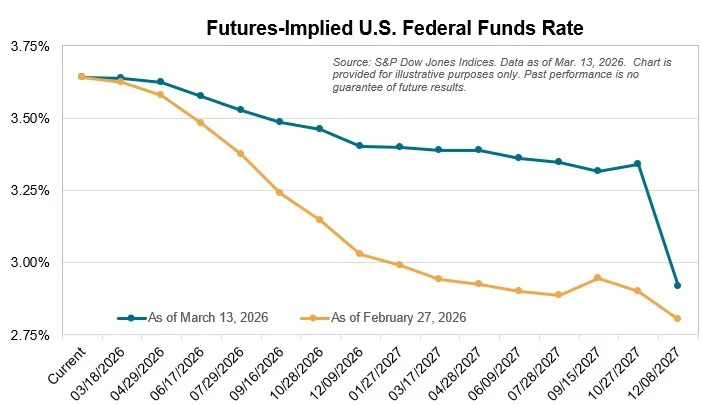
Full Rate Cut Postponed Until March 2027.
"While markets previously anticipated a cut as early as this July and two more by next spring, the current trajectory has moved aggressively, with a full cut now not priced in until March 2027." -S&P Global Vörös