
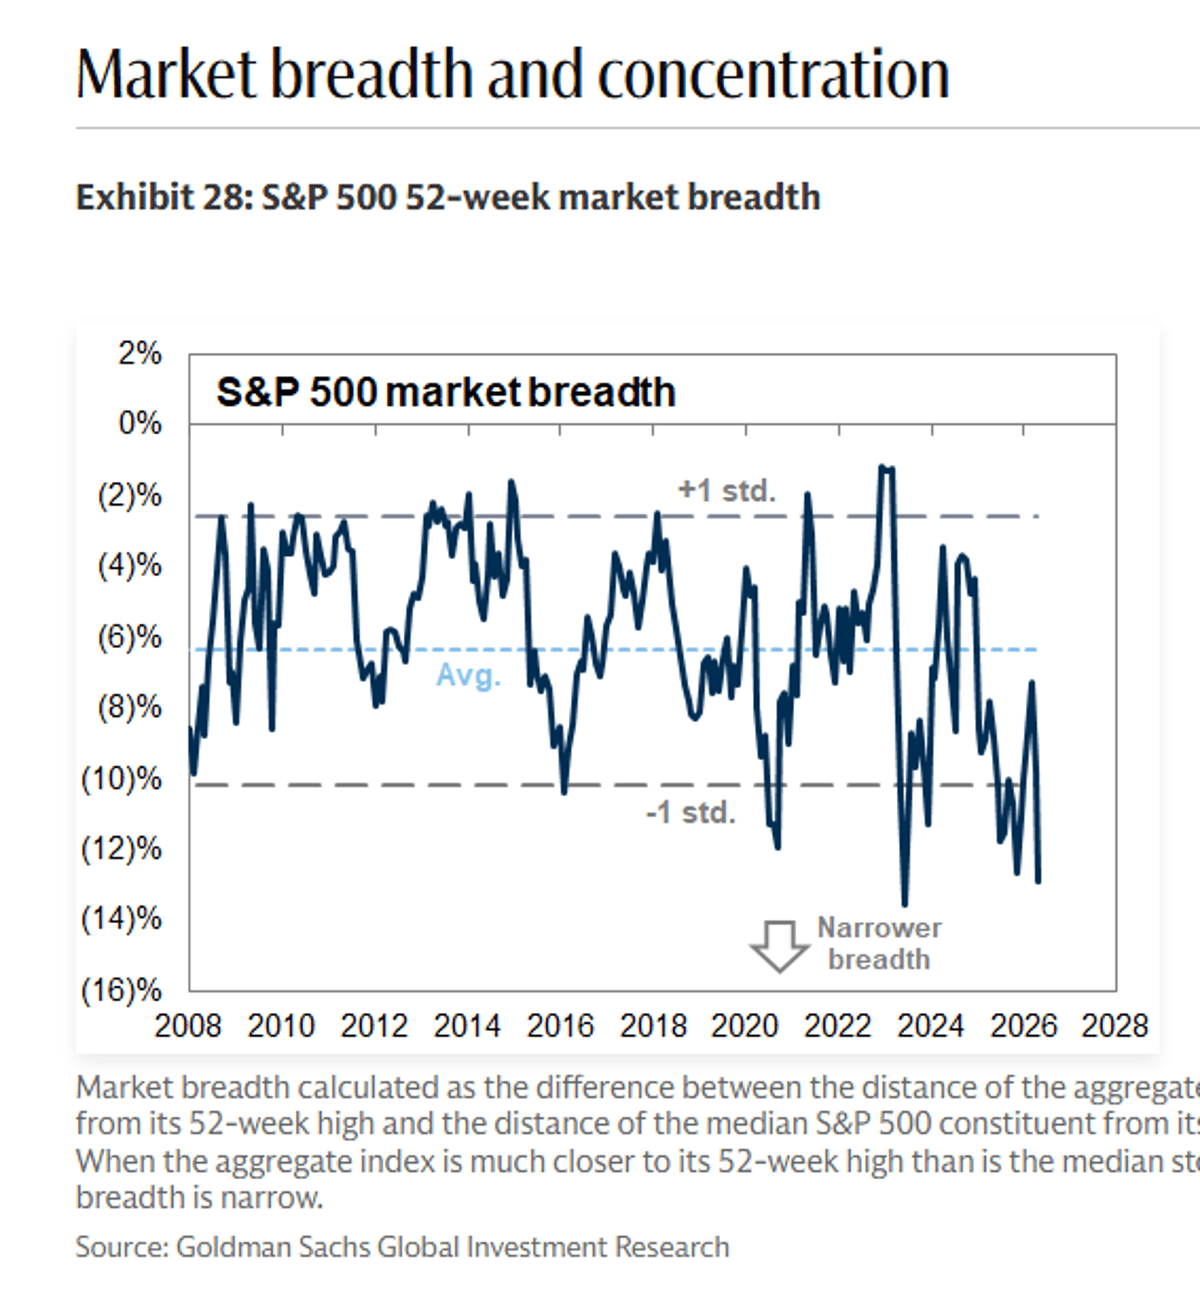
Tech Rebounds as Median S&P Lags Record Highs
This measure shows that the median S&P 500 stock is far below its 52wk high, while the Index is at a record. Practically, it points to major sector rotation in the last 3 weeks, with tech stocks coming storming back.. while Q1 winners lag. https://t.co/1T3Q6Z9EpA
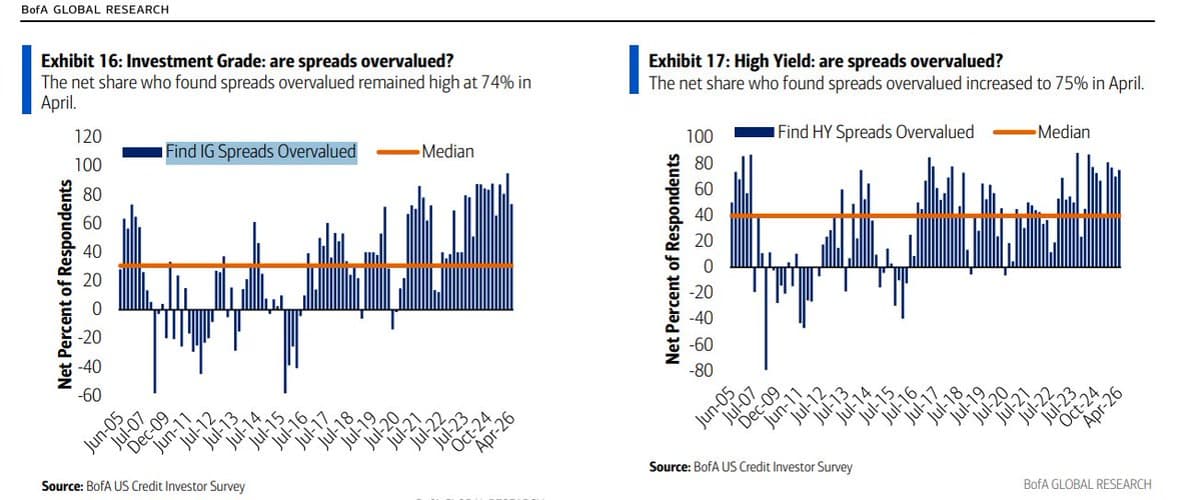
Most Bond Investors See Credit Spreads Overvalued, BofA Says
BofA: The large majority of bond investors think credit spreads are overvalued $LQD $HYG https://t.co/Q8Lsx1wWCz

SPX Beats 2025 High, Yet Valuation Is Cheap
SPX has soared above its October 2025 price peak, but its P/E ratio is way lower now.
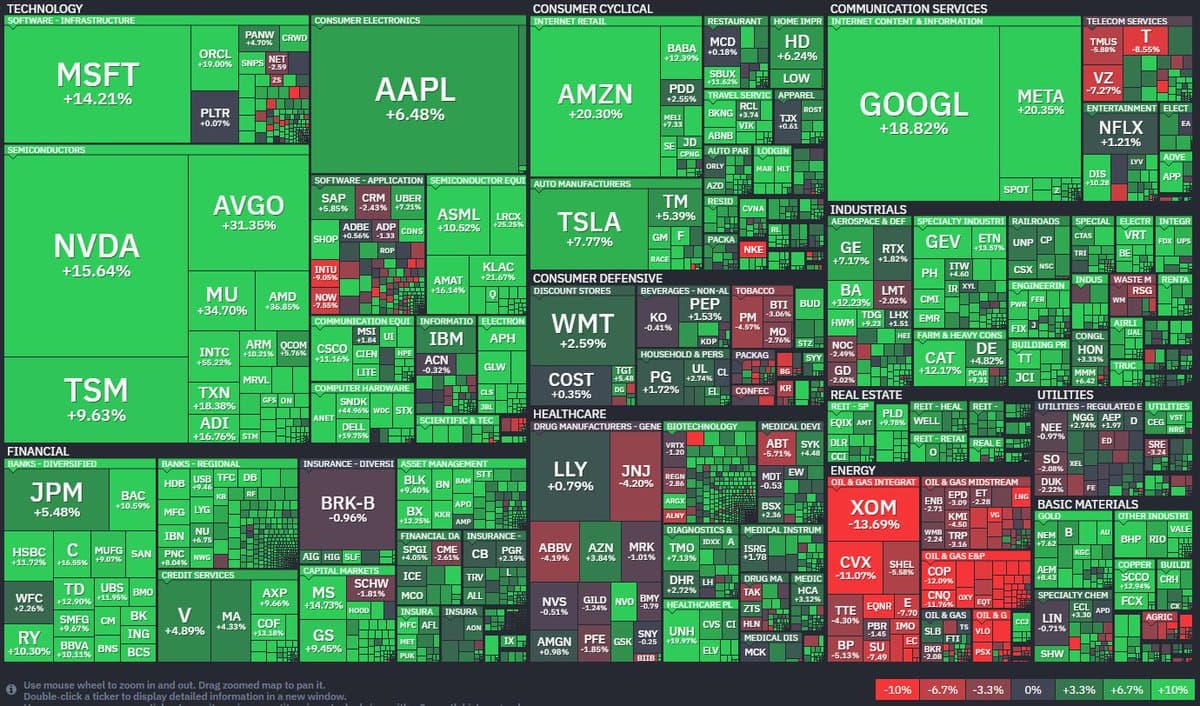
Tech Leads Rally as Few Stocks Hit 52‑Week Highs
You can look at the market's rally to new highs in a couple ways: 1) Less than 10% of stocks at 52wk highs 2) Tech has resumed its leadership (sector rotation), and is in the early innings of the next leg higher Here's...

Doubt the P/E? Go All‑In, It Pays
Reliable contrarian indicator: When replies to my S&P 500 P/E ratio charts are littered with doubts about the "E"... go ALL IN stocks... ...worked again at the bottom of the Iran War correction.
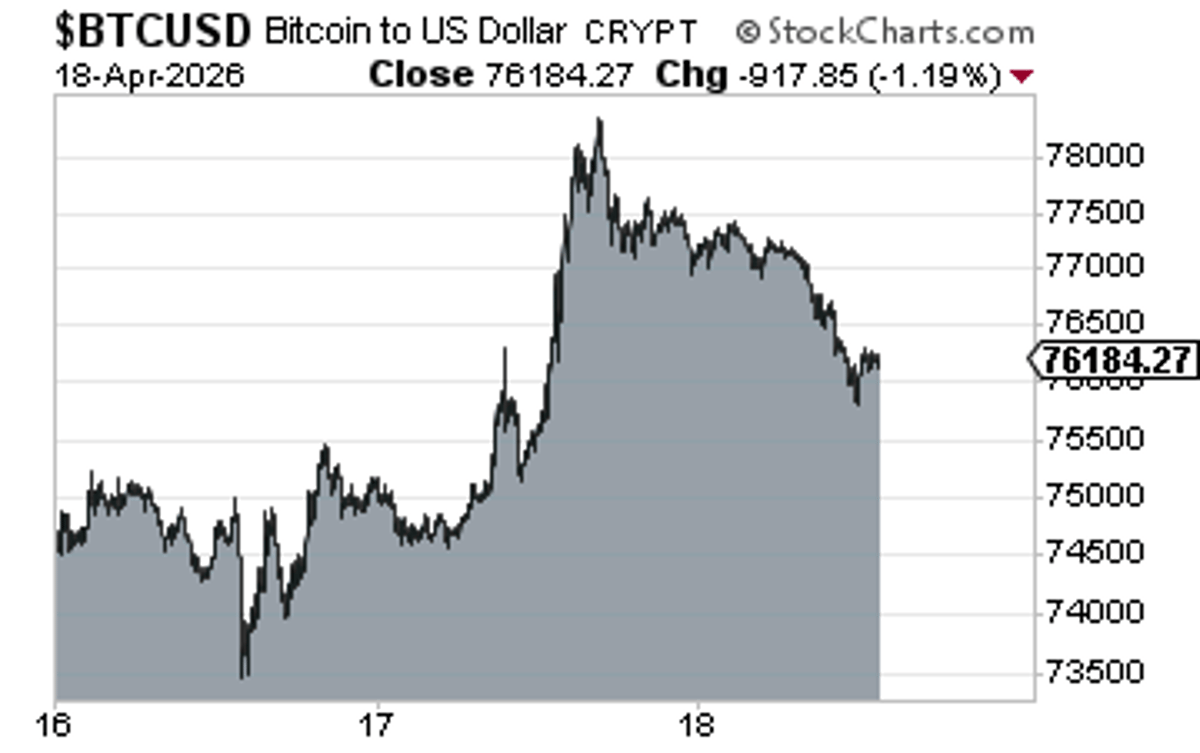
Bitcoin Dips From $78k as S&P Falls 0.7%
Bitcoin tagged $78k yesterday afternoon... back near $76k this morning with the S&P 500 indicated -0.7% on Hyperliquid https://t.co/pQaMStK8bv

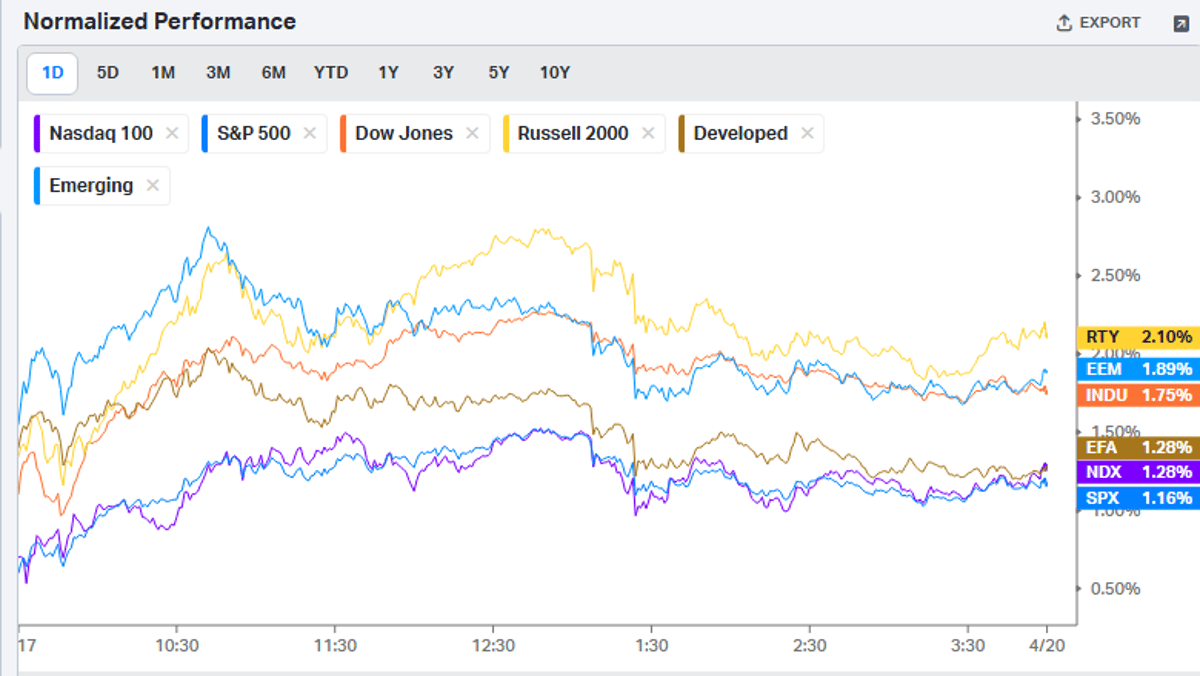
Small, Mid, and International Stocks Validate Record SPX
But small caps, mid-caps, and ex-US all confirm the record-high weekly SPX close... not bad, right?
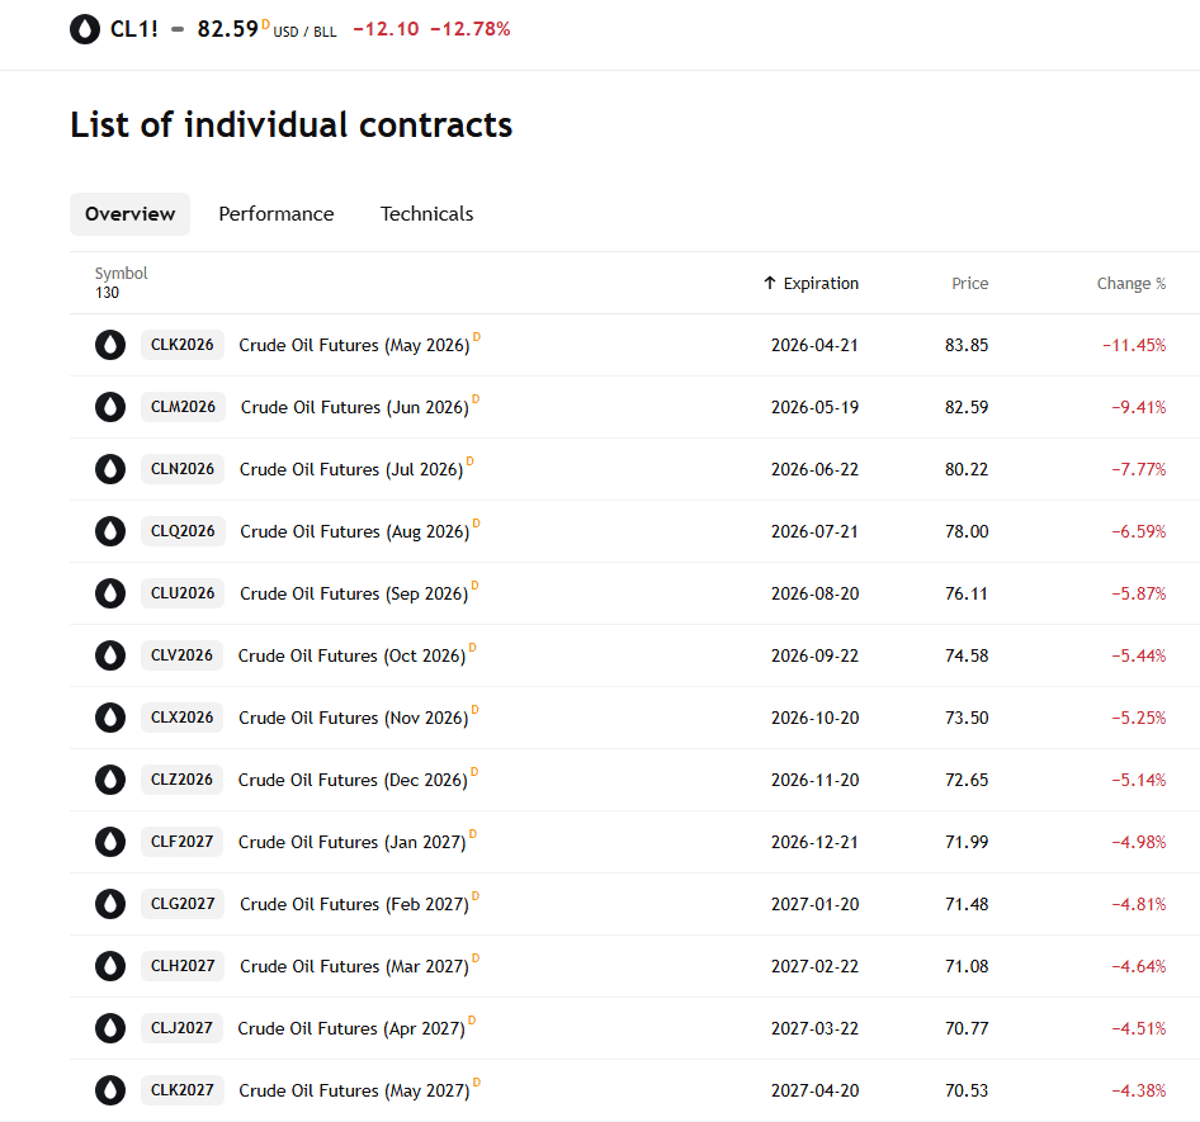
Winter Oil's -5% Slide Is a Significant Move
Heard some folks assert that later-dated oil wasn't down as much as the prompt. Well, of course.. you'll almost NEVER see 6-month and beyond contracts change as much as the front month. In reality, -5% on winter oil is a large move....
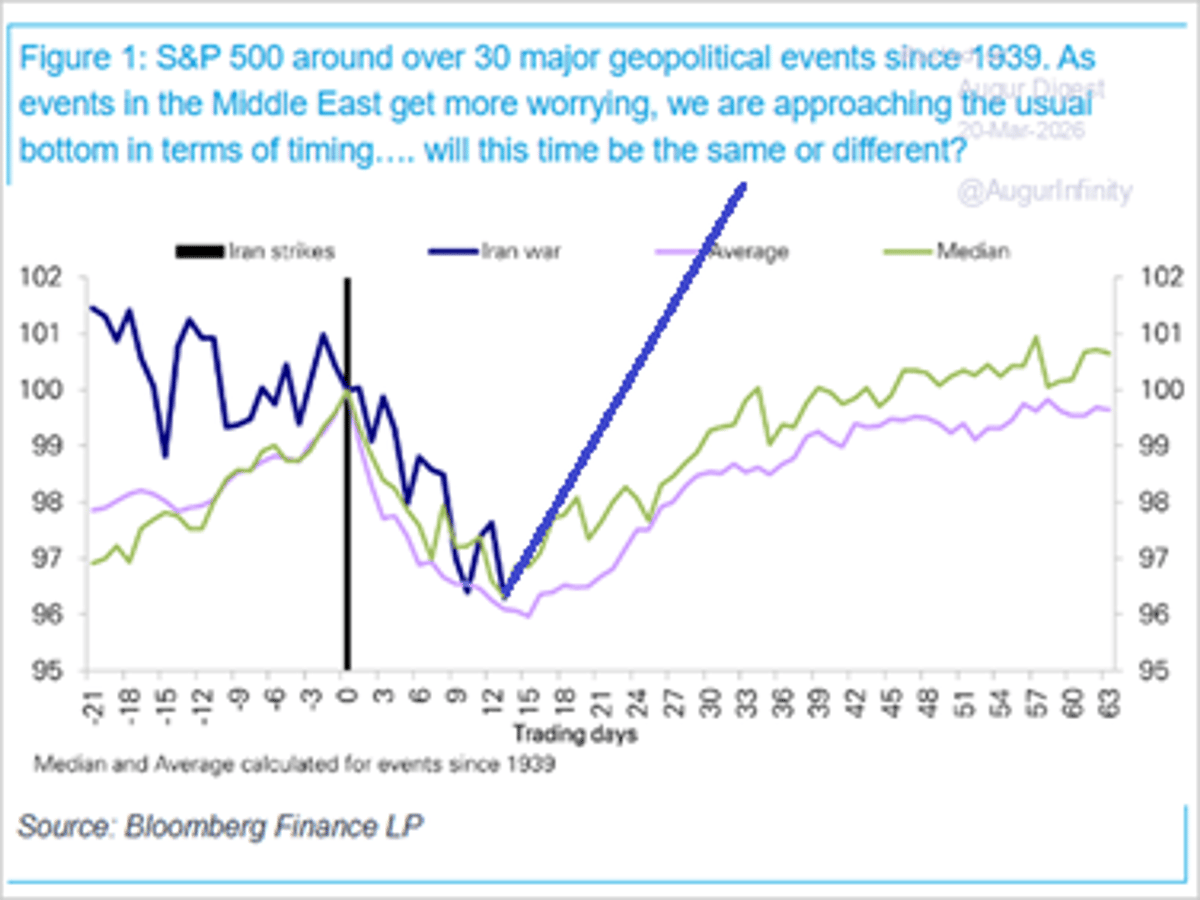
S&P 500 Typically Hits Bottom 15 Days Post‑crisis
Wow, this played out like a charm... Historically, the S&P 500 bottoms 15 trading days after a geopolitical event begins, DB. @soberlook I took some chartistic liberty with the Iran War price update... https://t.co/J5VDwJc2MK
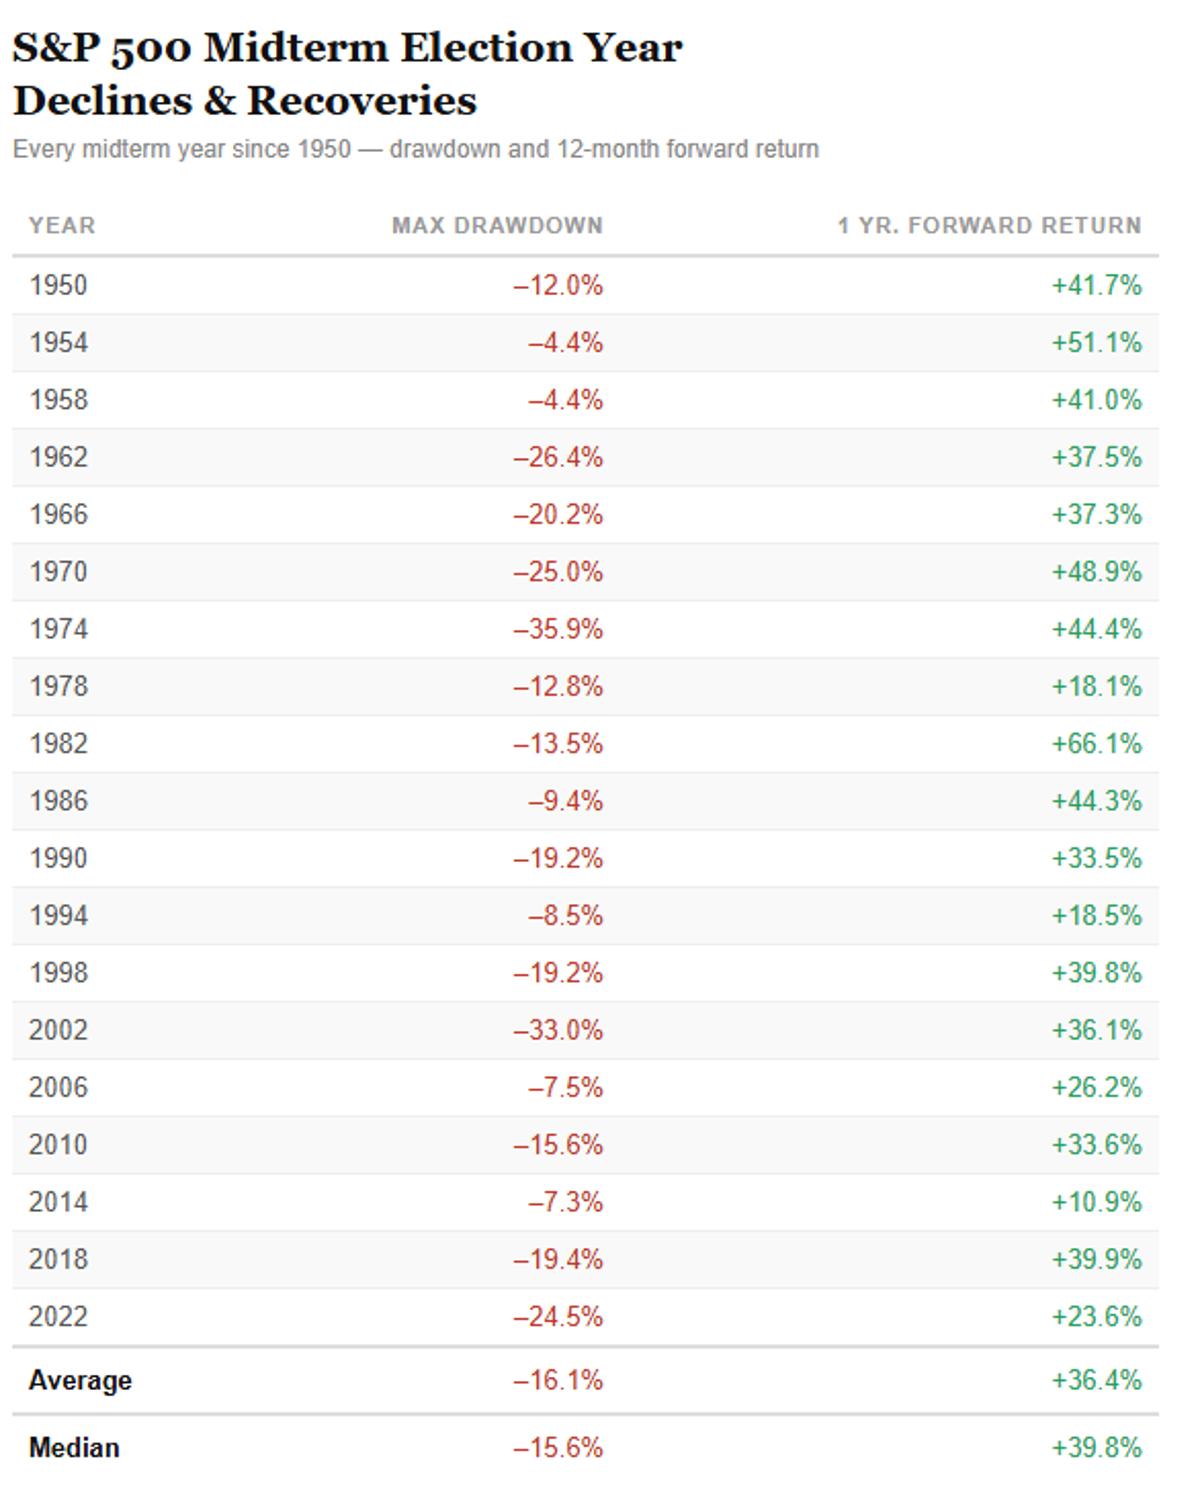
Current Dip Still Shy of Historic Median Drawdown
The median midterm year drawdown is 15.6% .. S&P 500 1950-2022 Well, we got to -9.1% on the daily chart https://t.co/3tQDvp8ipA
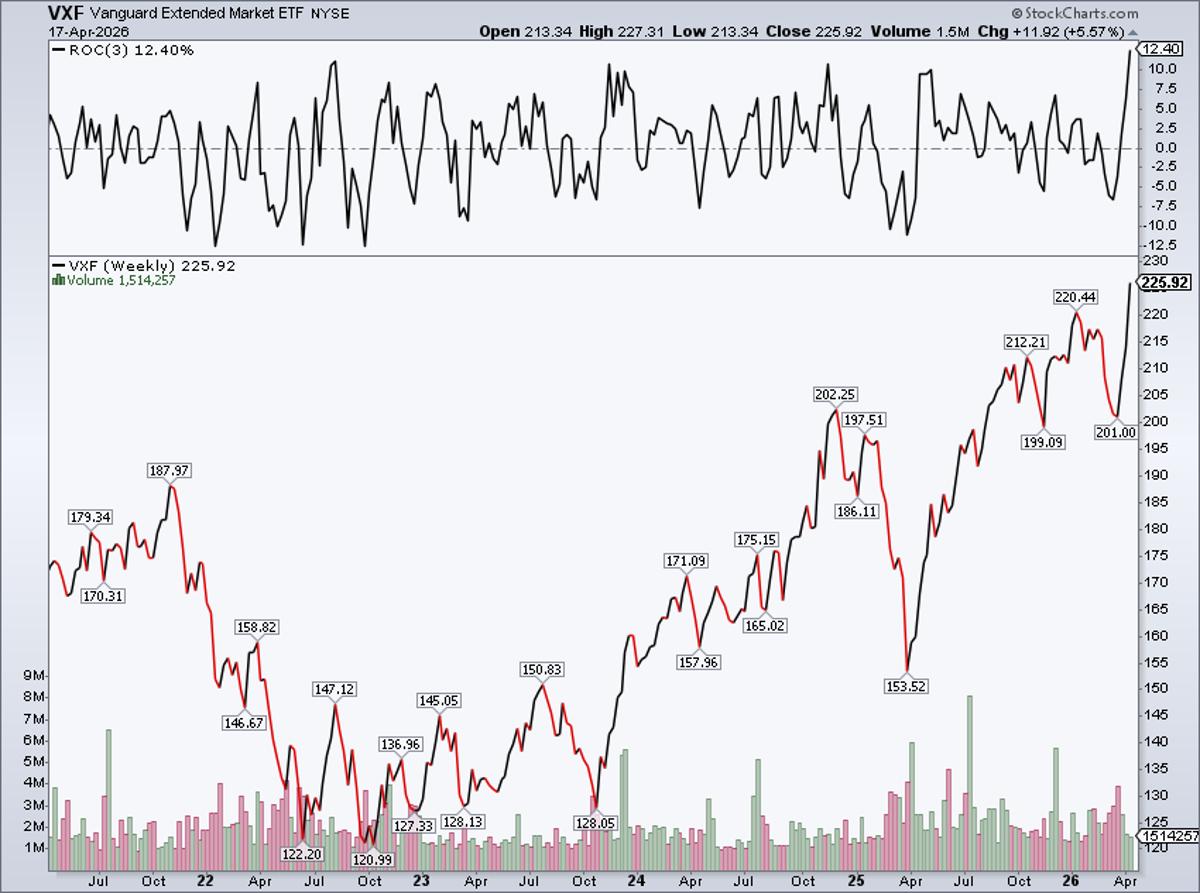
US Extended Market ETF VXF Gains Record 12.4%
And, along with SPX and ACWX, the US Extended Market ETF $VXF (all US stocks not in the S&P 500) also tallied a record yesterday @stockcharts +12.4% last 3 weeks @michaelsantoli https://t.co/kYignTZhOc
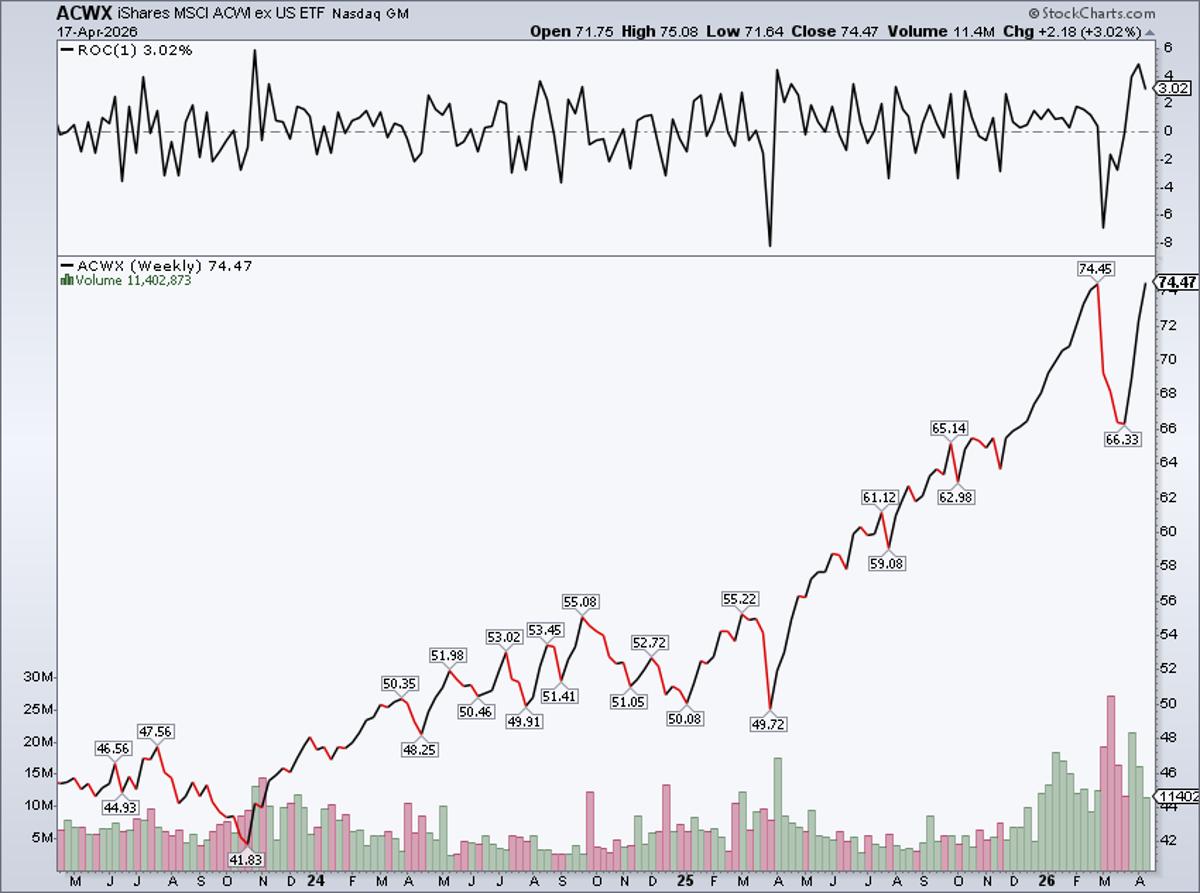
International Stocks Surge 12.3% in Three Weeks
Oh, international stocks printed a record weekly close yesterday too.. didn't even notice.. $ACWX Best 3-week thrust since 2020 +12.3% https://t.co/3ithcwEVPp
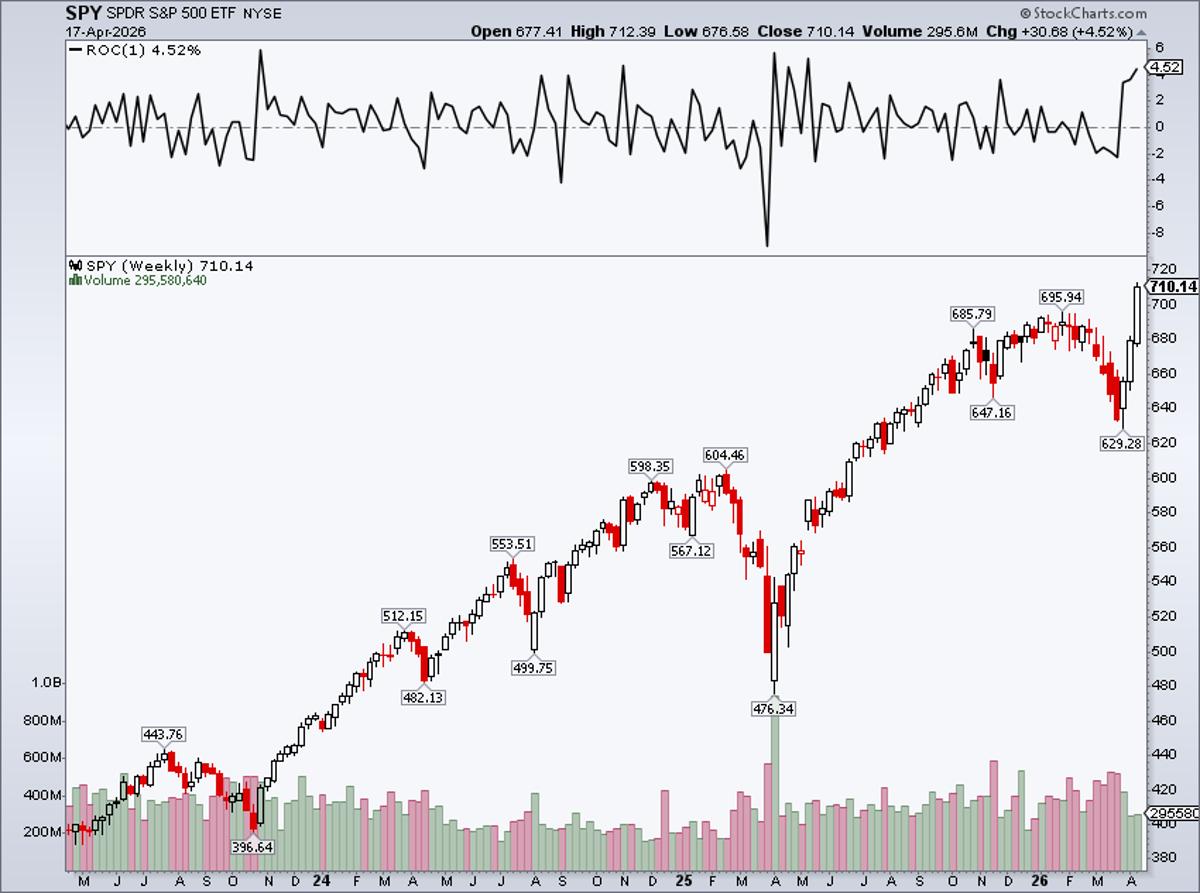
S&P 500 Defies Doom, Posts 4.5% Bullish Surge
Remember all the Weekend Wall Street, IG, and Hyperliquid doom-quoting last weekend? Yeah, the S&P 500 went on to have one of its best weeks of the bull market. $SPY +4.52% Record high, negating the bearish rounded-top pattern.. completing a bullish...
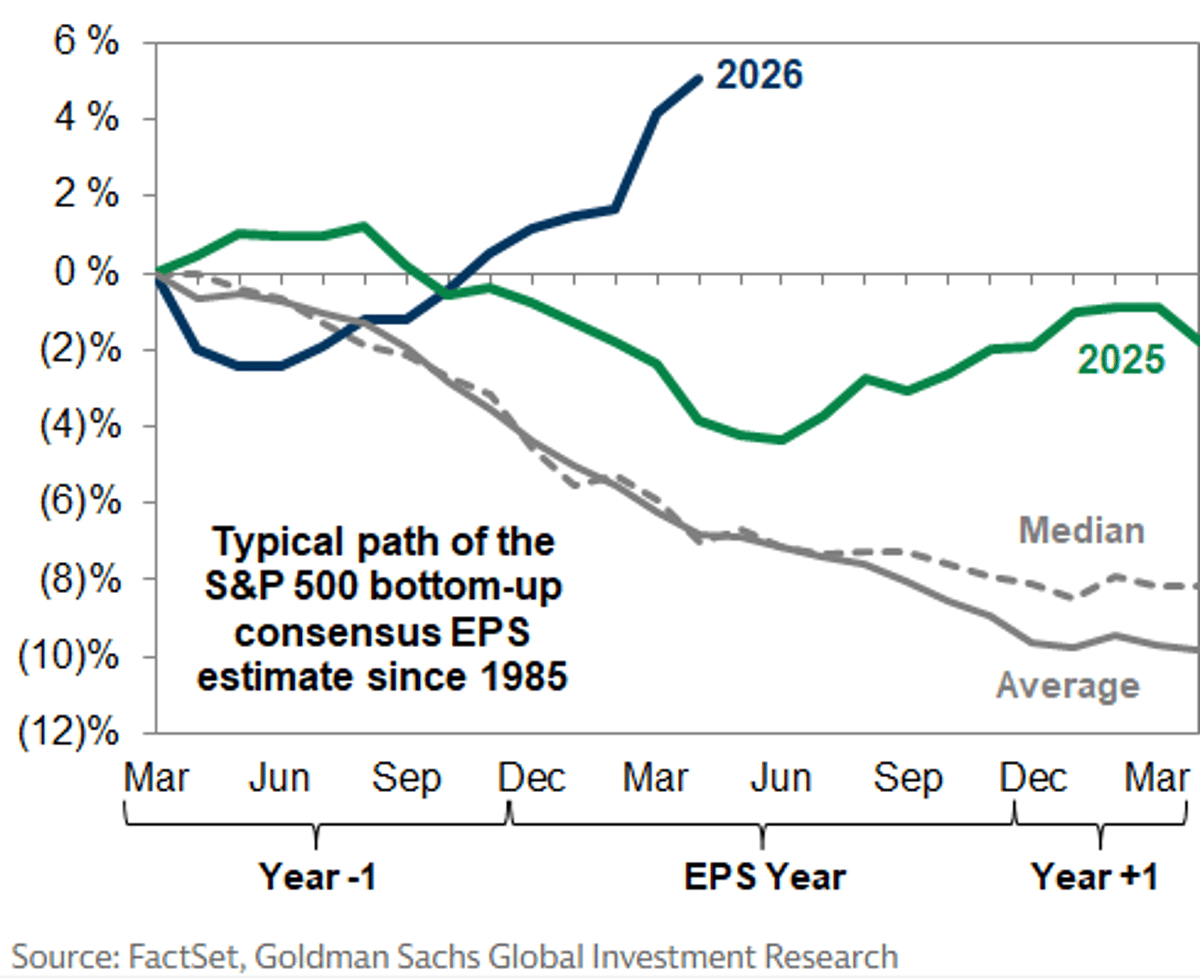
2026 EPS Forecasts Break From Consensus Revision Trend
GS: 2026 EPS estimates have diverged from the typical path of consensus estimate revisions https://t.co/4CP8mSU3mS
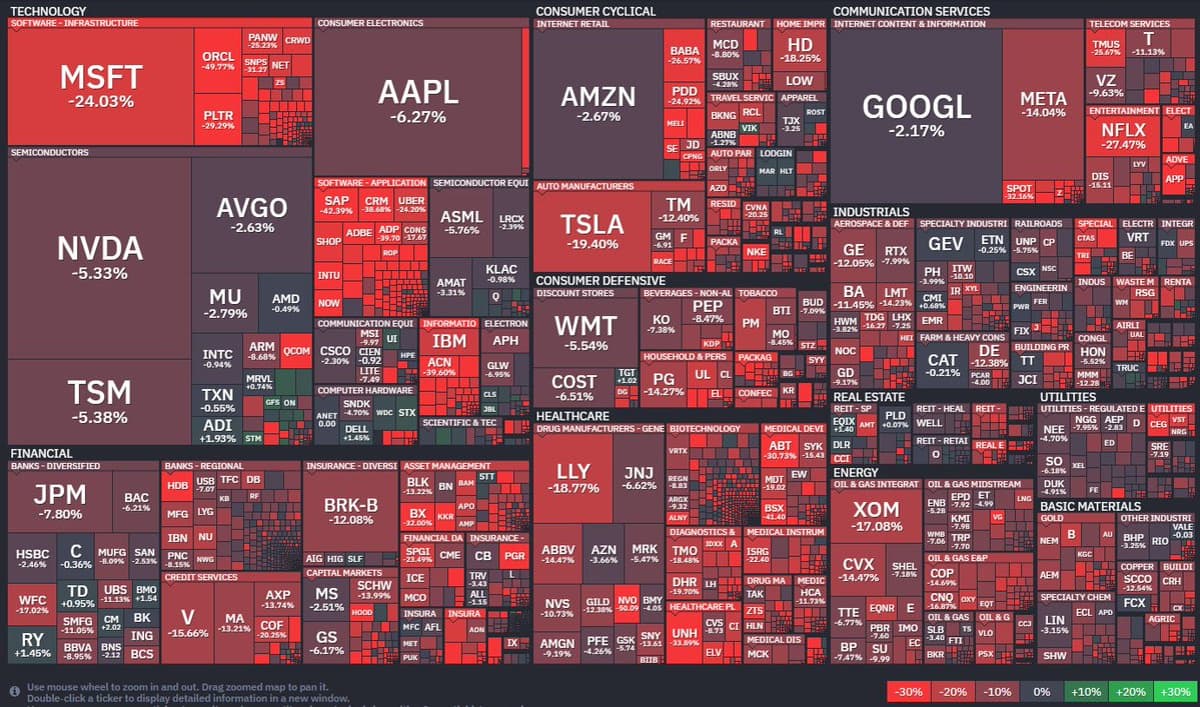
Record Markets Hide Significant 52‑Week Drawdowns
As the stock market reaches new records, here are the current drawdowns from 52-week highs underneath the surface... Hint: this is a normal look @finviz_com https://t.co/5HKxQKV6ht
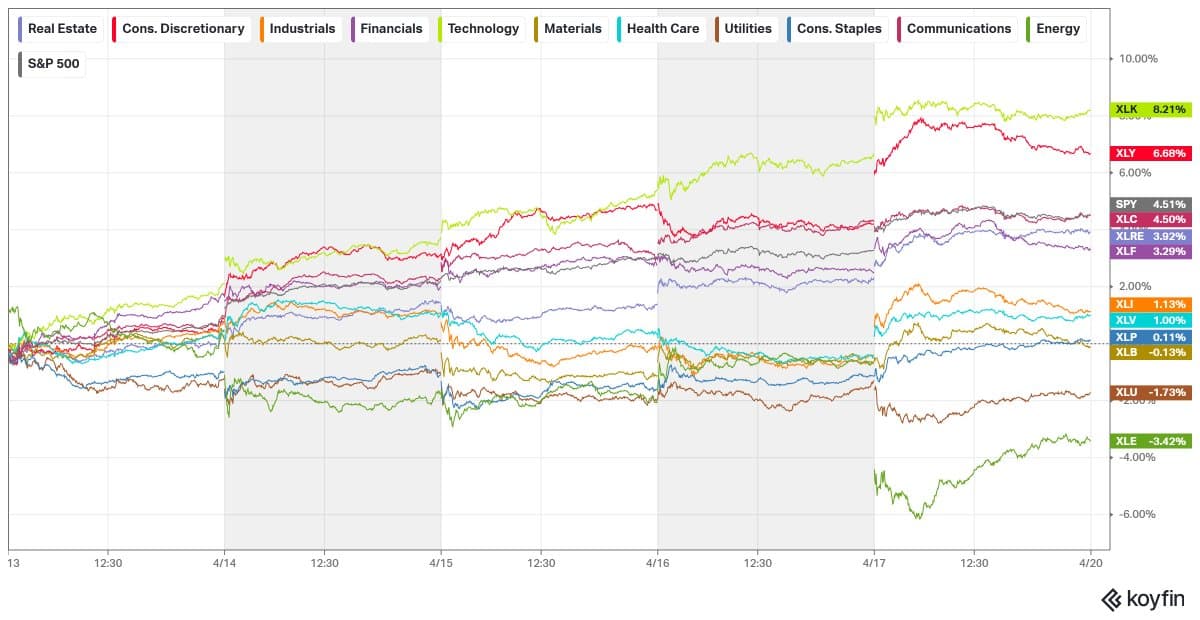
Resources Lag; only XLK, XLY Outpace S&P
Resource stocks $XLE $XLB were down this week While only $XLK and $XLY beat the S&P 500 $SPY https://t.co/NbqvDTt6rQ
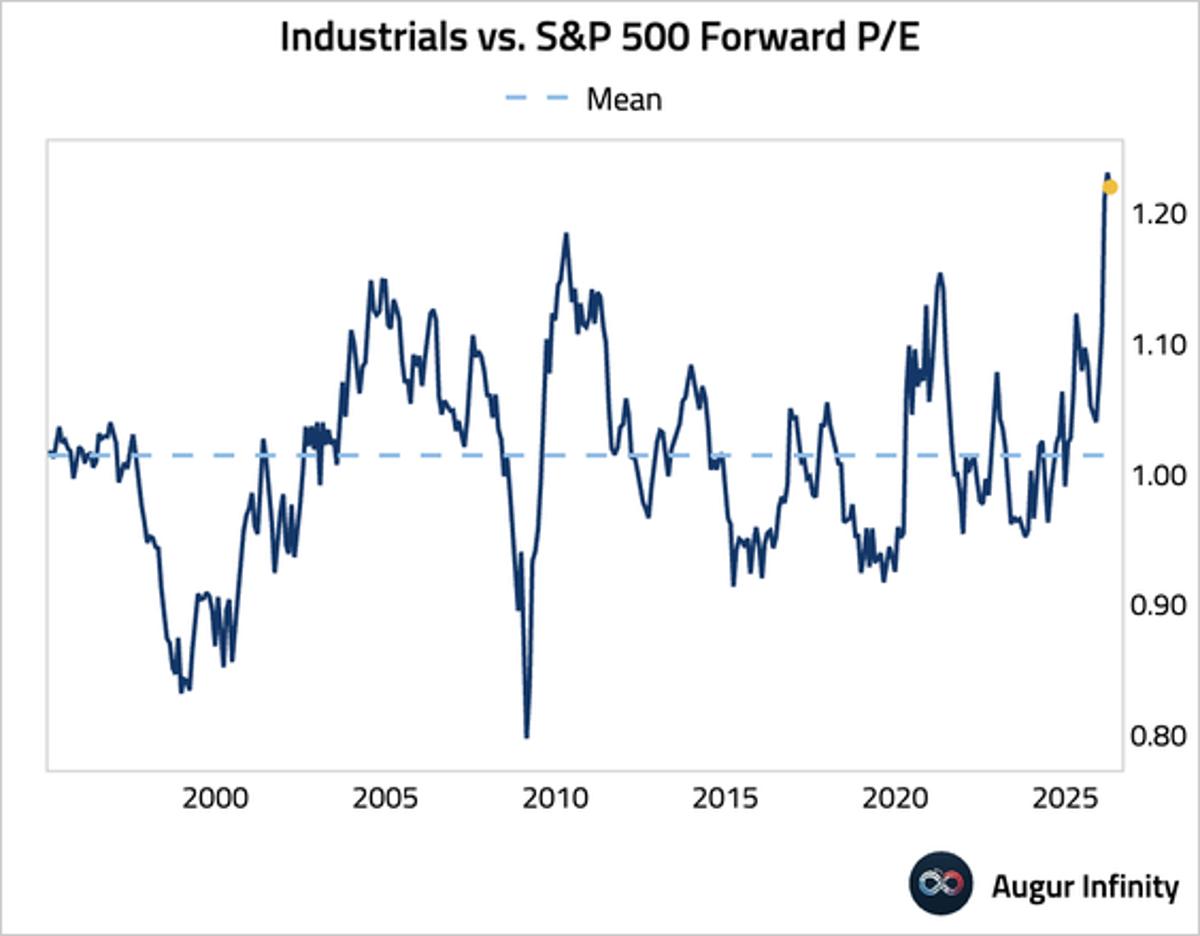
Industrials Forward P/E Near Record Highs vs Market
The forward P/E of the industrials sector relative to that of the broader market remains near record highs. ty @augurinfinity https://t.co/XZoDHelWSz https://t.co/doqKhFeI1Y
Market Appeared Set to Drop,
Looked like we might sell off into the close, but it was really just flat 130pm-4pm https://t.co/wPYLDl6exR
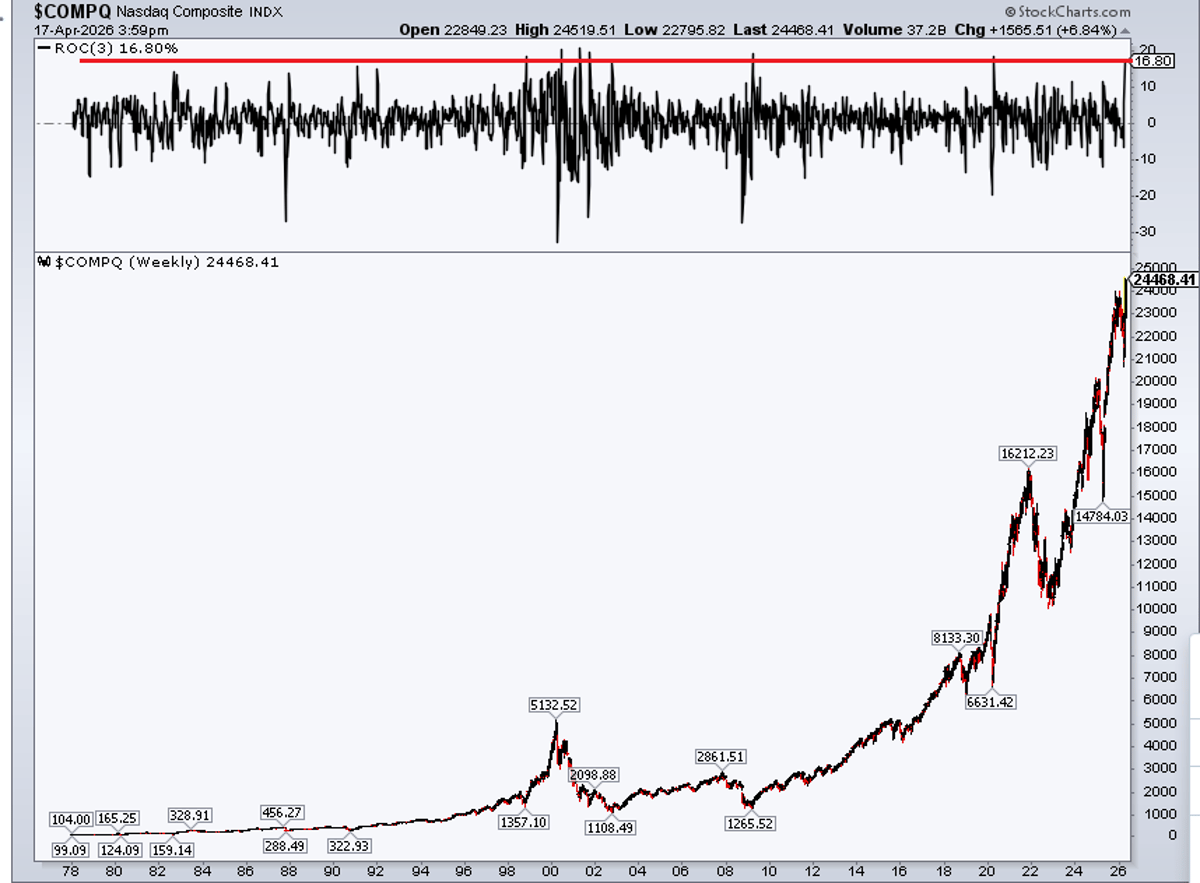
Nasdaq's 17% Surge Near Historic Rally Benchmark
Nasdaq Composite +17% over the last 3 weeks... that's not far from its best-ever rally (since the 1970s). Since the dot-com bubble/bust, only 2008 and 2020 saw larger surges. https://t.co/aQKLdMsoFU
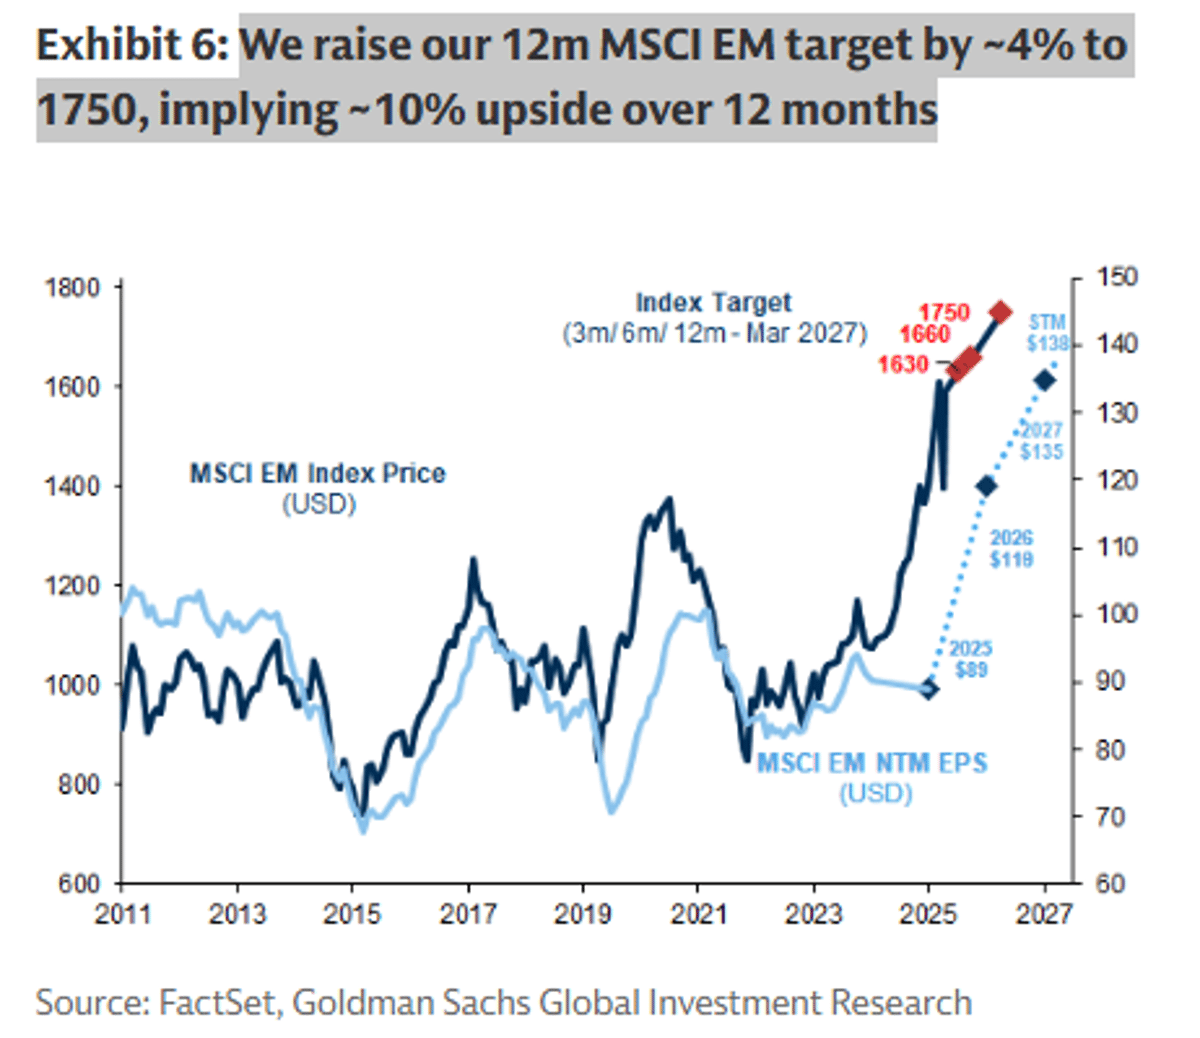
Goldman Sachs Boosts MSCI EM Target, Forecasts 10% Upside
GS: We raise our 12m MSCI EM target by ~4% to 1750, implying ~10% upside over 12 months $EEM $VWO https://t.co/Yxz4w8EPPv
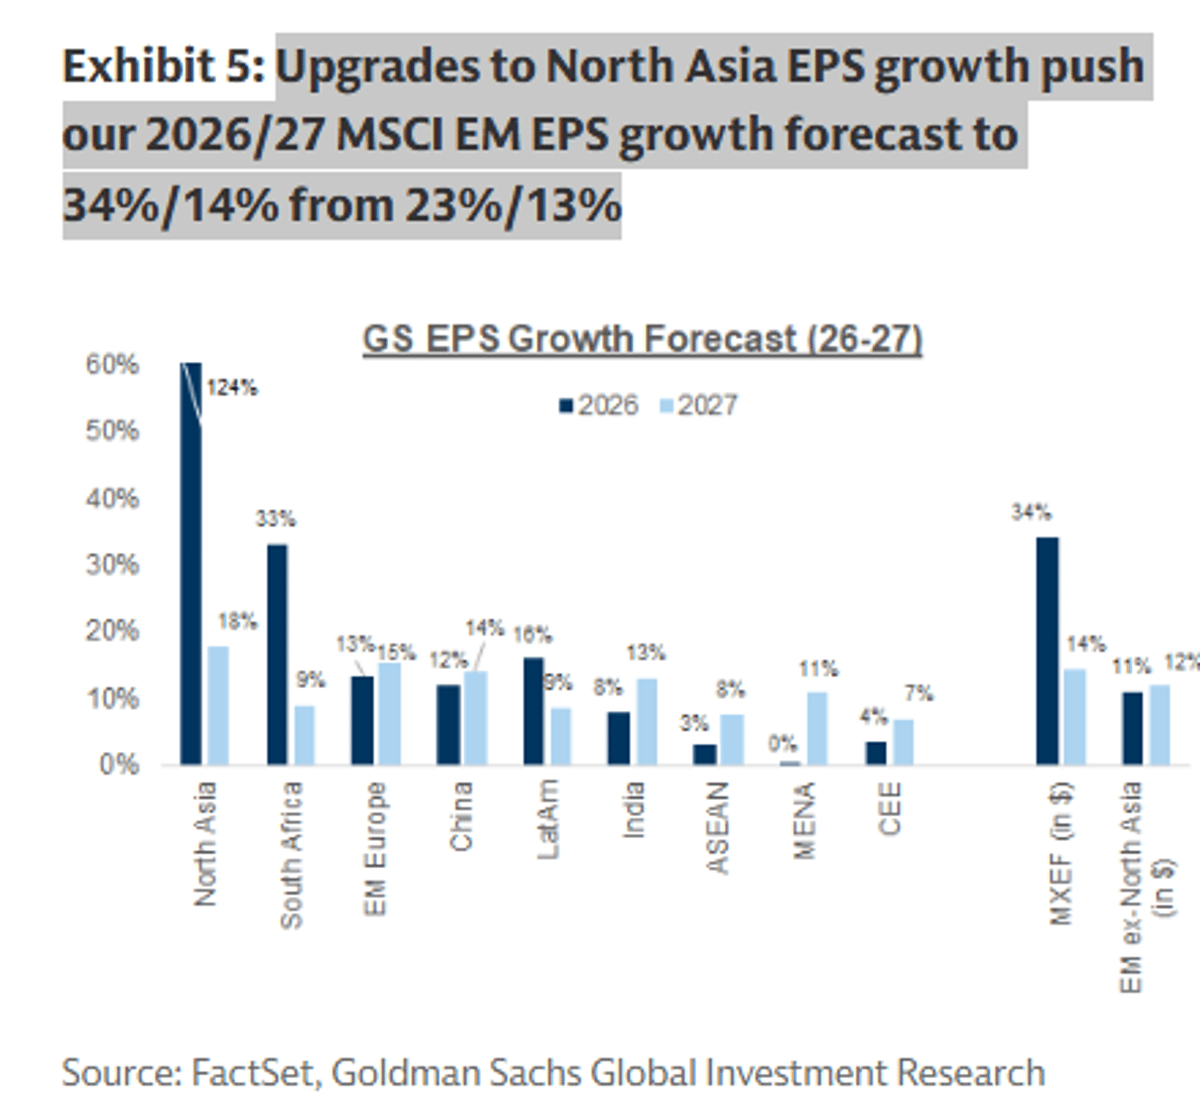
North Asia EPS Upgrade Raises MSCI EM Forecast
GS: Upgrades to North Asia EPS growth push our 2026/27 MSCI EM EPS growth forecast to 34%/14% from 23%/13% https://t.co/jK4UGxp0LY
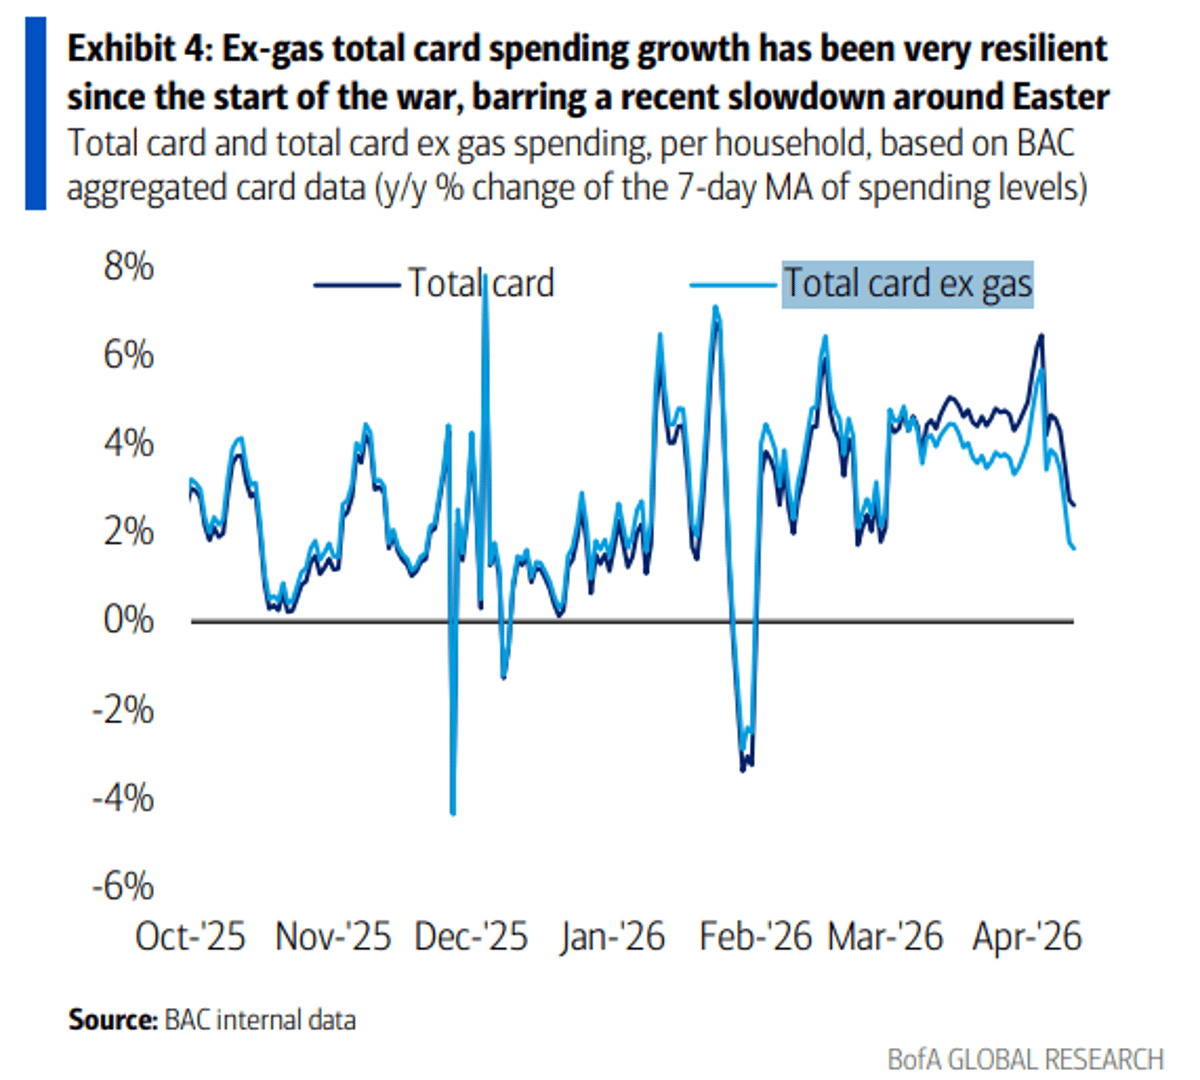
Card Spending Growth Remains Resilient Amid War, Easter Dip
BofA: Ex-gas total card spending growth has been very resilient since the start of the war, barring a recent slowdown around Easter https://t.co/LKgjpddqKj
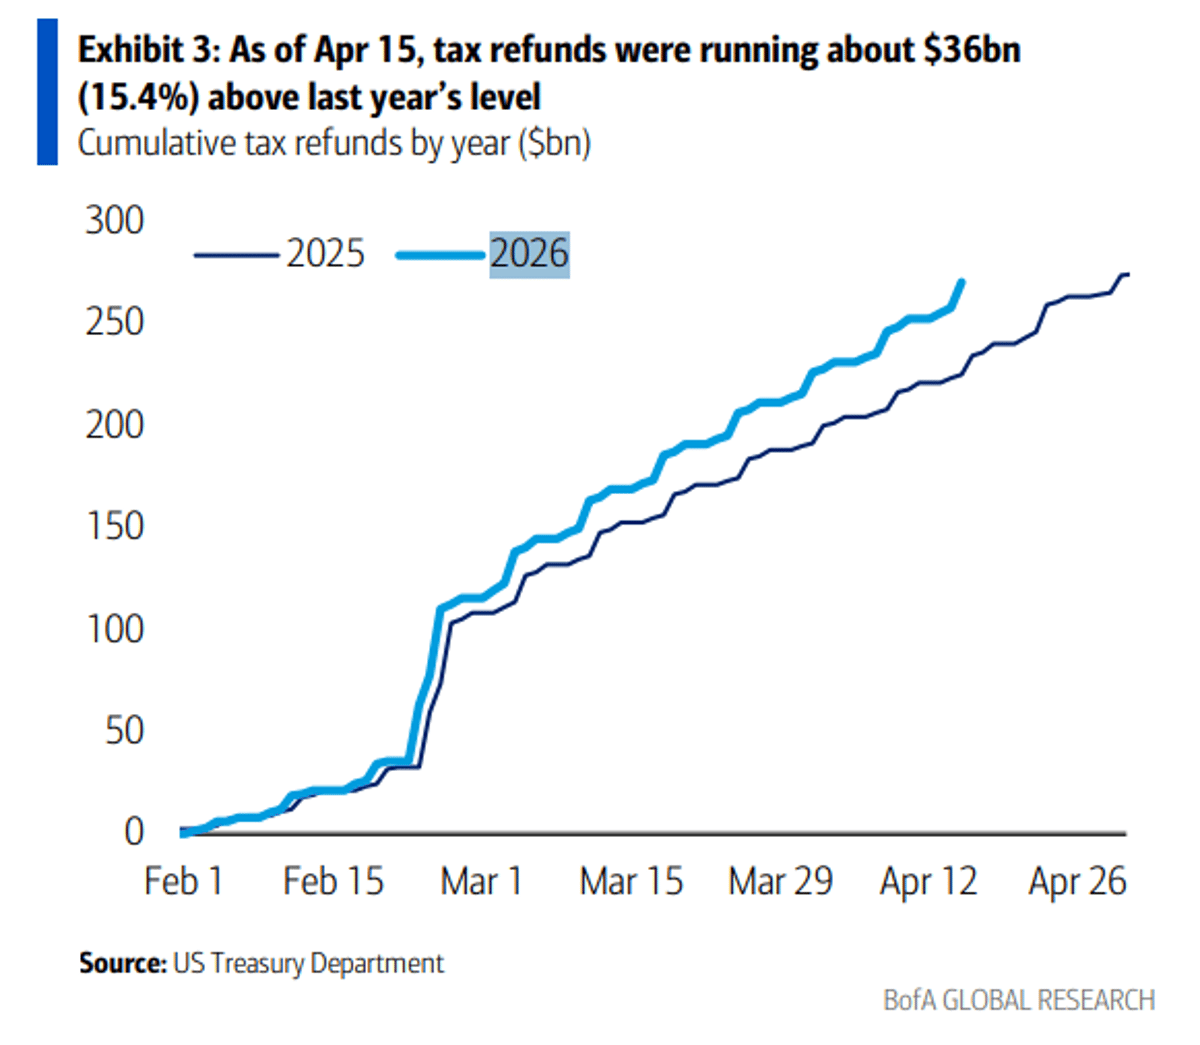
Tax Refunds Surge 15% YoY, Up $36 Bn
BofA: As of Apr 15, tax refunds were running about $36bn (15.4%) above last year’s level https://t.co/mPjzrL4Dmr
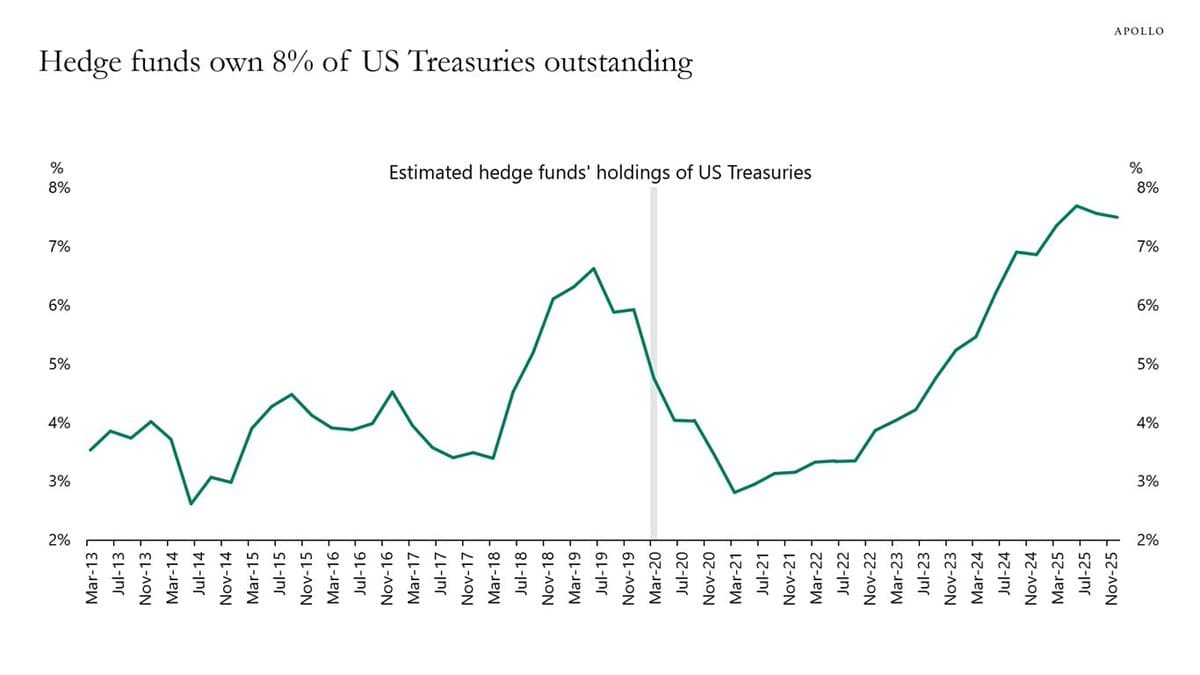
Record Treasury Leverage Threatens Global Fixed‑Income Stability
Hedge Fund Leverage in Treasuries at Record Highs. Torsten at Apollo ...any forced unwinding of these leveraged positions could send shockwaves through global fixed-income markets. https://t.co/vtq5KWmWLE
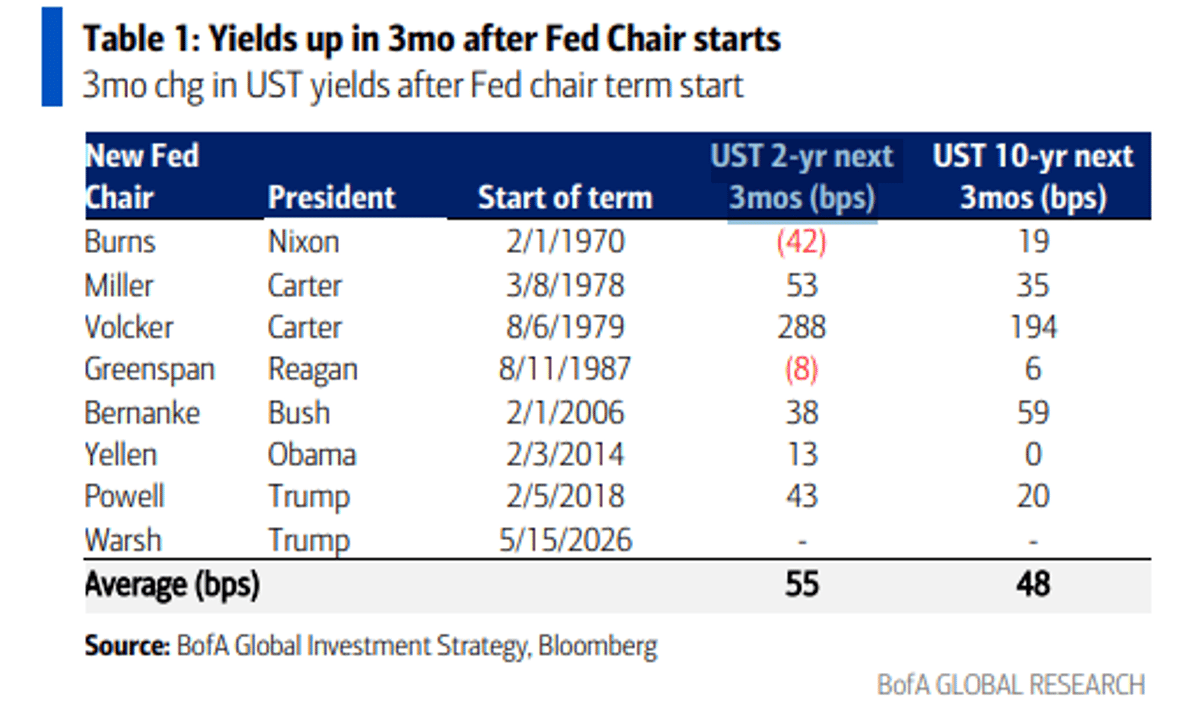
Yields Spike Three Months After New Fed Chair Takes Office
BofA Hartnett: Market usually tests a new Fed chair... Yields up in 3mo after Fed Chair starts https://t.co/zn2zh9y9nl
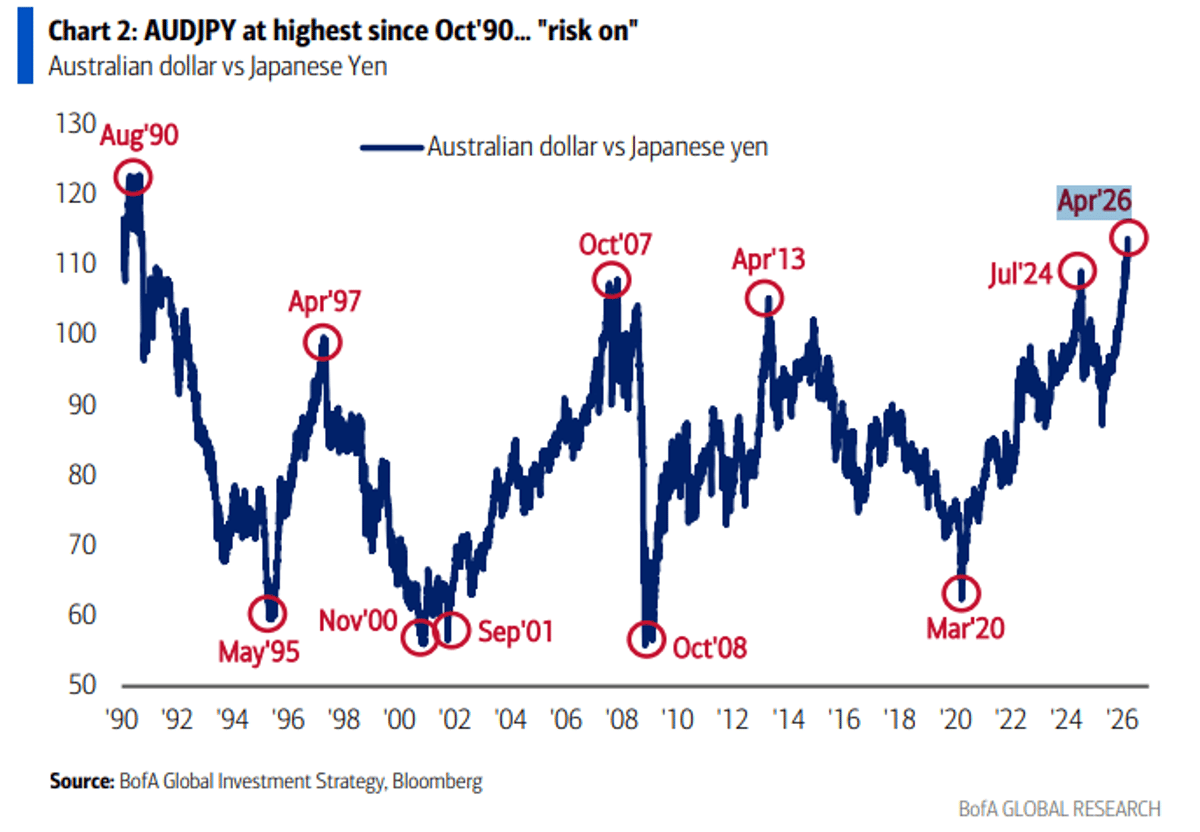
Aussie Dollar Hits Highest Yen Level Since 1990, Signaling Risk‑On
BofA Hartnett: nothing says risk-on more than Aussie dollar (cyclical FX) at highest levels vs. Japanese yen (funding FX) since Oct'90 https://t.co/5Xbt4PwZjW
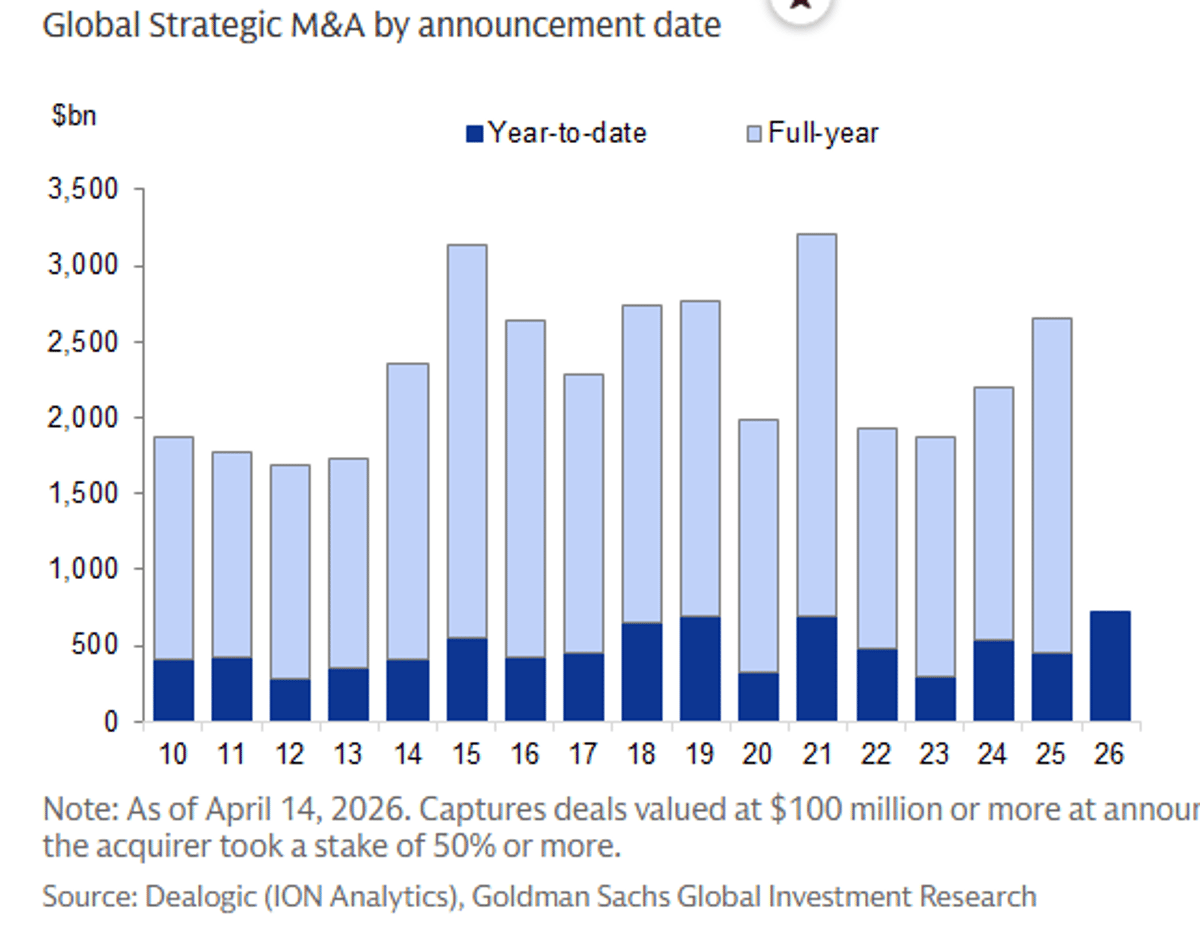
Global Strategic M&A Hits $718B, Beating 2021 Record
GS: Global strategic M&A volumes total $718 billion so far this year—already outpacing the prior record of 2021 https://t.co/jHjx8NpER8

Nasdaq Repeats 12
The Nasdaq Composite's previous 12-day winning streak was July 2009... when the index was 1,800 It's now 24,100 @stockcharts https://t.co/txZ4yNtz7B

Only Tech and Real Estate ETFs Hit 52‑Week Highs
Tech $XLK and Real Estate $XLRE are the only two S&P 500 sector ETFs at 52wk highs @koyfincharts https://t.co/ZA4h2oCHD2

VIX Dips Below 18, S&P Eyes Sixth Record High
$VIX back under 18 as the S&P 500 is poised to notch its 6th record high of the year https://t.co/dTiaN91ynn

Gasoline Futures Hold Strong, AAA Avg Near $4.10
Gasoline future remain bid up pretty well.. $3.15 on RBOB will keep the AAA average near $4.10. https://t.co/frWo9xgFHU

AI Infrastructure to Drive 40% of S&P 500 EPS Growth
GS: AI infrastructure investment should contribute roughly 40% of S&P 500 EPS growth this year https://t.co/wwWV4mxJVo

Tech PEG Ratio Beats Global Market Average
GS: The PEG ratio for technology is below that of the global aggregate market https://t.co/IXaYKIWChU

Tech's 50-Year Return Slump Ends After Long Drought
GS: one of the weakest periods of relative returns for technology over the past 50 years ... well, up until recently https://t.co/nPi8WR2wqm

Not All Price Gaps Get Filled; Beware the Myth
"I’d caution traders not to fall in love with the misconception that “all gaps get filled.” The reality is some do, but others don’t (see April–May 2025 as a case in point)." More from me on @stockcharts: https://t.co/4cER6C7dmo https://t.co/A7buYOF4bO

Qual and Value Weakening Signals
$QUAL $VLUE beginning to weaken on the RRG Just what you want to see in a risk-on, V-bottom rally.. More from me on @stockcharts: https://t.co/u7Cbde3p2W https://t.co/r3xabtQepn

Claude’s $20 Plan Hits Limits on Simple Queries
$20/mo Claude plan: Me: "What should I have for dinner?" Claude: "Steak." (You have reached your weekly limit)

SOXX Posts 29% Gain, Best 24‑year Rally
$SOXX +29% last 11 days.. best rally in 24 years More from me on @stockcharts https://t.co/4cER6C7dmo https://t.co/bwzdKb6wNM

Stocks Hit Record Peaks as Sentiment Hits Record Lows
It's official: Stocks are at all-time highs, while consumer sentiment is at an all-time low

Extended Style Box Shows Significant Red Sector
Actually quite a bit of red on the @stockcharts Extended Style Box I wrote about it today: https://t.co/4cER6C7dmo https://t.co/wXtiLeDXUh

Tech Rallies, Transport Slumps: Nasdaq’s Best Day Since 2023
After a steep decline, Nasdaq Comp vs Dow Transports is just about having its best day since early 2023... bullish reversal favoring tech at the expense of the 'real' economy? @stockcharts $COMPQ $TRAN https://t.co/3GneL22l5O

V‑Bottom Returns: Stocks Surge While Quality Lags
V-Bottom Strikes Again: Stocks Soar as Quality Lags As the S&P 500 hits a record, I assess how far we've come... and where equities may be headed @stockcharts https://t.co/4cER6C7dmo https://t.co/oo4msWOBBK

XLK Tech ETF Near Best Month Since July 2022
$XLK Tech ETF very close to its best month since July 2022 +12.7% so far https://t.co/X2dxwjXheF
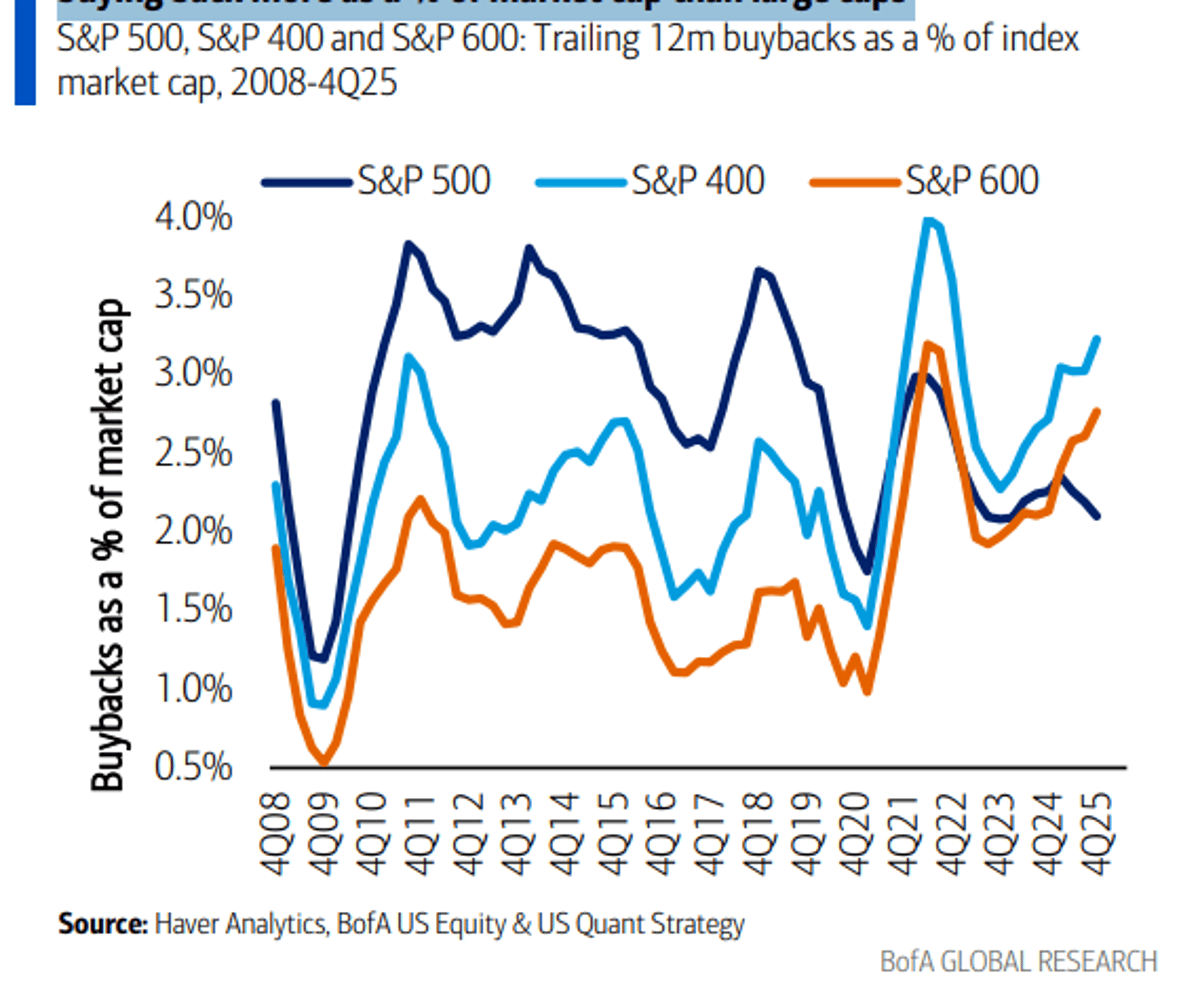
Small and Mid Caps Outpace Large Caps in Buybacks
BofA: small caps (in addition to mid caps) are now buying back more as a % of market cap than large caps https://t.co/ynbYTmLXzy
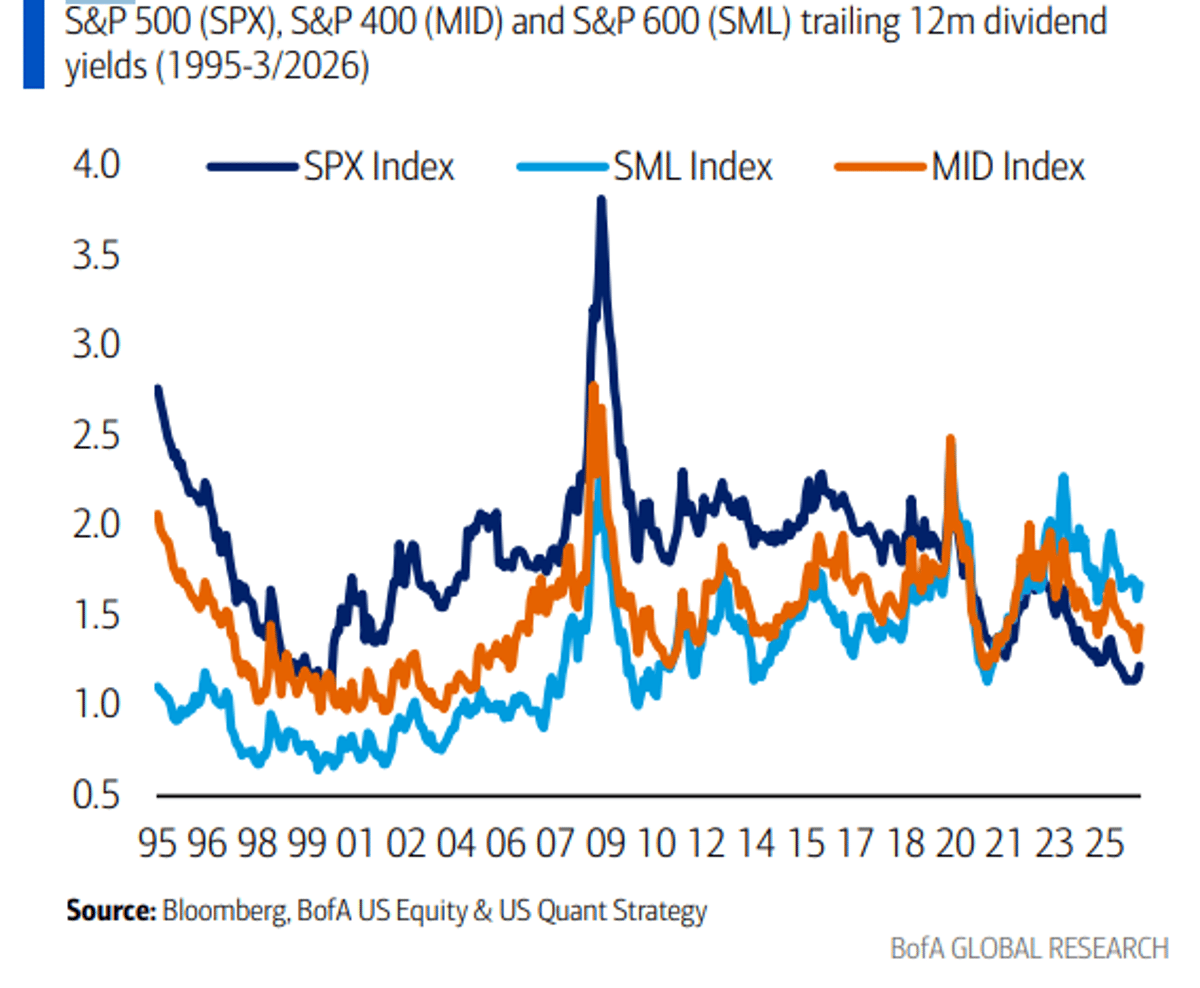
Small and Mid‑Cap Yields Surpass Large Caps
Asset location implications: Dividend yields are now higher in small and mid caps vs. large caps https://t.co/UPCV1LiXSB

Energy Giants Plunge, Tech Stocks See Modest Pullbacks
Current drawdowns from 52wk highs.. $AMZN -3.6% $GOOGL -4.7% $AVGO -5.6% $NVDA -7.5% $XOM -15.7% $CVX -12.9% https://t.co/XWIU5wCgQt

Quality Factor Weakens as QUAL Underperforms SPY
The quality factor has softened, $QUAL vs $SPY falling below its 200dma. ... More on this tk from me on @stockcharts @soberlook https://t.co/62ONaGmlte

Tech's Share in Credit Indices Surges to 10%
AI Is Reshaping Credit Market Composition Tech’s share of the investment-grade index has risen from 1.9% in 2006 to 10.7% today, with similar gains in high-yield and leveraged loans. Torsten at Apollo $LQD $HYG https://t.co/U1i37ent6D

Diesel Prices Near 2022 Peak, Close to 2008 High
Real diesel price now within 90 cents of the 2022 peak and $1.65 from the 2008 high (using monthly closing prices) @jkempenergy https://t.co/sCJ6D7sfbJ

Food‑at‑home Inflation Set to Jump to 5‑6%
BofA sees Food at Home inflation rising from 2% as of March to 5-6% in the next 6 months https://t.co/sxDL8p533h