State-Level Employment Situation: February 2026
Why It Matters
The broad-based employment pullback signals a cooling labor market that could ease wage pressures and reshape regional economic strategies. Persistent state‑level gaps highlight where policy and investment may be needed to sustain growth.
Key Takeaways
- •U.S. nonfarm payrolls dropped 133,000 in February 2026.
- •36 states recorded job losses; only 14 saw gains.
- •Construction sector shed 13,000 jobs nationwide in February.
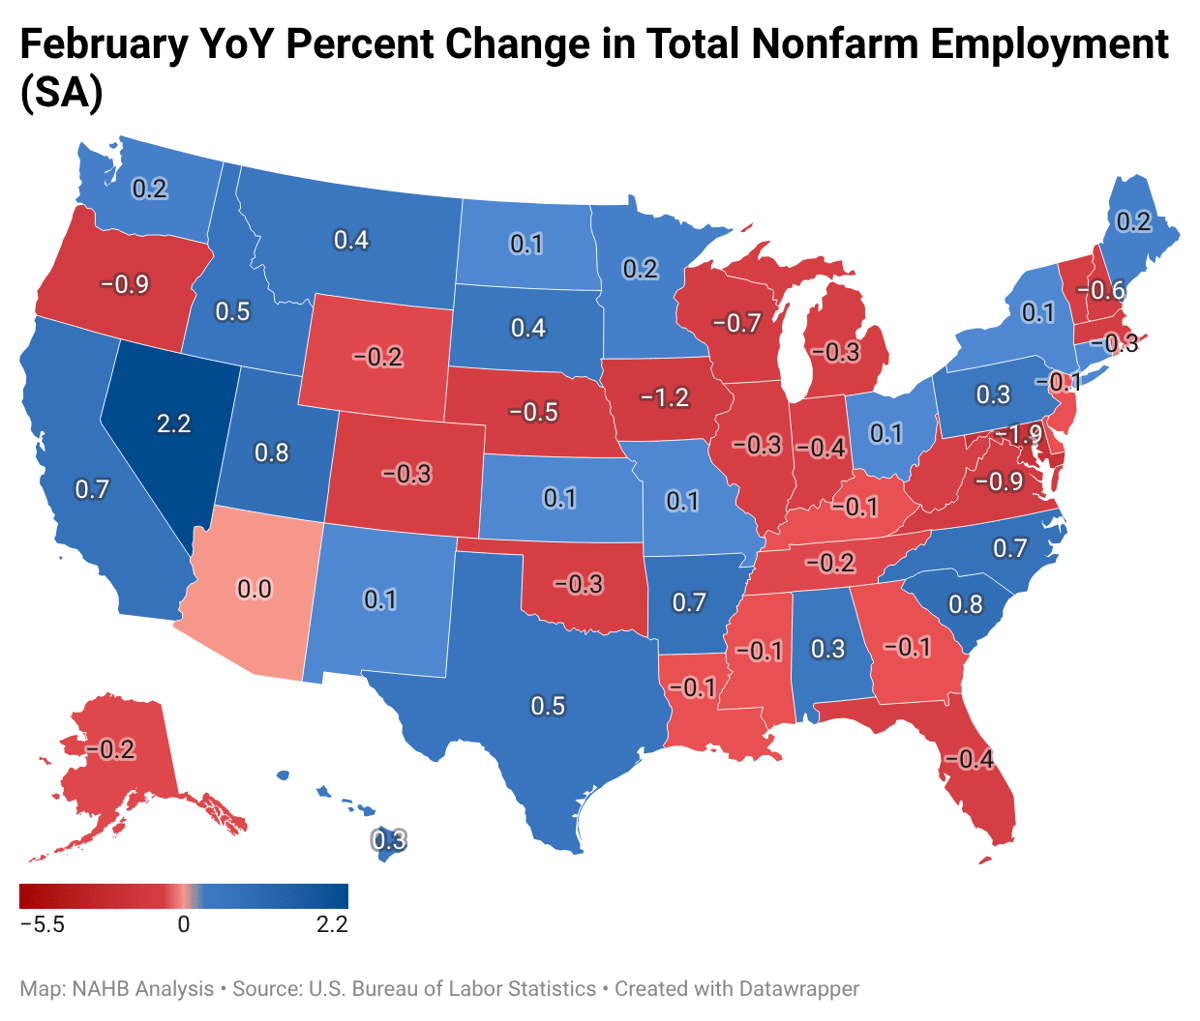
- •Nevada posted strongest annual growth at 2.2%; Maryland biggest decline.
- •District of Columbia unemployment peaked at 6.5%, highest among states.
Pulse Analysis
February’s employment report marks a turning point after a strong start to the year. The Bureau of Labor Statistics showed a 133,000‑job decline, the first monthly drop since mid‑2024, underscoring emerging softness in hiring. While the national headline suggests a modest contraction, the underlying data reveal a fragmented picture: 36 states lost jobs, reflecting reduced demand in sectors ranging from retail to manufacturing, whereas 14 states managed modest gains, hinting at localized resilience driven by tourism and tech‑related hiring.
State‑level analysis uncovers stark contrasts. Arizona led monthly job creation with 11,000 new positions, but New York suffered the steepest loss at 22,000, dragging regional employment figures down. In the construction arena, the sector’s net loss of 13,000 jobs mirrors broader supply‑chain constraints and higher material costs, yet Texas added 24,000 construction jobs year‑over‑year, positioning it as a growth engine. Nevada’s 2.2% annual gain stands out as the strongest, while Maryland’s 1.9% decline signals deeper structural challenges, possibly tied to federal workforce reductions.
Unemployment rates further illuminate labor market health. Hawaii and South Dakota enjoy 2.3% unemployment, reflecting tight markets that could spur wage growth, whereas the District of Columbia’s 6.5% rate—driven by sizable federal layoffs—highlights vulnerability to policy shifts. States hovering around the 5% threshold, such as Michigan and California, may face increased pressure on wages and inflation. Policymakers and investors should monitor these divergent trends, as they will shape fiscal decisions, workforce development initiatives, and sector‑specific strategies moving forward.
State-Level Employment Situation: February 2026
Comments
Want to join the conversation?
Loading comments...