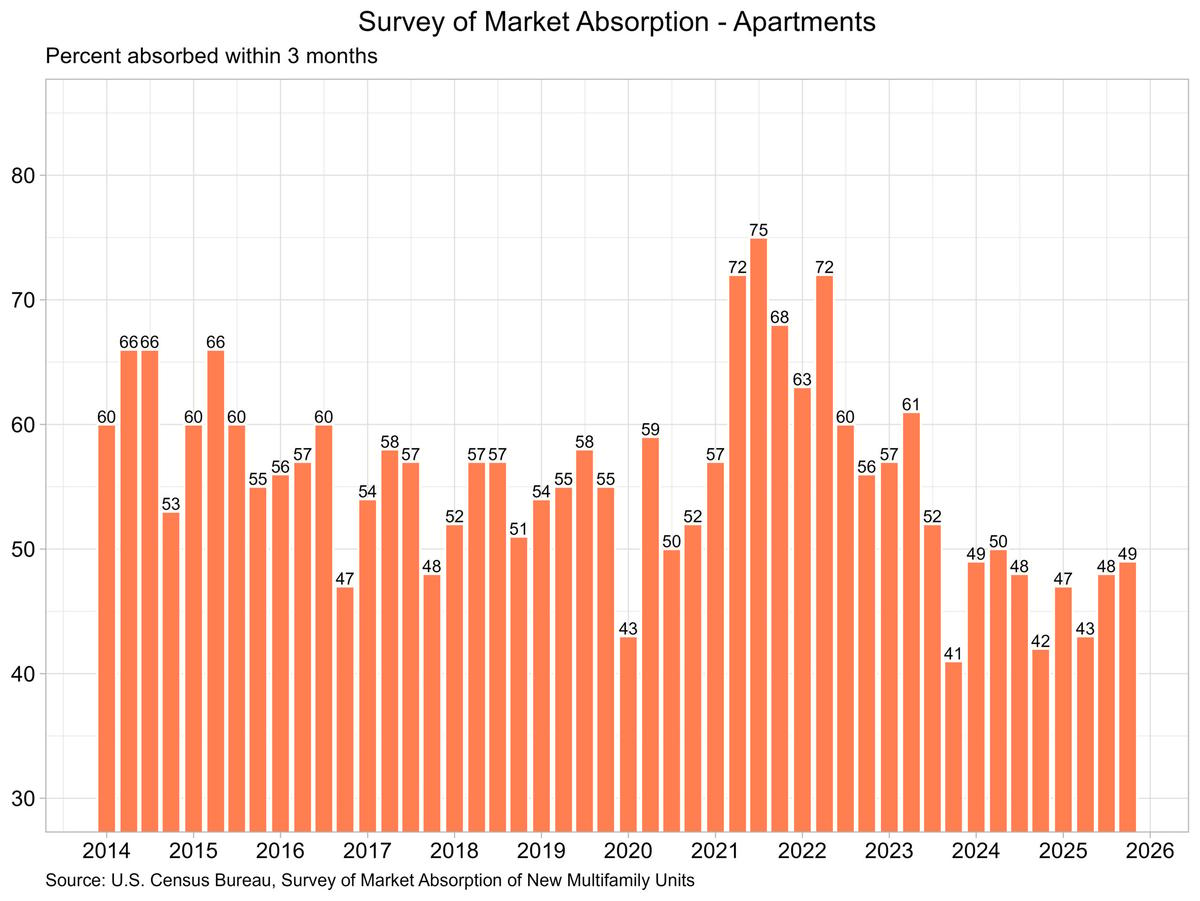
Rent Prices Continue to Rise, While Absorption Remains Low
U.S. Census Bureau data shows that only 49% of new apartment units were absorbed within three months in Q4 2025, marking the sixth straight quarter below the 50% threshold. Median asking rent for these apartments rose 4.5% year‑over‑year to $2,034, the first time it exceeded $2,000. New multifamily completions slipped to 77,380 units, the lowest quarterly total since Q2 2022, while longer‑term absorption improves, reaching 68% at six months and 90% at twelve months. Condominium and cooperative units posted a stronger three‑month absorption rate of 70% on 4,831 completions.
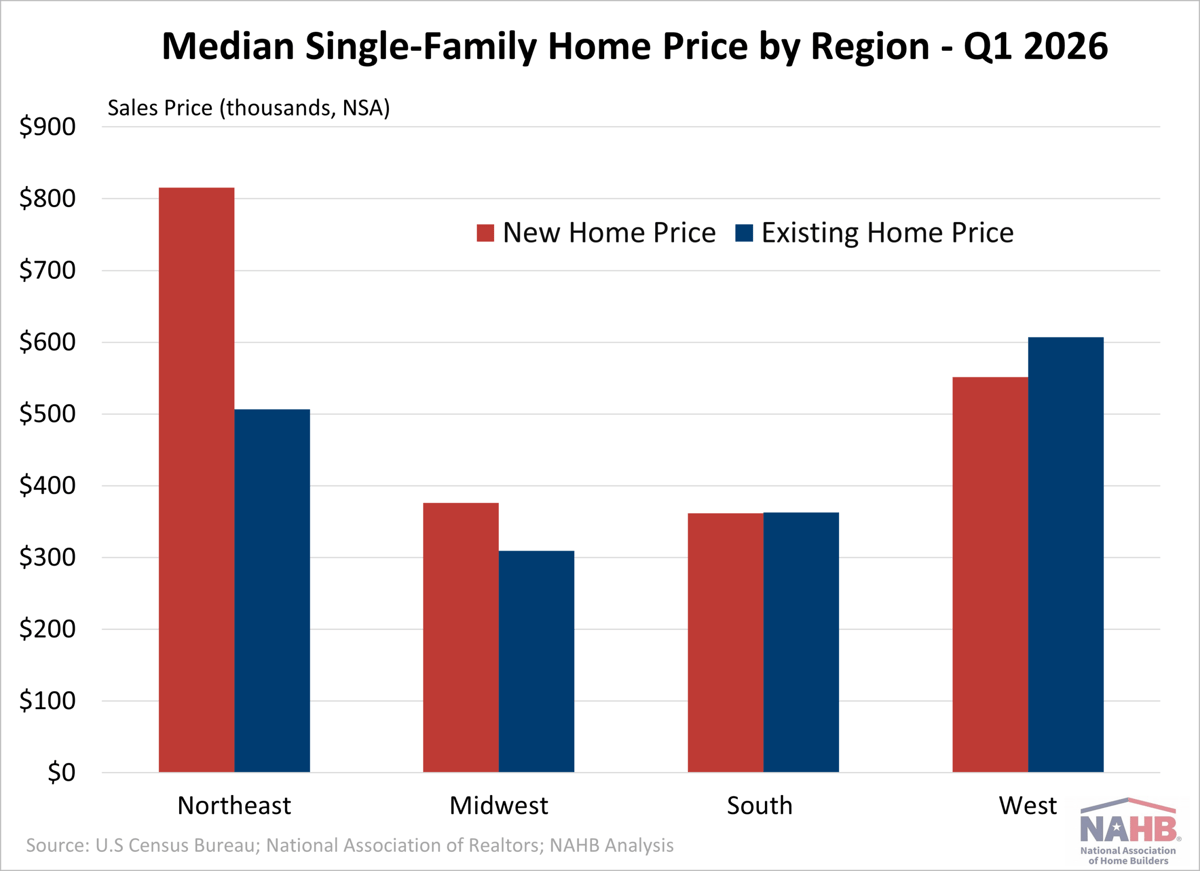
New Home Vs. Existing Home Prices in Q1 2026
In Q1 2026 the median price of a new single‑family home was $403,200, just $1,400 below the $404,600 median for existing homes, marking the fourth straight quarter where new homes cost less. The price gap reversed in Q2 2024 and has persisted...
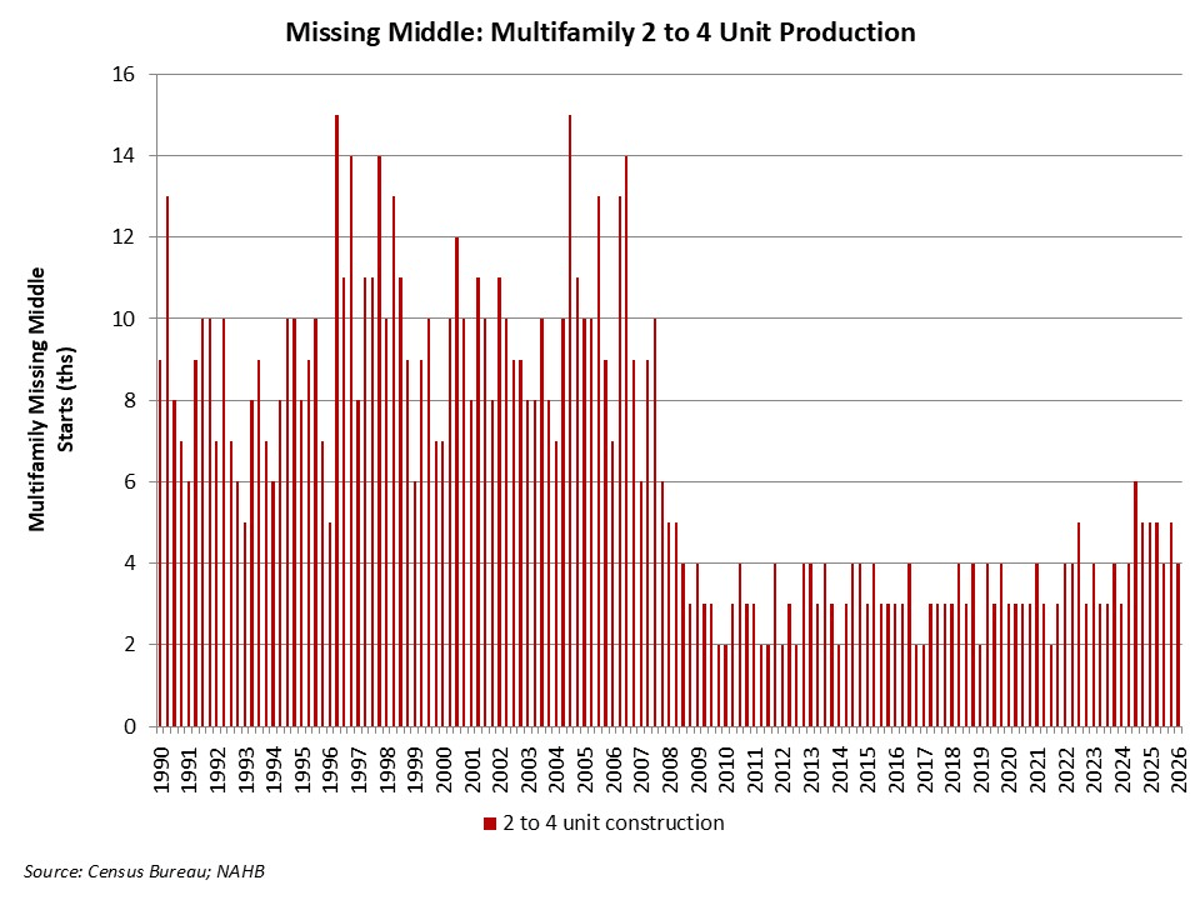
Multifamily Missing Middle Construction: First Quarter 2026
The first quarter of 2026 recorded just 4,000 starts of 2‑ to 4‑unit multifamily projects, a noticeable drop from the same period in 2025. Over the past four quarters, total starts fell to 23,000 units, down from 24,000 in the...
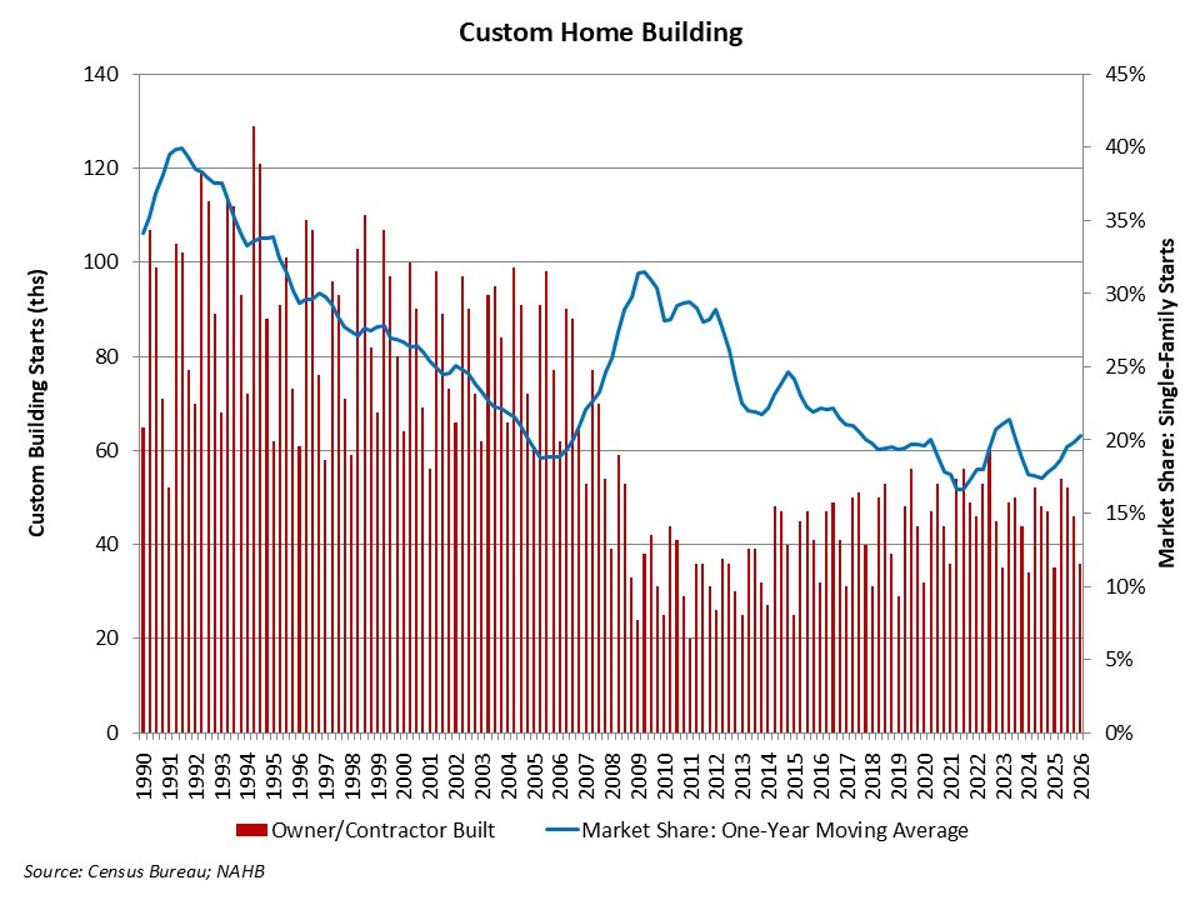
Custom Home Building – A Bright Spot for Construction
Custom home building is emerging as a bright spot in a weakening single‑family market, with overall starts down 5% through April 2026. The NAHB reports 36,000 custom starts in Q1 2026, a 3% year‑over‑year increase, and 188,000 starts over the...
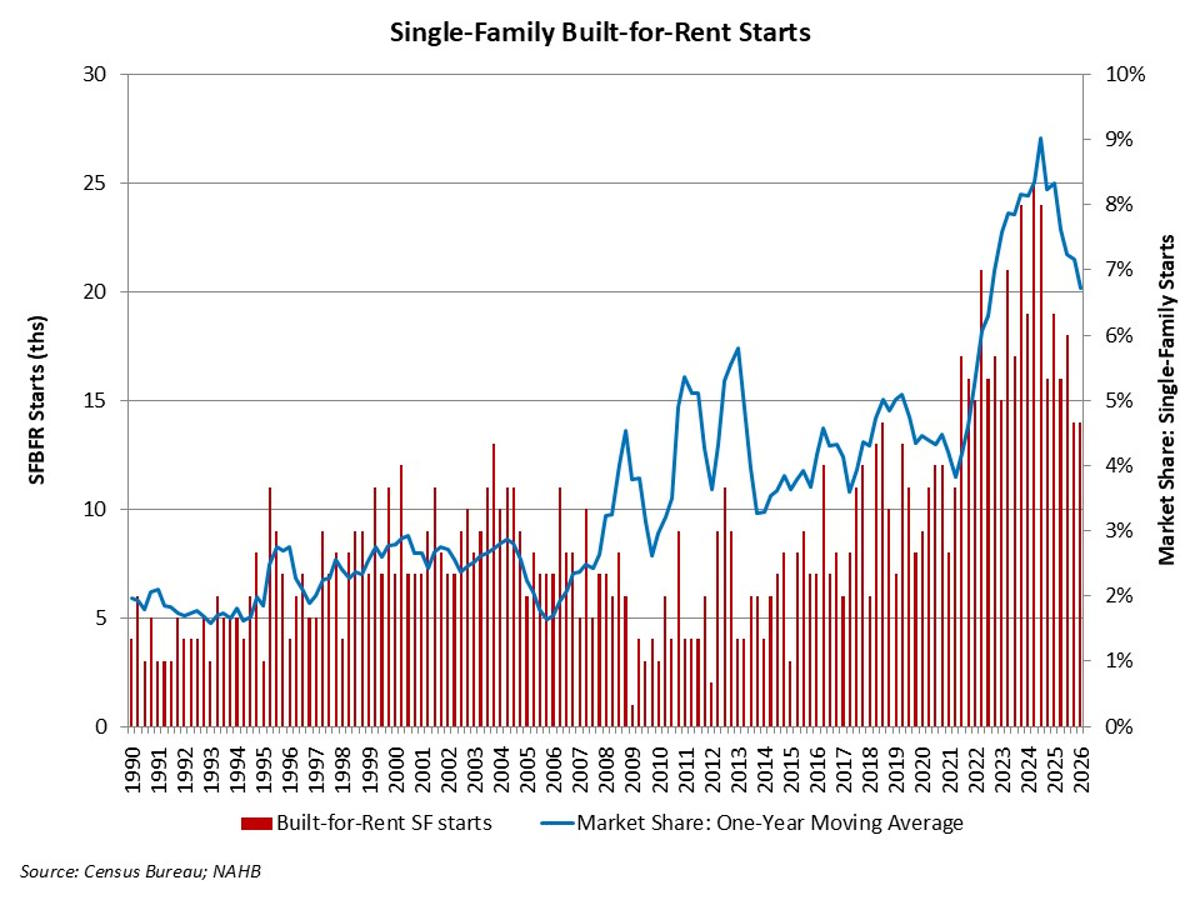
Single-Family Built-to-Rent Slowed at Start of 2026
Single-family built‑to‑rent (BTR) construction slipped in Q1 2026, with starts dropping to roughly 14,000 units, down from 19,000 a year earlier. Over the past four quarters, total BTR starts fell 26% to 62,000, reflecting higher financing costs, rising multifamily supply,...
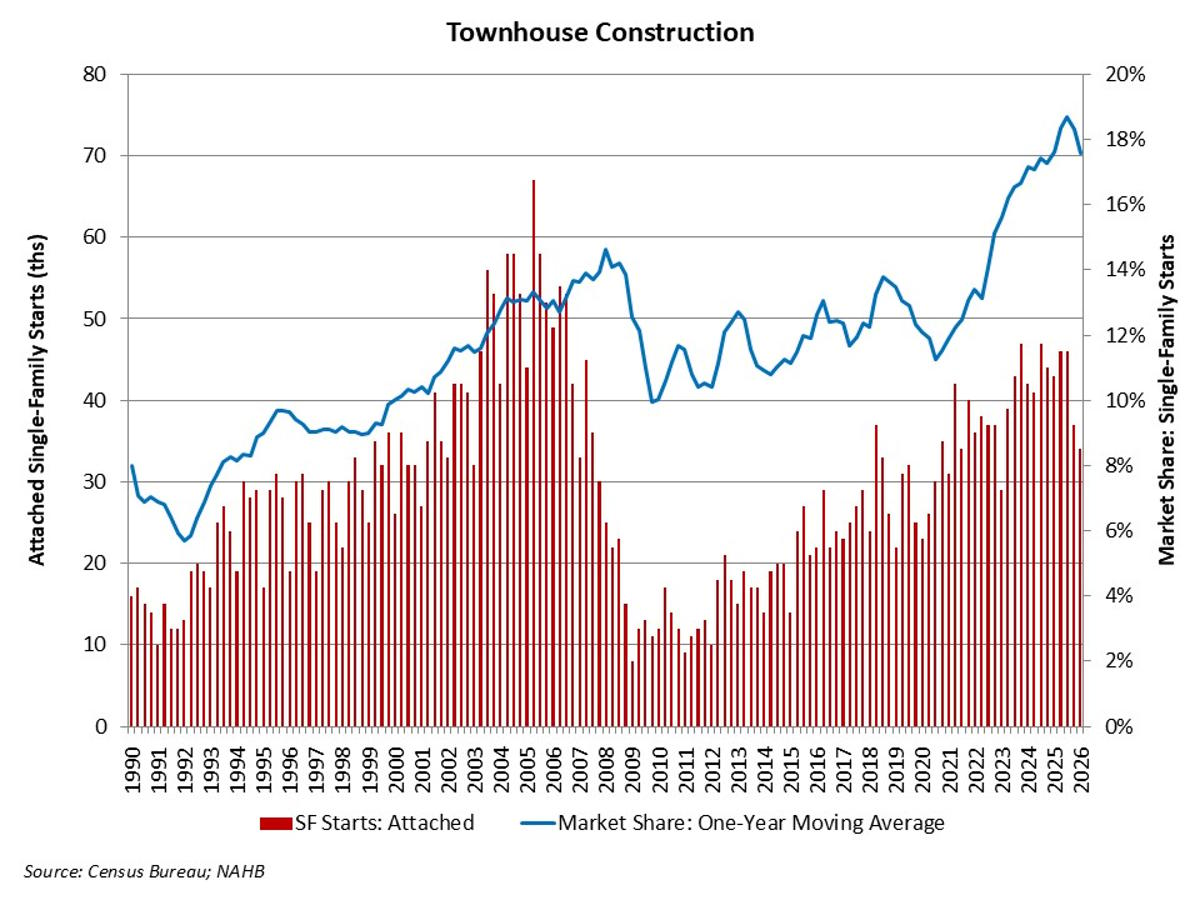
Cyclical Weakness for Townhouse Construction
First‑quarter 2026 data show townhouse starts slipping to 34,000 units, a 21% year‑over‑year decline and the weakest quarter since early 2023. Over the past four quarters, total starts fell 7% to 163,000, pushing townhouses to about 16% of all single‑family...
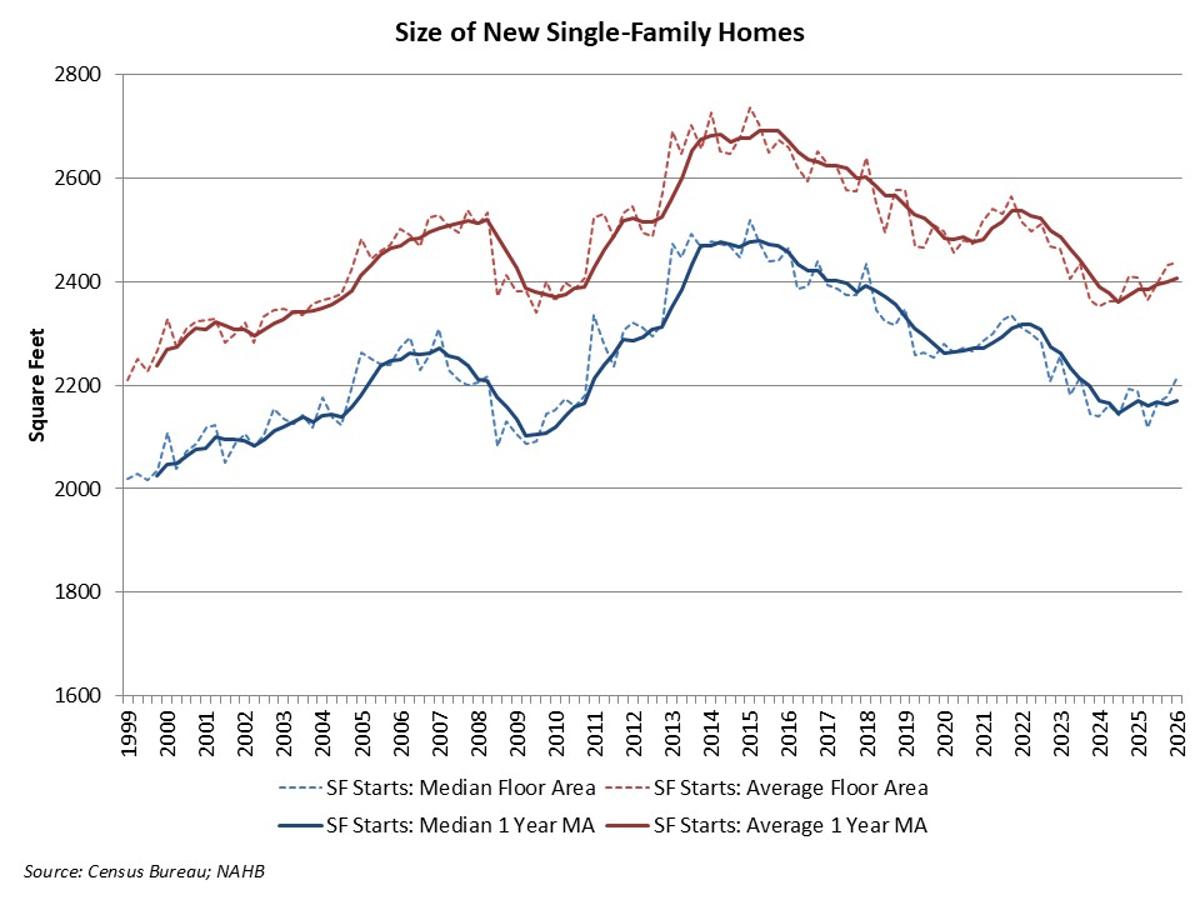
Single-Family Home Size Posts Small Gains
New single‑family home sizes have plateaued in early 2026 after years of decline, with the median floor area holding at 2,211 sq ft and the average at 2,436 sq ft. Both metrics represent modest gains—over 3 % median growth since 2024 and a slight year‑over‑year...
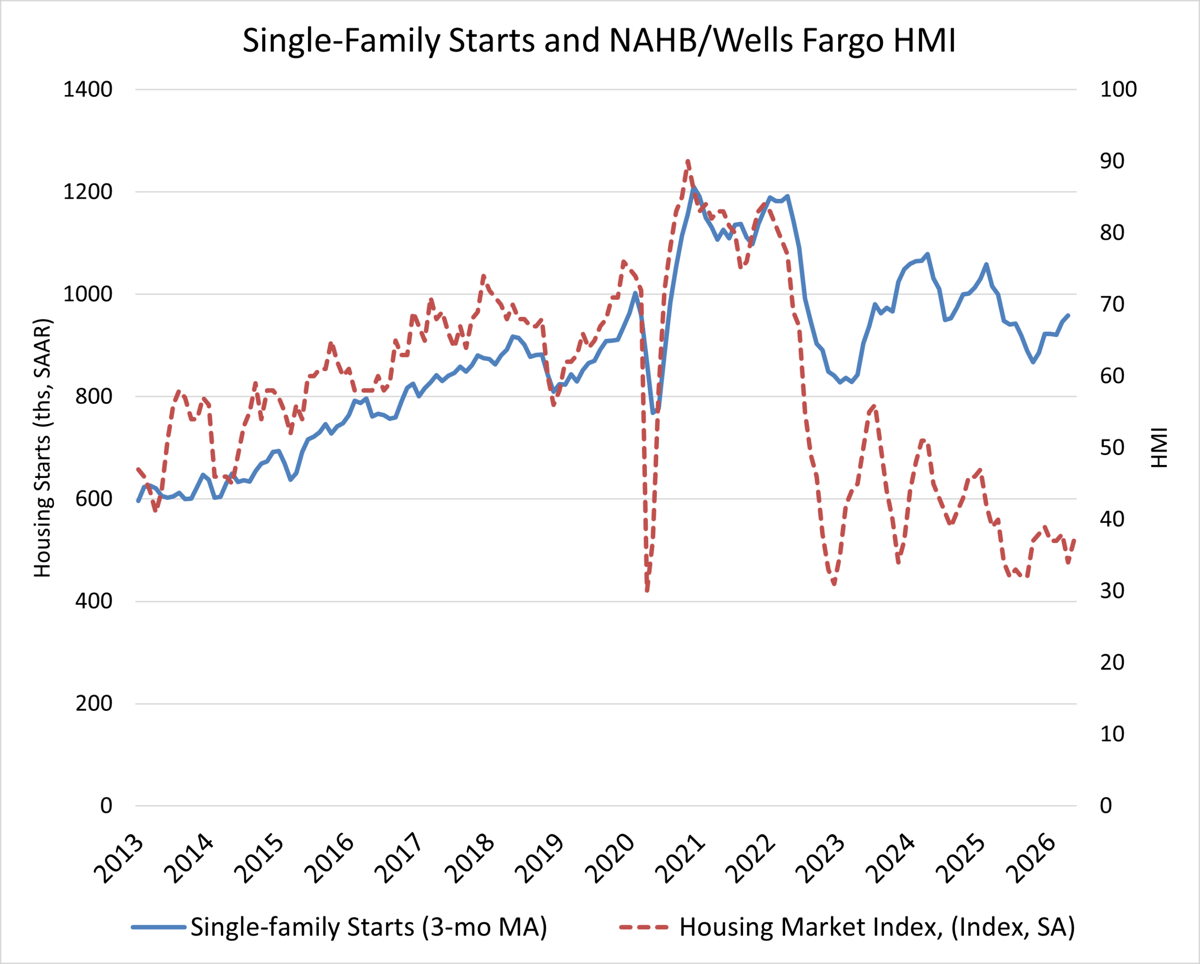
Single-Family Starts Fall Amid Economic Uncertainty and Affordability Pressures
U.S. single-family housing starts fell 9% in April to an annualized 930,000 units, while overall starts slipped 2.8% to 1.47 million. Multifamily starts rose 10.3% to 535,000 units, indicating a pivot toward higher‑density construction. The Midwest was the only region with...
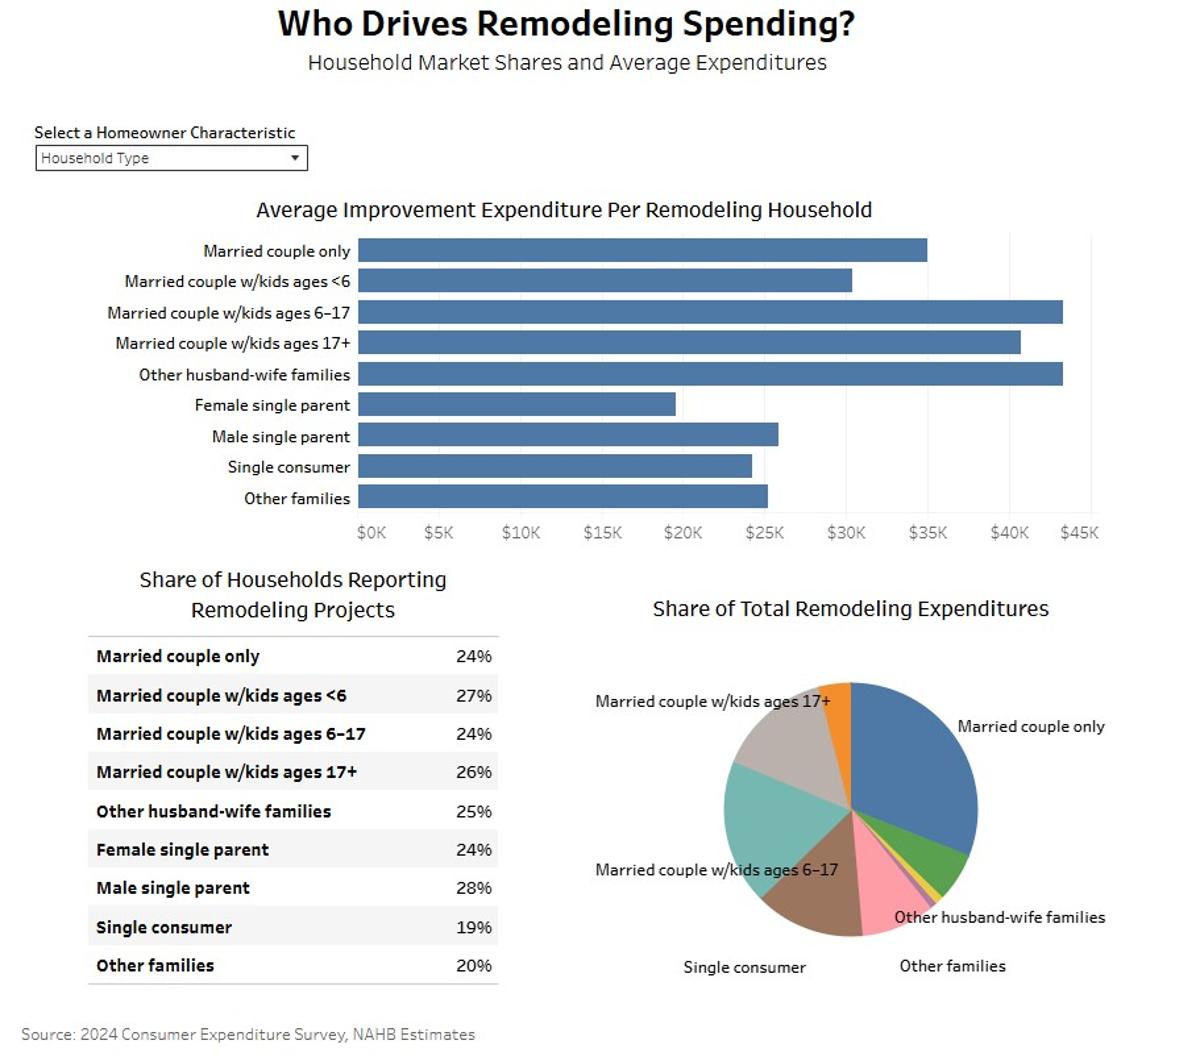
Who Drives Remodeling Spending?
In 2024 U.S. homeowners poured roughly $670 billion into remodeling, with 20 million households participating. Married‑couple families drove the bulk of activity, spending $458 billion and representing 60% of projects, while baby boomers contributed the largest generational share at $254 billion. Spending peaks among...
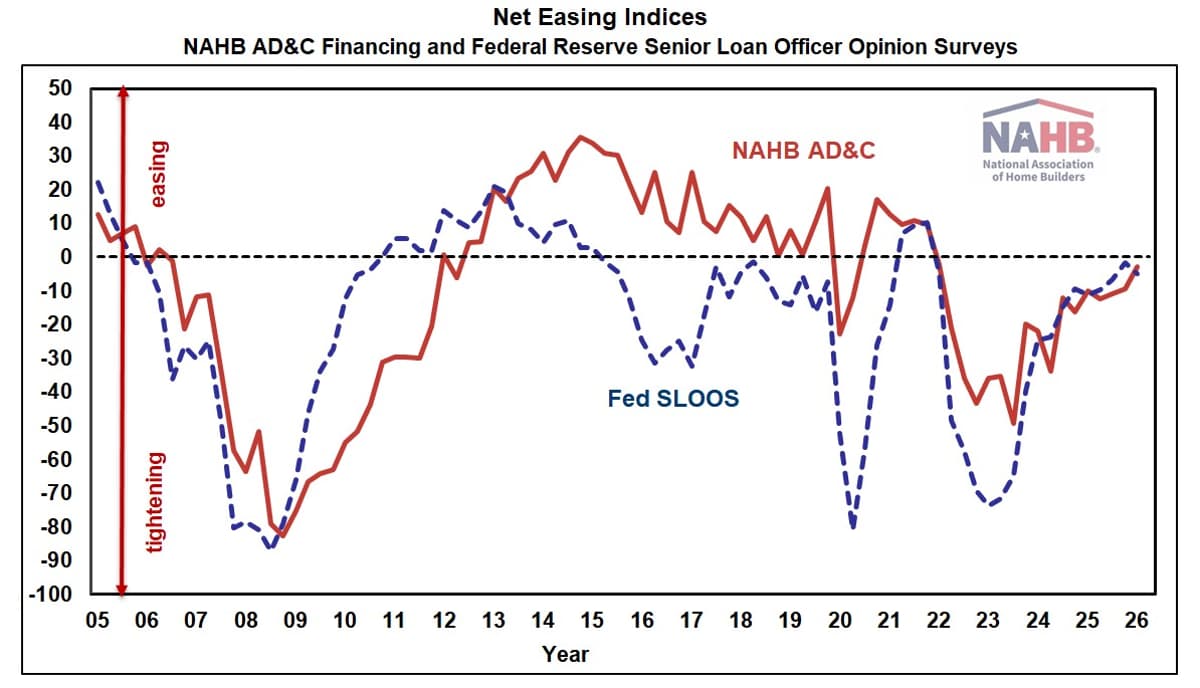
Credit for Builders Tightens in the First Quarter, But Only Slightly
Credit conditions for residential land acquisition, development and construction (AD&C) loans tightened slightly in Q1 2026, with the NAHB net‑easing index at –2.7, the closest to zero in four years. The Federal Reserve’s Senior Loan Officer Survey showed a –4.9 reading,...

Residential Construction Input Prices Move Higher In April
Residential construction input prices rose sharply in April, driven primarily by a 13.8% jump in energy costs and a 15.3% surge in transportation services. The overall input price index increased 1.3% month‑over‑month and 5.9% year‑over‑year, with building material prices up...
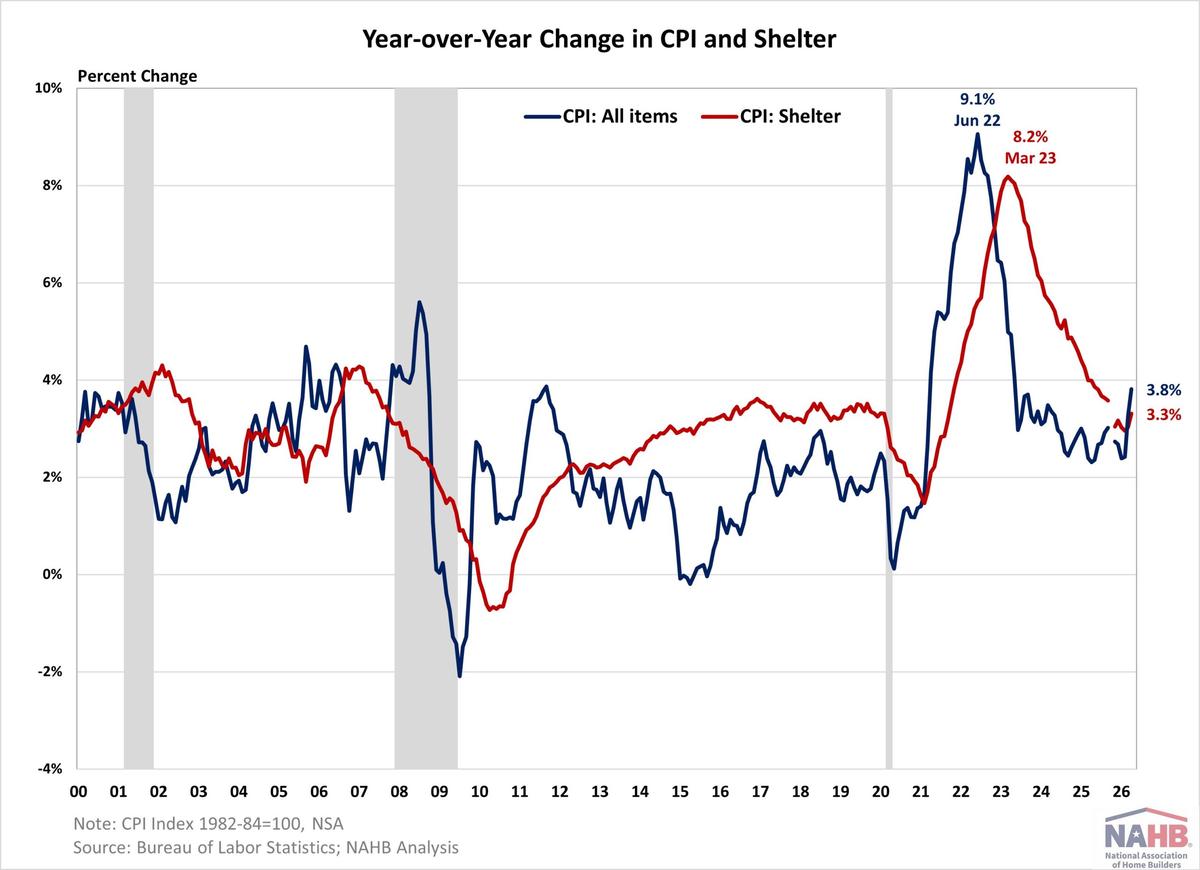
Inflation Outpaced Wage Growth in April
U.S. consumer prices rose 3.8% year‑over‑year in April, the strongest gain since May 2023, propelled by a 17.9% jump in energy costs linked to the Iran conflict. The surge pushed inflation above wage growth for the first time since May...
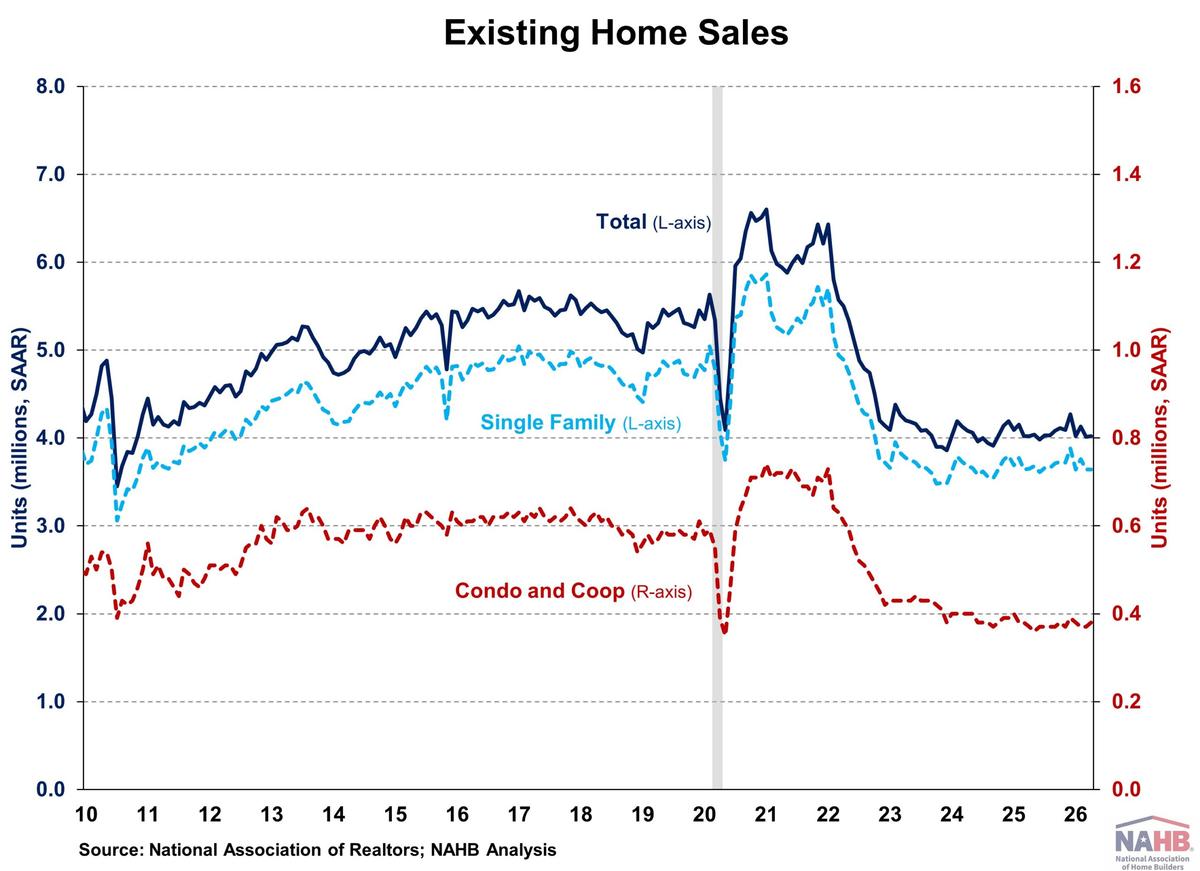
Existing Home Sales Edged Up Slightly in April
Existing home sales in April nudged up 0.2% to a seasonally adjusted annual rate of 4.02 million, halting a nine‑month decline but remaining at historically low levels. Inventory rose 5.8% to 1.5 million units, translating to a 4.4‑month supply, yet still below...
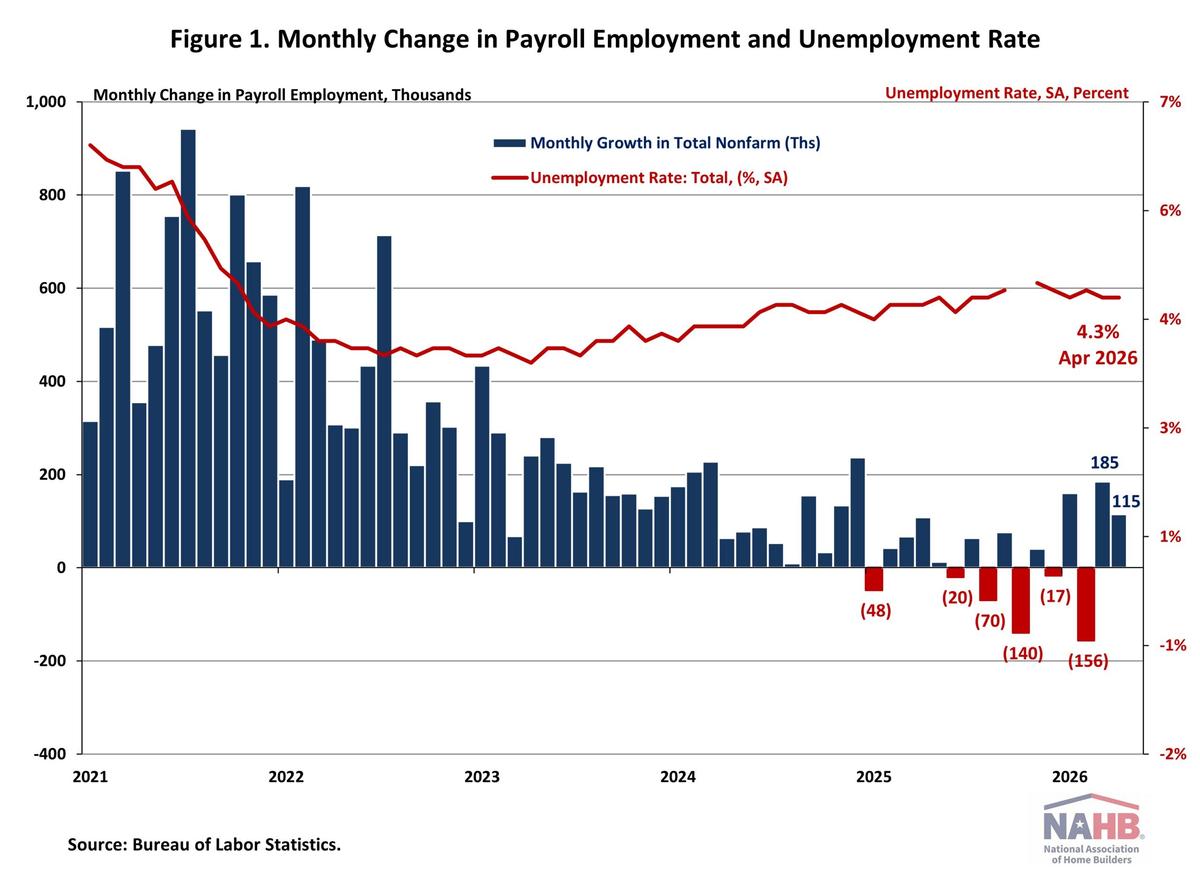
U.S. Economy Adds 115,000 Jobs in April
The Bureau of Labor Statistics reported that U.S. nonfarm payrolls rose by 115,000 in April, keeping the unemployment rate steady at 4.3%. Job gains were concentrated in health care (+37,000), transportation and warehousing (+30,000), and retail trade (+22,000). Average hourly...
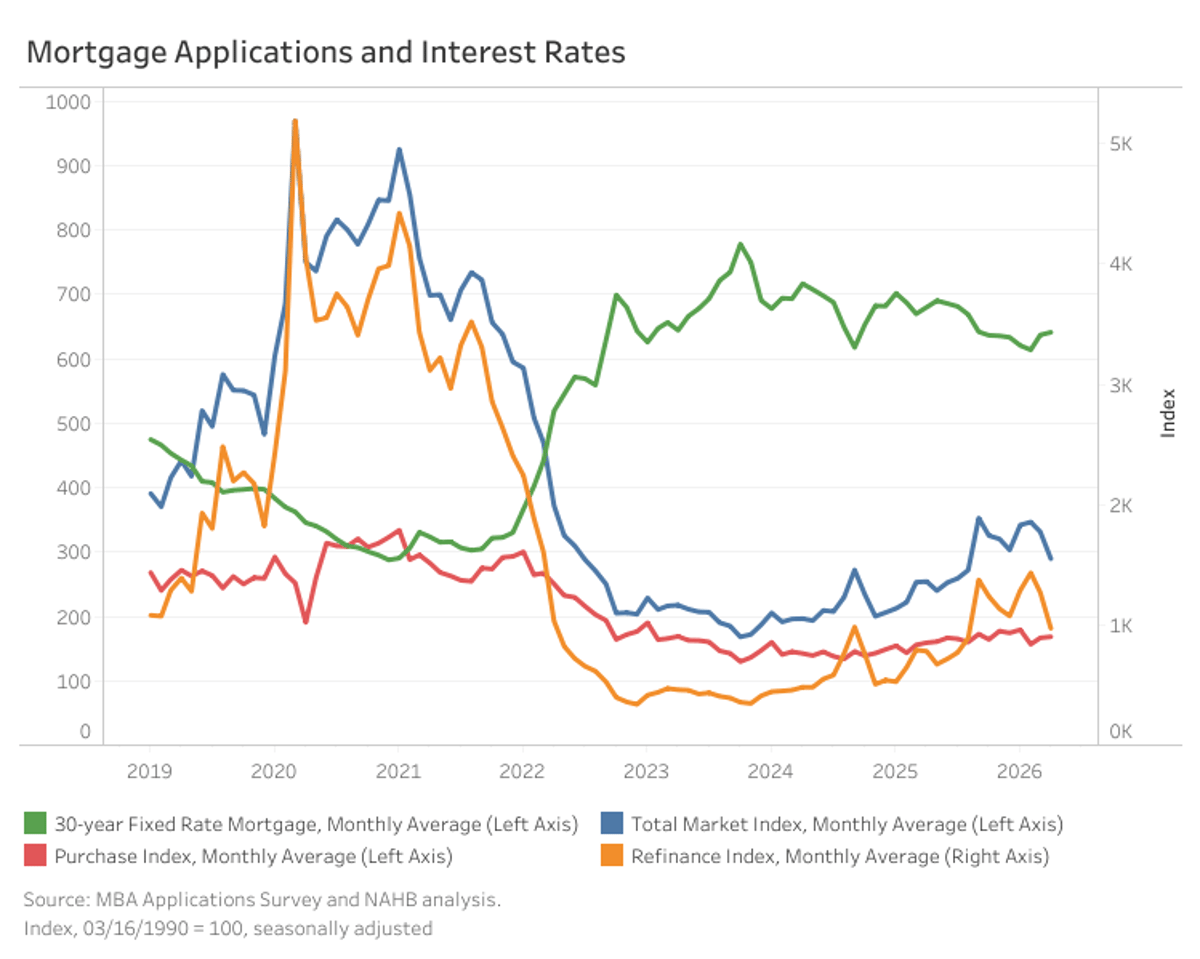
Mortgage Applications Retreats Further in April
Mortgage application activity declined in April, with the Mortgage Bankers Association’s Market Composite Index dropping 12.4% month‑over‑month, though it remained 14.2% higher than a year earlier. The average 30‑year fixed‑rate mortgage rose to 6.41%, up four basis points but still...