Markets Shrug Off Geopolitical Risk
U.S. equity futures swung sharply after weekend news of U.S.-Israel strikes on Iran but stocks largely stabilized, leaving major indices trading in a narrow range around the 6,900 area despite heightened volatility. Oil spiked roughly 7%, lifting select energy and defense names—Palantir and some oil stocks saw knee-jerk gains—while broader tech weakness failed to press the market lower. Market participants described the moves as reflexive and cautioned against chasing intraday momentum, with several traders reducing position sizes and focusing on short-term trades. Analysts said a clear catalyst to break the range is unclear, citing upcoming Fed leadership changes and the midterm elections as potential drivers.

Beyond Fridays: The New Era of Single-Stock Expirations
Single-stock options are expanding beyond the traditional Friday expiration as Monday and Wednesday 0‑day‑to‑expiration (0DTE) contracts launch. Unlike index 0DTEs, these contracts are American‑style and physically settled, creating new exercise, assignment, and dealer‑hedging dynamics. Mat Cashman of the OCC and...
The Big 3: RKLB, MNST, WMT
Tammy Marshall of Elliott Wave Trader uses Fibonacci analysis to pinpoint breakout potential in three distinct stocks: Rocket Lab (RKLB), Monster Beverage (MNST) and Walmart (WMT). She walks investors through example options trades, highlighting entry points and risk/reward profiles. Kevin...
CrowdStrike "Underappreciated?" Analyst Sees CRWD Sell-Off "Overdone" Into Earnings
CrowdStrike (CRWD) is set to report earnings on Tuesday amid a sharp stock decline. Piper Sandler analyst argues the sell‑off is excessive and labels the company best‑in‑class as AI‑driven cyber threats rise. The firm expects cybersecurity spending to accelerate with...
Mastering Credit Spreads: High Probability Trades with Defined Risk
The video teaches a repeatable credit‑spread system that emphasizes defined risk and high probability setups. It outlines using a 15‑delta short strike, 30‑45 days to expiration, and a $5 spread width to capture premium while limiting loss. The presenter demonstrates...

High Volatility + Reversals: The Real Reason Leveraged ETFs Underperform
The video examines why leveraged exchange‑traded funds (ETFs) tend to underperform during turbulent markets, focusing on the empirical link between volatility and serial correlation rather than volatility alone. The presenter challenges the common narrative that volatility is inherently detrimental, showing...
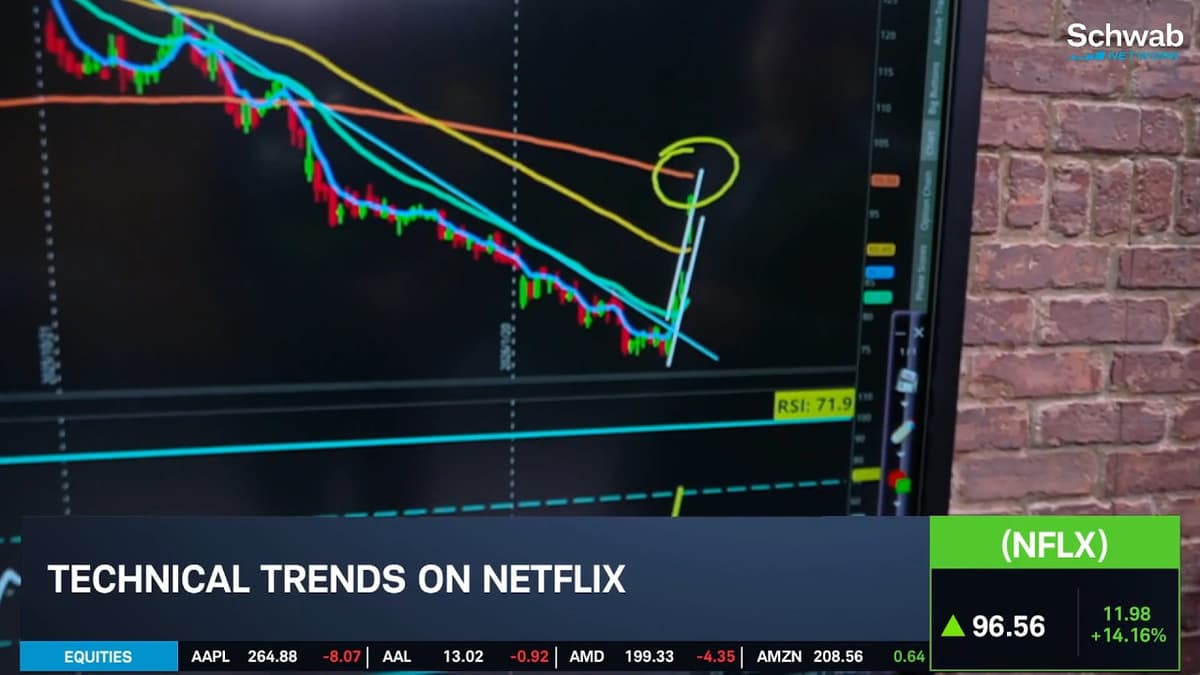
NFLX Jumps After Losing WBD Bidding War to PSKY
Netflix stock surged on Friday after the streaming giant lost its bid for Warner Bros. Discovery to Paramount Skydance. The rebound was driven by strong technical signals, including a breakout above key moving averages. Options activity also exploded, with volume more...

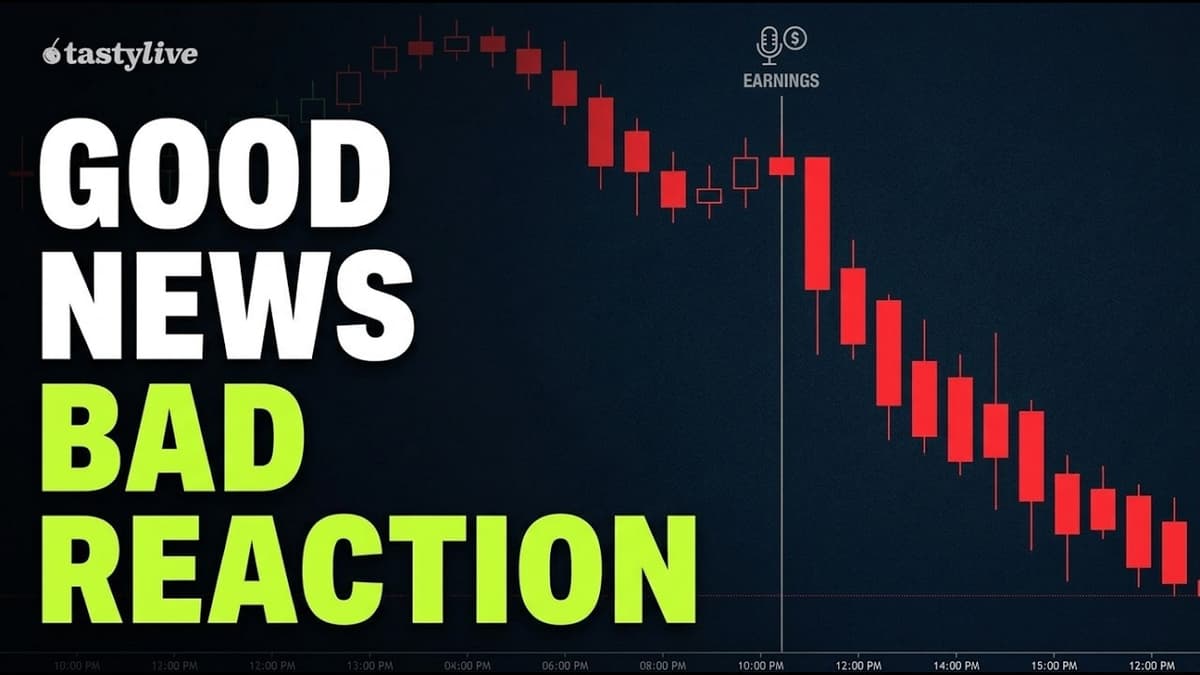
Nvidia Earnings: The Ultimate Coin Flip
The video dissects Nvidia’s post‑earnings market turbulence, noting that the chip‑maker’s stock surged in after‑hours trading only to tumble to $184.89, a 5.5% decline and its worst single‑day drop since last year’s tariff‑related sell‑off. The host warns that the rapid...
The Aftermath of the Nvidia Earnings Coin Flip
Nvidia’s post‑earnings session saw the stock dip 5.5%, instantly pressuring the 190‑strike put contracts that expire tomorrow. Mark Longo highlighted that 96% of the options flow in ChargePoint is concentrated in front‑week expirations, earning it a Front Runner Badge alongside...
This Is Where Traders Get Trapped
In the February 26 Thursday review, Sam notes that the S&P 500 has been confined to an unusually tight trading range for almost three months, hovering around a weekly 10‑point band and offering little directional clarity. He recaps last week’s predictions—a mechanical short‑squeeze...

Equity Indices Moved Off Session Lows Following Earnings Reports. 2/26/26
The video recaps Tuesday’s market action, highlighting how equity indices rebounded from early session lows after mixed earnings from tech giants NVIDIA and Salesforce. The S&P 500 and Dow Jones clawed back losses, while the Nasdaq stayed more than 1%...

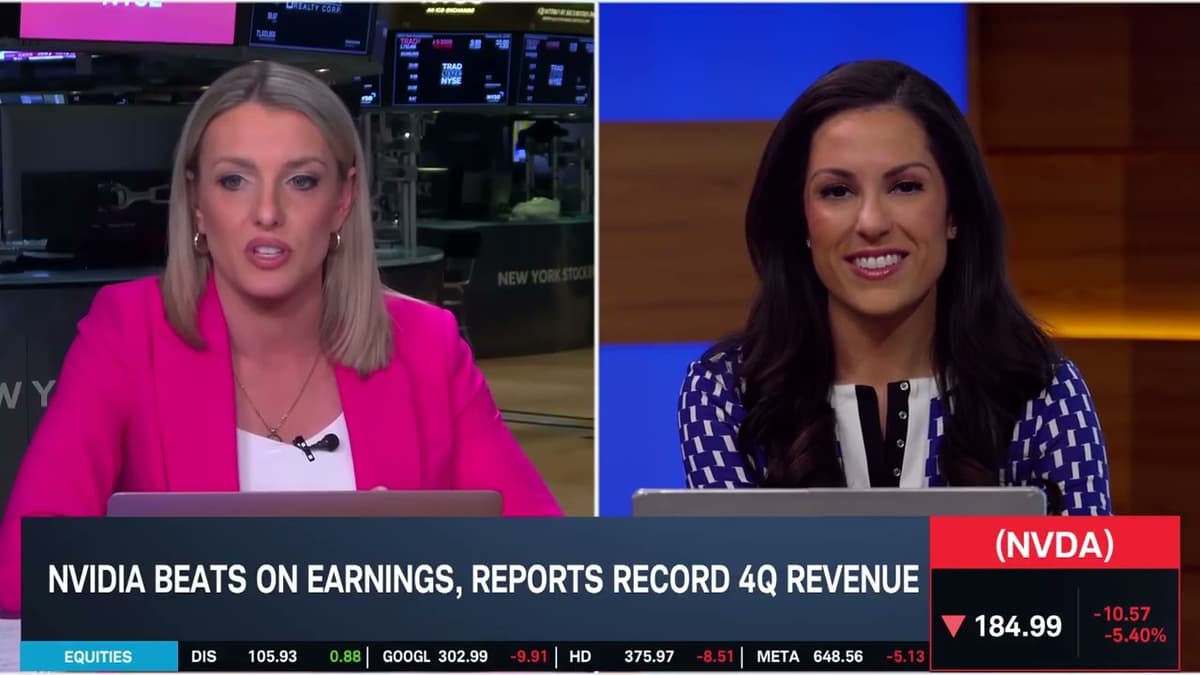
Is NVIDIA a Crowded Trade? Two Perspectives
NVIDIA reported record revenue and an earnings beat, yet its shares slipped 5% after the announcement. The company highlighted strong AI demand and guidance that extends contracts through 2027. Analysts are split: some see the dip as a buying opportunity...

Software Stocks Are Getting Crushed. Here's a Trade
NVIDIA’s earnings beat expectations but the stock slipped 4%, prompting a mixed options playbook. The episode highlights two bullish short put spreads—NVIDIA and gold (GLD)—and two bearish short call spreads on Coca‑Cola and Salesforce. Each trade is defined‑risk with more...
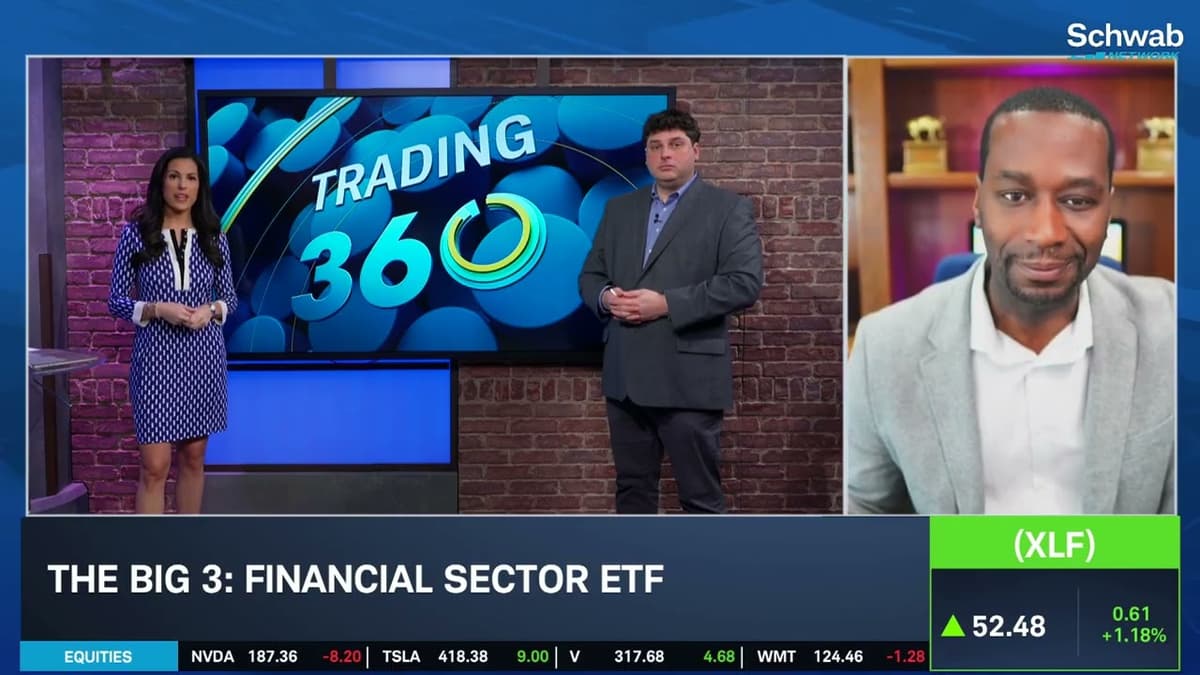
The Big 3: XLF, RKLB, MSFT
After Nvidia’s earnings miss sparked a sharp sell‑off across the technology sector, market commentator Jason Brown argued that the rally is insufficient to satisfy investors. He highlighted three alternative plays—SPDR Financial Sector ETF (XLF), Rocket Lab (RKLB), and Microsoft (MSFT)—as...
Nvidia Post-Earnings Iron Condor | Options Trade of the Day
Tony Battista outlines a post‑earnings iron condor on Nvidia after its earnings‑driven price swing. The trade exploits a sharp drop in implied volatility rank and a re‑established multi‑month range. A $10‑wide, delta‑neutral spread in the April series combines a bullish...
Nvidia After Earnings & CoreWeave Trade Setup | Market Movers
Nvidia’s latest earnings beat sparked a sharp post‑release price dip, prompting a neutral premium‑selling strangle trade that benefits from the stock’s elevated implied volatility. The episode also previews CoreWeave’s upcoming earnings, recommending a high‑probability out‑of‑the‑money put to capture the anticipated...

From Struggle to Consistency: AXIA’s Trader Formula
The video introduces Axia’s “Trader Formula,” a systematic framework designed to turn struggling traders into consistent, high‑earning professionals by teaching them how to navigate four distinct market environments. The firm argues that longevity in trading depends not on chasing the...
Analysts Raise NVDA Price Targets, Stock Falls After Earnings
Nvidia (NVDA) posted a blockbuster earnings report that beat revenue and profit forecasts, prompting multiple analysts to raise their price targets across the board. Despite the upbeat fundamentals, the stock opened lower and slipped about 2% in early trading. Analysts...

AI Round 3 -Earnings Trading
In this Options Boot Camp episode, Mark Longo and Dan Passarelli test ChatGPT’s premium model on Nvidia’s earnings move, comparing AI predictions to human strategies. They dissect the post‑earnings volatility crush, clarify misconceptions around the Expected Move, and explain why...

Post-Earnings Volatility, AI Repricing & The Fed Factor
Chris Vecchio analyzes the surge in Nvidia’s post‑earnings volatility as AI‑driven expectations are repriced. He highlights a short‑term “AI scare” trade targeting software stocks, prompting options traders to recalibrate positions. The discussion also underscores that Federal Reserve commentary and interest‑rate...

Who the Hell Knows About Crypto, Coffee, Cocoa and More?
In the latest Futures Rundown, Mark Longo and Dan Gramza spotlight the week’s biggest commodity movers, with lithium, silver and platinum posting double‑digit gains. They dissect record volumes in Treasury notes and Nasdaq micro futures, while noting that crude oil’s...
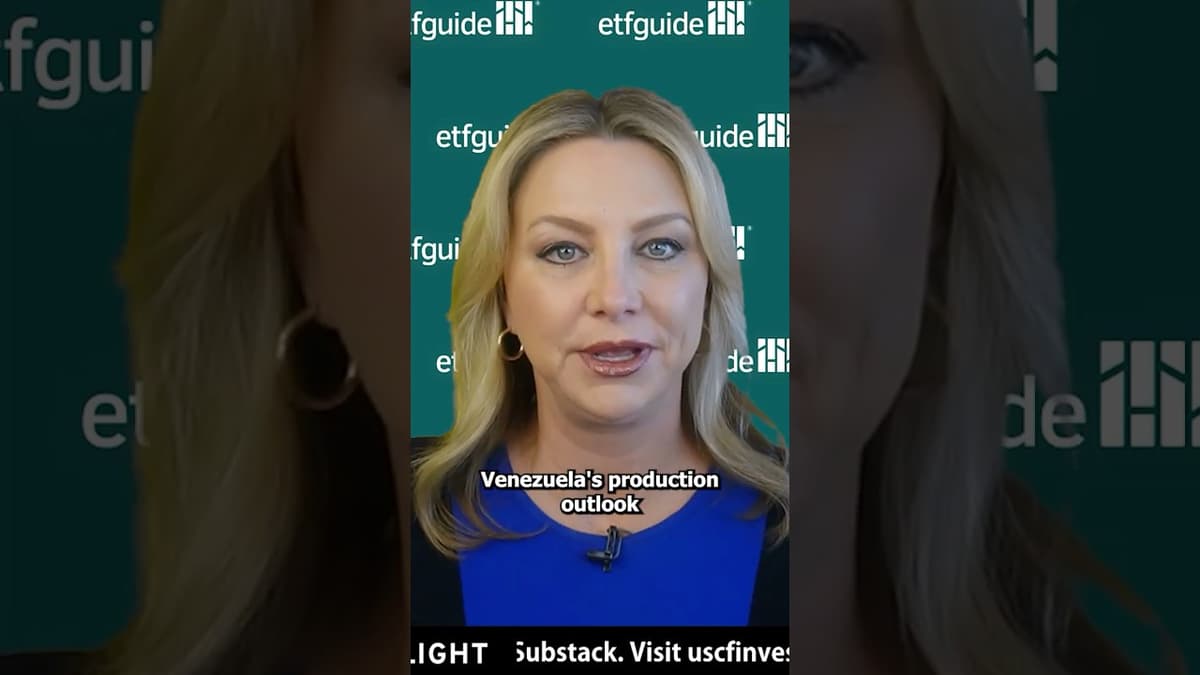
Why Venezuelan Oil Is Worthless
The video examines why Venezuelan crude is effectively worthless in today’s oil market, emphasizing that despite vast reserves, the country’s output plays a negligible role in global supply. It highlights the distinction between Venezuela’s heavy, sour crude and the light,...

Rocking & Rolling in Rates
The European Market Brief dissected the quarterly roll in the rates complex, highlighting how massive liquidity migrates from longer‑dated contracts to front‑month futures. Experts identified the optimal "sweet spot" timing and explained the "Jelly Roll" strategy that leverages price gaps...
Don't Chase Earnings | Trade the Squeeze Instead
John Carter analyzes Nvidia's recent earnings release, warning traders that chasing the post‑earnings move often leads to costly IV spikes. He argues that selling premium on out‑of‑the‑money options typically outperforms buying them, especially when volatility is priced in. Carter then...

Tape #6: See Breakouts Before They Happen | SpotGamma
The video showcases how SpotGamma’s Hero indicator can spot a breakout before it materializes, using Palantir Technologies (PLTR) as a case study. At the time PLTR hovered around $153, the stock neared the $155 call‑wall—a typical short‑term resistance level. The Hero’s...

Tape #5: Spot Bullish vs Bearish Pressure | SpotGamma
Tape #5 from SpotGamma walks viewers through its real‑time options‑flow interface, emphasizing how traders can differentiate bullish from bearish pressure on individual stocks or indices. The video highlights the flow data tab, which timestamps each trade and flags aggressive call...

Tape #3: Gauge Market Posture | SpotGamma
SpotGamma’s Tape #3 video walks users through a set of five pie‑chart visualizations that break down put and call activity for any selected ticker list. The charts display total contracts, premiums, and the Greeks—Delta, Gamma, and Vega—across all options in...

Tape #2: Surface High-Impact Flow Fast | SpotGamma
SpotGamma’s Tape tool introduces four real‑time scanners—Top Options Volume, Top Daily Gamma Notional, Top Daily Movers, and Largest Daily Trades—to surface high‑impact options flow across more than 3,000 U.S. equities. The platform lets users filter results for contracts expiring within...

Tape #1: Visualize Momentum Through Options Flow | SpotGamma
SpotGamma introduced Tape, a real‑time options‑flow platform that streams trades for over 3,000 U.S. equities. The tool combines live transaction data with customizable scanners, filters, Greeks, volume and premium metrics to surface market sentiment and trade conviction. Integrated with SpotGamma’s...
Volatility Dashboard #7: Trader Volatility Across Expirations | SpotGamma
SpotGamma’s Volatility Dashboard highlights a calendar‑spread strategy for traders who think the market is overpricing near‑term volatility. When implied volatility sits at the top of the grey cone or exceeds it, the near‑dated options are deemed expensive. Enabling the Forward...
Volatility Dashboard #6: Match Strategies to Volatility | SpotGamma
SpotGamma’s Volatility Dashboard lets traders pinpoint overpriced options by highlighting strikes with unusually high or low implied volatility. Users load a ticker into the Fixed Strike Matrix, enable Show Highlights, and instantly see yellow‑boxed opportunities. The tool recommends selling out‑of‑the‑money...

Volatility Dashboard#5: Spot Shifts in Volatility Expectations | SpotGamma
SpotGamma’s Volatility Dashboard features a VIX Term Structure chart that plots forward VIX futures across upcoming expirations, letting traders gauge future market risk. Users can toggle between calendar dates or days‑to‑expiration views and customize which dates appear, enabling precise analysis...

Volatility Dashboard #4: See Where Tail Risk Is Priced | SpotGamma
SpotGamma’s Volatility Dashboard adds a Skew tab that maps implied volatility across multiple strikes at a single expiration, letting traders see where the market prices tail risk. Users can toggle between price‑based, delta‑based, or percentage‑moneyness views and slide the scale...
Volatility Dashboard #3: Read Volatility Across Time Horizons | SpotGamma
SpotGamma’s Volatility Dashboard’s Term Structure tab now lets traders visualize implied volatility across option expirations in real time. Users can slide a timeframe selector from one day up to a year, and a gray cone displays the 10th‑90th percentile volatility...
Volatility Dashboard #2: Spot Cheap Vs. Expensive Options | SpotGamma
SpotGamma’s Volatility Dashboard introduces a Fixed Strike Matrix that ranks options as cheap or expensive using an Implied Volatility Z‑Score updated throughout the trading day. Users can customize the view, adjust expiration ranges, and toggle statistical or daily gradients to...

US-Iran Tensions: What the Options Market Is Telling Investors
The video examines how the options market is reflecting investor expectations amid rising U.S.-Iran tensions, highlighting that traders are pricing in a more hostile scenario. Data points show the put‑call skew on the S&P 500 (Triple Q) is as wide as...

What's Driving the Dollar Lower?
The video explains that the U.S. dollar is slipping primarily because of currency dynamics in Asia rather than domestic political events such as the State of the Union address. Large inflows into Asian equity markets, especially Taiwan and South Korea, have...

Stocks Rise as Oil Volatility and NVIDIA Earnings Loom. 2/25/26
U.S. equity futures rose, led by Nasdaq gains, as investors weigh oil volatility and upcoming Nvidia earnings. Eurozone CPI missed expectations while Japanese inflation cooled, prompting a shift in Fed rate‑cut expectations to July. Treasury will auction $70 billion of five‑year...
HIMS Earnings Rollercoaster and the Options Volatility Sweat
Hims & Hers (HIMS) posted a Q4 earnings beat but warned of softer forward guidance and heightened GLP‑1 regulatory scrutiny, sending the stock down to $13.75 in early Tuesday trade. A sharp mid‑day rally lifted the price to $15.46, rescuing...
GOOGL Ready to Run | Support and Divergence Confirm It
Google’s shares have bounced off the 100‑day simple moving average, confirming a key support level. Technical analysis highlighted bullish divergence and a true‑low signal with a 9‑out‑of‑10 success rate, prompting a re‑entry into a 330/335 call spread. The trade targets...

The EVERYTHING (EXCEPT SPX) APOCALYPSE
SpotGamma founder Brent Kochuba hosted a live session titled “The EVERYTHING (EXCEPT SPX) APOCALYPSE,” highlighting the severe decline in software and AI stocks. He examined how heightened volatility is reflected in options flow, especially in zero‑day‑to‑expiration contracts. The discussion showcased...
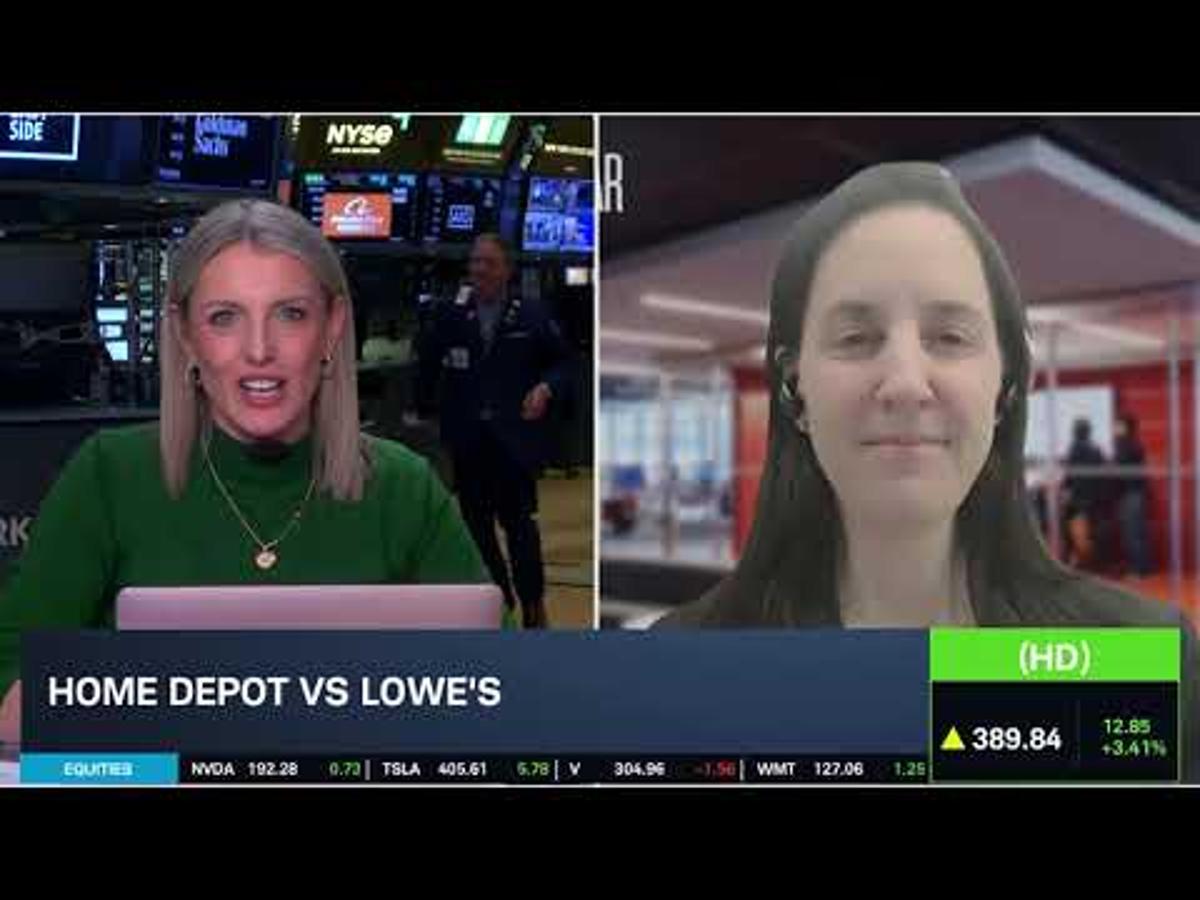
HD Builds Stronger Earnings, Sets Bar for LOW Report
Home Depot reported earnings that beat expectations, highlighting resilience amid persistent inflation and a soft housing market. The retailer’s sales growth was driven by strong DIY demand and effective cost‑control measures. Analyst Jaime Katz used the results to set the...

Live In The Markets With TG Watkins 2/24
Simpler Trading promoted its Live Trading Room, inviting traders to join daily sessions where professional traders share real‑time market analysis and trade ideas across options, stocks, and futures. The invitation includes links to the platform and social channels, emphasizing community...
Why Natural Gas Prices Are Rallying
The video explains why natural‑gas prices are surging in early 2026, attributing the rally primarily to an unusually persistent winter storm. The analyst notes that, unlike typical December‑January spikes that fade quickly, this storm lasted longer and knocked out a...

Trump's New 10% Tariff Takes Effect; Dimon Warns on Credit Risks | Bloomberg Brief 2/24/2026
The Bloomberg Brief highlighted the rollout of President Trump’s new 10% global tariffs, the first step in a broader trade‑war strategy after the Supreme Court struck down earlier measures. Officials indicated that Section 232 national‑security investigations and Section 301 unfair‑trade probes will...
Mad Money 02/23/26 | Audio Only
Jim Kramer opened Mad Money by warning that a dystopian AI‑driven unemployment scenario – outlined in a speculative 2028 Global Intelligence Crisis paper – is already influencing market sentiment. He linked the paper’s bleak forecast to today’s sharp declines: the Dow...
NVIDIA Earnings Setup Meets Gold's Breakout | Both Charts Aligned
The video highlights a market environment where equities like QQQ and SPY are under pressure, while gold and semiconductor stocks, especially Nvidia, are displaying relative strength. It outlines a multi‑timeframe TTM Squeeze setup for Nvidia ahead of its earnings report...

Pharma and Airline Stocks Move on Earnings and Weather
The video highlights two distinct market drivers on February 23: a disappointing weight‑loss trial from Novo Nordisk that sent its shares tumbling, and a severe East Coast storm that pressured airline stocks. Novo Nordisk fell 16% after its experimental obesity drug underperformed...
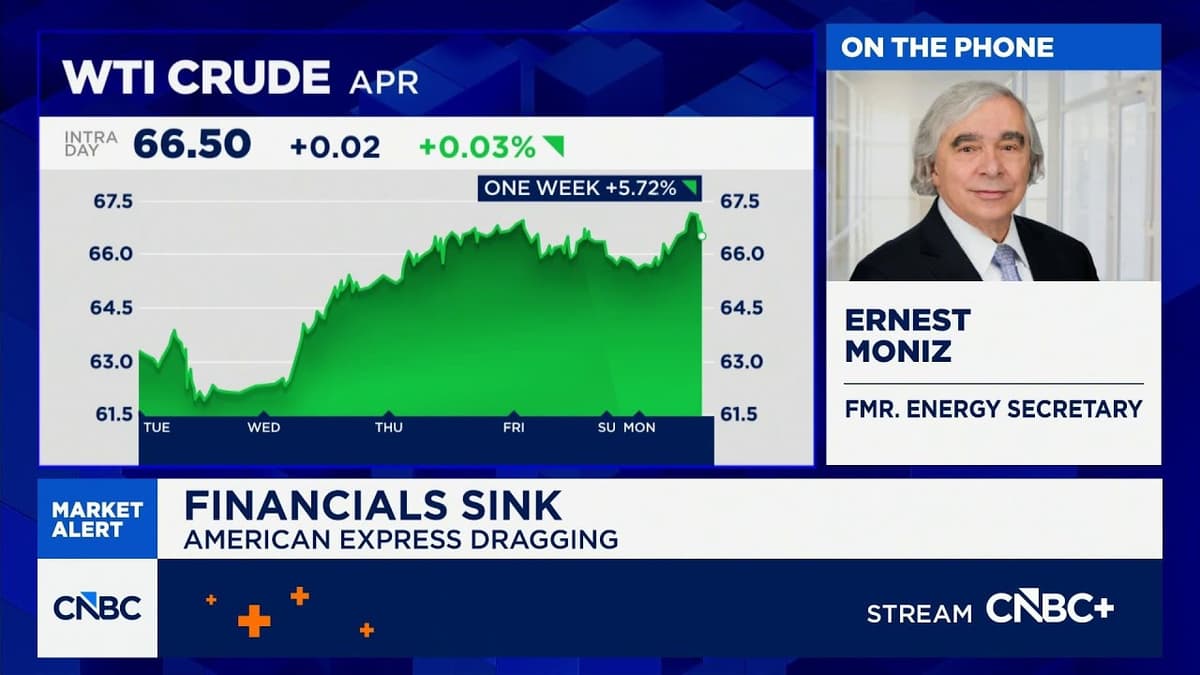
How a Potential U.S. Strike on Iran Could Affect Oil Volatility
The video examines how a potential U.S. military strike on Iran could reverberate through global oil markets, focusing on the risk of heightened volatility amid ongoing nuclear negotiations. Former Energy Secretary Ernest Moniz argues that, structurally, the market is currently...
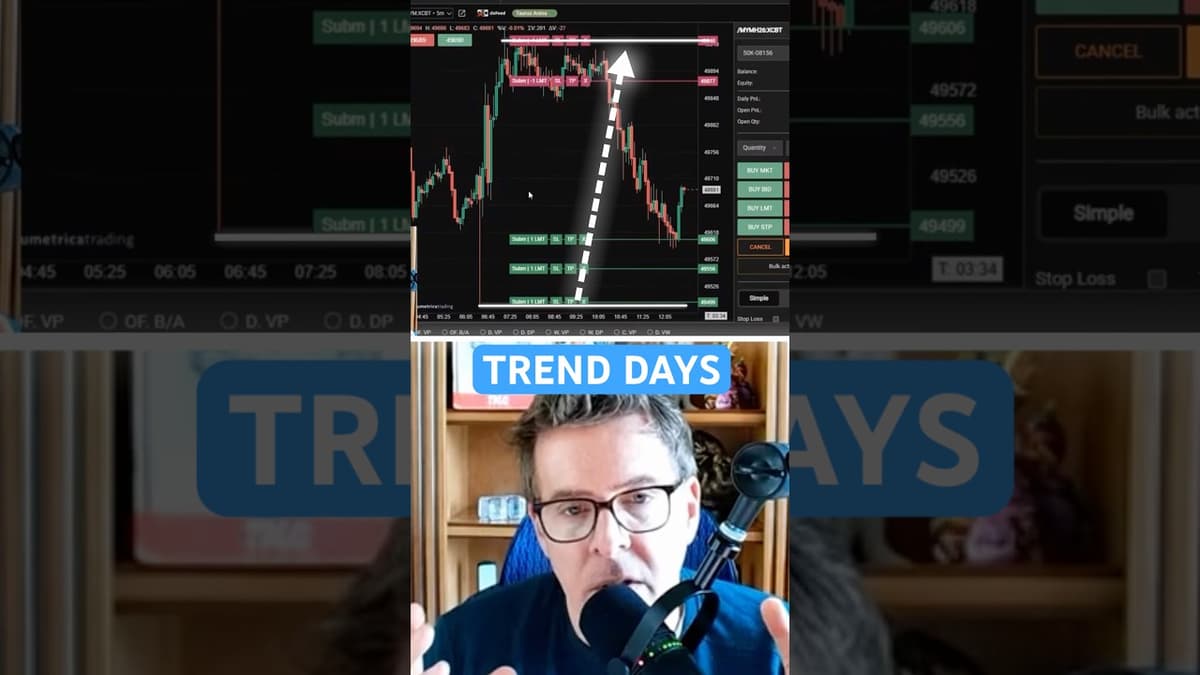
How Trade Trends With Mean Reversion Strategy!
The presenter explains how to distinguish trend days from range days by measuring intraday expected range (example: Dow Jones 78R of 650 points) rather than relying on visual impressions. On range days the recommended tactic is a mean-reversion approach: post...