
Volatility ATR Bands Trading Strategy Backtest Results
The Volatility ATR Bands strategy leverages dynamic price bands based on the Average True Range to capture short‑term explosive moves while keeping market exposure minimal. Backtested over 26 years on the Nasdaq‑100, it delivered a 12.5% annualized return, outperforming the index’s 9% buy‑and‑hold performance. The system trades roughly eight times per year, remaining invested only about 11% of the time and limiting drawdowns to 18% even during the 2008 crisis. Similar results were observed on the S&P 500 and sector ETFs, with average trade gains of around 1%.

Elliott Wave Analysis of EURUSD – March 23rd, 2026
EURUSD surged over 150 pips after the European Central Bank signaled readiness to resume rate‑hike discussions as early as April, reflecting persistent inflation pressures. The ECB’s hawkish pivot quickly lifted the euro against the dollar, underscoring the power of central‑bank...

How Often Do U.S. Stock Market Corrections Evolve Into Bear Markets?
Larry Greenberg examines how often S&P 500 corrections—defined as 10% declines—turn into bear markets, which require a 20% drop. Since 1929, 34 of 56 corrections failed to become bears, meaning most corrections are short‑lived. The analysis notes an average 18% intra‑year...

Stocks Close the Day Lower. Dow -1.0%. S&P -1.5% Nasdaq -2.0
U.S. equity markets closed lower on the day, with the Dow down 1.0%, the S&P 500 down 1.5% and the Nasdaq slipping 2.0%. All three benchmarks finished the session beneath their 200‑day moving averages, a technical signal of sustained weakness....

Indicator of the Day (Video): Nasdaq – Declining Issues TRIX
The Nasdaq Declining Issues TRIX indicator measures momentum in the number of Nasdaq stocks closing lower than the previous session, using a triple‑exponential moving average to smooth out noise. Recent data shows the TRIX has slipped below zero, indicating bearish...

When the Market’s Most Important Average Falls: The “200-Day” Liquidation:
Major U.S. indices have closed below their 200‑day moving averages for the first time since the 2025 rally, prompting a coordinated sell‑off. The breach activated systematic strategies—CTAs, risk‑parity and momentum funds—leading to rapid de‑grossing and a sharp liquidity contraction. With...

Defensive Tide Rising
Three of four intermarket signals have turned risk‑off as utilities outperform the S&P 500 and Treasuries attract safe‑haven flows. The S&P 500 slipped below its 200‑day moving average, triggering a shift from leveraged SSO to plain SPY exposure. Meanwhile, gold’s...

A Mag7 Stock Holding Strong, an Industrial Breakout, a Defense Trade and a Biotech
The article from TrendInvestorPro is essentially a login and subscription prompt rather than a traditional news piece. It highlights the platform's offering of systematic trading strategies, momentum scores, and video tutorials for stocks and ETFs. No substantive market data or...
Multi-Timeframe Analysis And Strategy
Multi‑timeframe analysis pairs a higher‑level chart to set market direction with a lower‑level chart to time entries and exits. The approach was backtested on the XLP consumer‑staples ETF, using a 250‑day, 22‑day and three‑day pullback filter, resulting in 316 trades....

MSTR - Could Wave C Take It to New ATH?
The blog post by Henrik Zeberg questions whether MicroStrategy’s upcoming “Wave C” capital raise could propel the stock to a new all‑time high. It references the company’s previous financing waves, which together raised roughly $2.2 billion and helped fund its aggressive Bitcoin...

🎯 Take Profit Alert On Open Cash Secured Puts
The author is closing three cash‑secured put positions on Rocket Lab (RKLB), Oklo (OKLO) and Symbotic (SYM) after capturing the majority of the premiums. Each trade shows over 85% premium collected, with RKLB at 90.77% and a 10‑day expiry, OKLO...

Where Is Money Flowing Today?
The latest Finviz heatmap shows capital gravitating toward technology and consumer discretionary stocks, while energy and utilities lag behind. Sector performance is uneven, with tech leading double‑digit gains and financials posting modest upside. Overall market breadth is narrowing, indicating that...

Indicator of the Day (Video): S&P 100 Stocks Above the 200 Day MA
The latest Indicator of the Day shows that the majority of S&P 100 constituents are trading above their 200‑day moving average. This technical signal suggests a broad‑based bullish bias across large‑cap U.S. equities. The chart spans March 2024 to March...

Goldman Sachs Says Hedge Funds Aggressively Shorting Financial Stocks:
Goldman Sachs' prime brokerage report shows hedge funds are aggressively shorting financial stocks, making the sector the most shorted in hedge fund portfolios this year. Global funds have net sold banks, insurers and fintech firms at the fastest pace observed...

Where Is Money Flowing Today?
The Finviz treemap visualizes today’s stock market activity by mapping each listed company to a square whose size reflects market capitalization and whose color shows intraday price movement. Green squares indicate stocks gaining value, while red squares denote declines. The...

Vol Street Journal™ :: Episode 17
Episode 17 of the Vol Street Journal examines the "Art of the Tell" – subtle market signals that precede regime shifts. It highlights a VIX/VVIX divergence where the S&P 500 posted a lower low while volatility indices stayed subdued, and...
🛰️ AST SpaceMobile ($ASTS) Deep Dive
AST SpaceMobile’s shares have surged from under $20 to a market capitalization above $30 billion, drawing heightened attention from hedge funds and analysts. Recent filings show Cantor Fitzgerald increased its stake by roughly 140%, a rare move for a company still...

Indicator of the Day (Video): Health Care Advance Decline Percent
The Indicator of the Day highlights the Health Care Advance‑Decline Percent, a breadth metric tracking the proportion of advancing versus declining stocks within the health‑care sector. The accompanying chart shows the daily advance‑decline ratio alongside the XLV ETF price trend,...
Weekly S&P500 ChartStorm - 15 March 2026
The latest ChartStorm weekly review finds the S&P 500 entrenched in bearish technical territory, yet market metrics indicate an oversold condition that could set the stage for a short‑term rebound. Historical patterns suggest rebounds often follow similar dips, offering a glimmer...
Reversal Day Strategy For The Markets
The article outlines a bullish reversal‑day trading model that enters long positions when a lower low coincides with a higher close and the 5‑day RSI falls below 35. Applied to the gold ETF GLD, the backtest shows an average 1.5%...
The IBS Indicator: The Powerful Indicator You Have Never Heard Of
The Internal Bar Strength (IBS) indicator measures a stock’s closing price relative to its daily range, oscillating between 0 and 1. A low IBS suggests the close is near the day’s low (oversold), while a high IBS indicates a close...

The Bespoke Report – 3/13/26 – A Sell-Off So Steep, Investors Won’t Sell
The Bespoke Report highlighted a sharp market sell‑off, with the S&P 500 registering an extreme oversold reading while still hovering near record highs. This technical divergence suggests a fragile equilibrium: prices could tumble further to align with the oversold signal, or...
💡Trade Idea for Friday, March 13, 2026
A trader is initiating a cash‑secured put on a stock that has recently pulled back after a strong uptrend. Technical analysis shows the price holding above its longer‑term trend line while momentum indicators are stabilizing, suggesting a lower‑risk entry point....

Indicator of the Day (Video): Pring European Diffusion Indicator
Hedge Fund Tips released a short video spotlighting the Pring European Diffusion Indicator (PRDIFEUR) as its Indicator of the Day. The chart dated March 12, 2026 visualizes the indicator’s line movement alongside the broader IEUR index. PRDIFEUR gauges the diffusion of price...
🌍 6,232 Subscribers Across 134 Countries
The newsletter announced that its subscriber base has grown to 6,232 members spanning 134 countries, with over 1,200 new sign‑ups in the past month. It promotes a disciplined Elliott Wave 2.0 framework that delivers more than 45 structured video updates...

Gold Daily Call for March 13th, 2026
Gold prices are hovering near $5,055, with technical analysis suggesting a possible rebound to $5,100‑$5,120 if the level holds. A soft buy signal from the 4‑hour stochastic indicator supports the upside, but recent repeated failures indicate waning momentum. Oil continues...

The USD Is Mixed as the Market Prepares for the North American Session
The U.S. dollar opened the North American session mixed, firming against the euro and pound while slipping against the yen after testing 2026 highs. Technical analysis highlights key support and resistance levels on EUR/USD, GBP/USD and USD/JPY as traders brace...

Dollar Takes over From Gold for Now
Gold is losing its traditional safe‑haven status as it increasingly moves in tandem with equity indices and opposite the U.S. dollar. The dollar’s recent strength has turned it into the preferred short‑term store of value, leaving gold vulnerable to equity...
XRP - The 2 Paths Are Clear
XRP’s price action has been dominated by corrective phases since 2022, with impulse moves now fading rapidly. The latest technical analysis indicates the market is transitioning into an allocation phase, where investors begin positioning for longer‑term moves. The author provides...
Hedge Fund Trade Tip (PIN) – Position Idea Notification
The Hedge Fund Trade Tip (PIN) post is gated behind a login, offering no public text beyond a membership prompt. An accompanying chart tracks a stock’s price from April 2025 to March 2026, showing early volatility, a sharp fall in late fall...
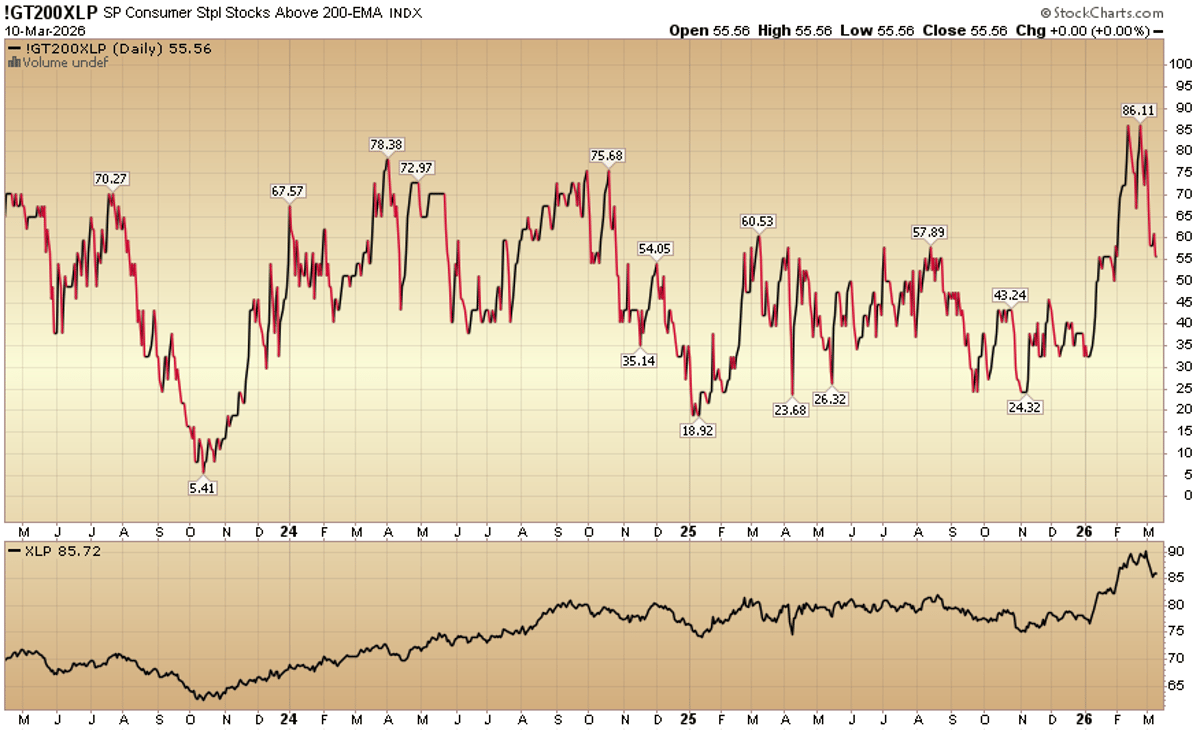
Indicator of the Day (Video): S&P Consumer Staples Stocks Above 200 EMA
The S&P Consumer Staples Index has moved above its 200‑day exponential moving average, a key technical signal often interpreted as a bullish trend. The crossover suggests that the defensive sector is gaining upward momentum after a period of volatility. Investors...

Oil Markets Remain on Edge – Two Healthcare Stocks with Leading Uptrends
The piece titled “Oil Markets Remain on Edge – Two Healthcare Stocks with Leading Uptrends” is hosted on TrendInvestorPro but is locked behind a subscription login, offering only a brief promotional banner and no substantive market data. No details on...

Elliott Wave Update of USDCAD – March 11th, 2026
The latest Elliott Wave update notes that USDCAD has remained virtually unchanged this week despite extreme volatility in crude‑oil prices. Analysts highlight a critical resistance level around 1.3800 that could dictate short‑term direction. While oil surged 36% following geopolitical tensions,...

Is the Bottom In For SPX? March 11 Plan
The newsletter dissects recent S&P 500 E‑mini (ES) moves, labeling rapid sell‑offs as "elevator down" events that trigger failed breakdowns and short squeezes. After a sharp dip to 6588 on Sunday, the index rebounded to 6850, repeatedly testing the 6778‑82...

The January Effect 2026 Edition
The January Effect 2026 Edition revisits the century‑old seasonal rally that typically lifts equities and certain currency pairs in the first weeks of the year. By analysing price action from the 2025‑2026 transition, the piece highlights a pronounced EUR/USD volatility...

A Range Like Few Others
Volatility has surged across markets, driven by geopolitical sparks such as the Iran situation. Crude oil experienced an extraordinary intraday swing, with WTI’s high‑low range topping 40% yesterday—the second‑largest percentage move since the 2020 price collapse. Today the energy sector...

SpotGamma Flags the Breakdown in Strategy (MSTR) — Traders Capture 5:1 to 9:1 Downside Move
SpotGamma’s Compass, Equity Hub, and HIRO flow tools identified a bearish breakdown in MicroStrategy (MSTR) after the stock slipped below the critical $165 call wall, a key gamma level. The breach triggered aggressive put buying and call selling, prompting market...
💡Trade Idea for Monday March 9, 2026
The company is aggressively expanding, targeting over 300 locations system‑wide by 2026, with early test markets delivering higher average ticket sizes, increased transaction volume, and a near‑4% lift in comparable sales. Technically, the stock has pulled back from a recent...

EURUSD Tecnicals: EURUSD Rebounds as Oil Eases and Markets Stabilize
Crude oil slipped below $100 as speculation grew that G7 ministers may tap strategic reserves, calming inflation worries. U.S. 10‑year Treasury yields hovered near 4.135%, barely up, while equities modestly recovered from recent lows. The euro‑dollar pair rose to an...

Mastering Market Moves with SpotGamma Insights: Deep Dives Into Tesla, Nvidia, Microsoft, JP Morgan, and S&P Trade Setups Using Gamma...
SpotGamma published a deep‑dive analysis of trade setups for Tesla, Nvidia, Microsoft, JP Morgan and the S&P 500, centering on option‑gamma exposure and realized volatility. The report maps where gamma concentrations are building and how volatility spikes can flag short‑term price moves....
The Good News? Crude Oil Is -16% Off the high.The Bad News? It Is 10% Higher on the Day
G7 finance ministers said they will keep monitoring oil markets and stand ready to release strategic petroleum reserves if needed. Crude oil peaked at $119.48, fell to $96.24, and now trades near $100. The price is 16% lower than its...

Indicator of the Day (Video): NASDAQ – Eakle Advance Decline Index
The Indicator of the Day highlights the NASDAQ Eakle Advance‑Decline Index, a breadth metric that compares the number of advancing versus declining stocks on the Nasdaq exchange. Recent chart data shows the index climbing even as the Nasdaq Composite has...

Elliott Wave Analysis of USDCAD – March 9th, 2026
USDCAD encountered firm resistance around the 1.3750 mark, prompting a pullback that resulted in its second consecutive weekly decline. The price weakness coincided with escalating strikes across the Middle East, which have amplified global risk aversion. An Elliott Wave assessment...

Where Is Money Flowing Today?
The latest Finviz heat‑map shows money gravitating toward energy and dividend‑heavy defensive sectors, while technology and consumer discretionary stocks lag. Energy stocks posted double‑digit gains, pulling the broader market higher. Financials have steadied after recent turbulence, and overall market breadth...

The Market Brief
The market is eyeing the upcoming Non‑Farm Payroll and U.S. retail‑sales releases after a week of volatility sparked by the U.S.–Iran conflict. Geopolitical tension has nudged the S&P 500 outlook toward the downside, yet it has not yet altered payroll expectations,...

Options Trading Using Econometric Models
A 2020 study applied an ARIMA(1,1,1) model to forecast the S&P 500 index for options trading, comparing it against a GARCH(1,1) benchmark. The authors bought undervalued calls and sold overvalued puts based on forecast‑price versus strike‑price differentials. Results showed ARIMA...

The Small-Cap Rotation Is Real
Small‑cap indices have surged, with the S&P 600 up about 9% YTD and the S&P 400 gaining over 8%, while the S&P 500 remains flat. The rally is tied to the Federal Reserve’s easing cycle, which has lowered rates to 3.5‑3.75% and eased...

Nikkei Futures Are up 3.8%
Nikkei futures surged 3.8% to 56,310, reversing a 3.6% drop the day before. The index remains up 7.7% year‑to‑date and 45% over the past year, reflecting strong investor appetite for low‑multiple Japanese stocks and tech exposure. The Bank of Japan...

Where Is Money Flowing Today?
The latest Finviz heat‑map shows money flowing primarily into technology stocks, which dominate the green‑shaded areas, while energy and utilities remain mixed or red. Mid‑cap and small‑cap names are experiencing notable speculative inflows, contrasting with lagging performance in financials. Overall...