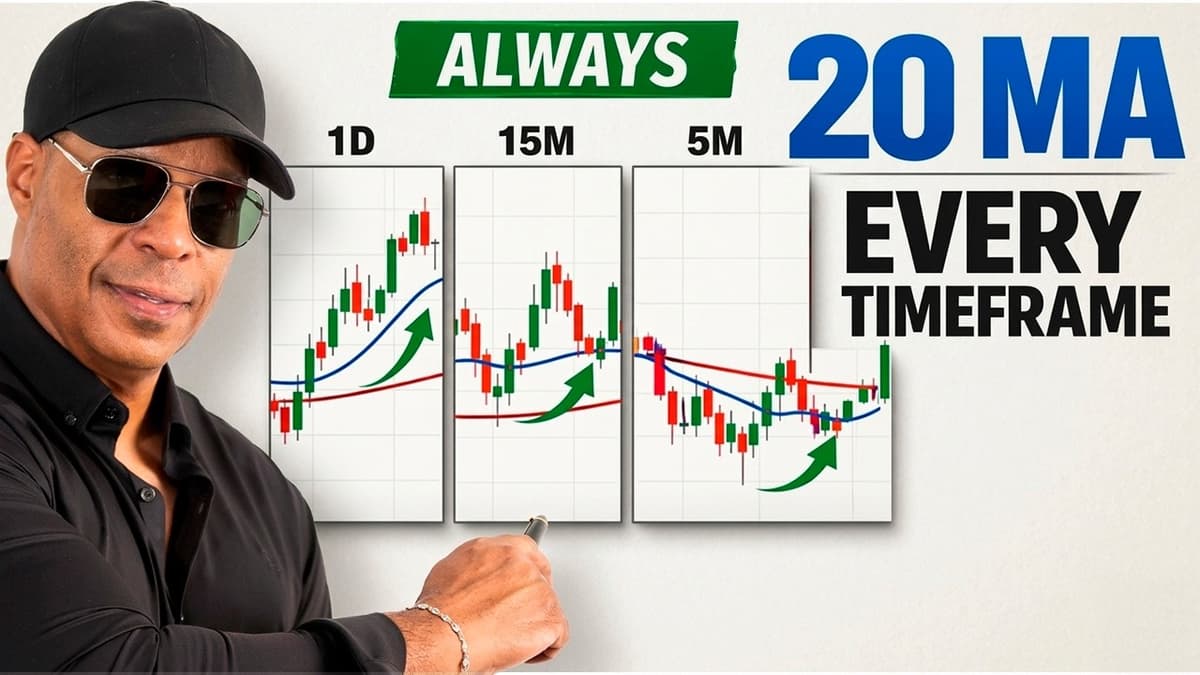
Why the 20 SMA Works on ANY Timeframe
The video argues that the 20‑period simple moving average (SMA) is a reliable directional filter regardless of chart interval, demonstrating the claim on daily, 15‑minute and five‑minute charts. Oliver shows that price repeatedly respects the 20 SMA, pulling back when it meets the 200 SMA and resuming the trend once the 20 is intact. He stresses that 95 % of the time traders should move with the slope of the 20; a rising 20 signals buying on pullbacks, a falling 20 signals selling. He cites that 86 % of his firm’s losing trades were taken against the 20 SMA, and warns that stocks flirting with the 50 SMA are typically weaker because they must first breach the 20. The “narrow vs wide” market states and the “Fab‑4” zones illustrate how the SMA marks transitions between fear and greed. Because the 20 SMA behaves consistently across equities, forex, crypto and any timeframe, traders can adopt a single, simple rule‑set for entry, profit‑taking and risk management, potentially reducing loss frequency and improving performance.

META Broken Wing Butterfly | High Probability Setup
In the video, Simpler Trading’s director of risk tolerance, Alison Nostrander, walks viewers through a high‑probability options setup on Meta Platforms (META), focusing on a debit broken‑wing butterfly that expires in May. She points out that META’s daily chart remains choppy,...

Berman's Call for Monday, Mar. 9, 2026
Larry Berman hosts a weekly "Berman's Call" on BNN Bloomberg, fielding live questions and emails from viewers about market‑making dynamics and hot‑stock technical analysis. The segment, aired every Monday, offers real‑time commentary and actionable insights for Canadian investors. BNN Bloomberg...

ONLY 2 Timeframes You Need For Trend Pullbacks Strategy
The video walks viewers through a trend‑pullback trade on EUR/JPY that earned 86 pips with a 1.75‑to‑1 risk‑to‑reward ratio, using only the 1‑hour and 15‑minute charts. Mariana explains that the method hinges on confirming the overall market direction on the...
F&O Market Update | Nifty Range 24,000–24,500, Bank Nifty Shows Strength | Business News | ET Now
The ET Now segment delivered a rapid F&O market snapshot, highlighting today’s Nifty surge and the expected trading corridor. Nifty rose roughly 8% in the session, trading at an 82‑rupee futures premium, while open interest grew 1.7% mainly through short positions....

SMART MONEY SECRET: How To Fade the Market Panic (My Live $1M Portfolio Revealed!) 📉
In the latest verifiedinvesting.com video, chief market strategist Gareth Soloway dissects the recent oil rally that surged past $120 per barrel before collapsing below $95. He frames the move as a textbook case of panic‑driven pricing and uses it to...
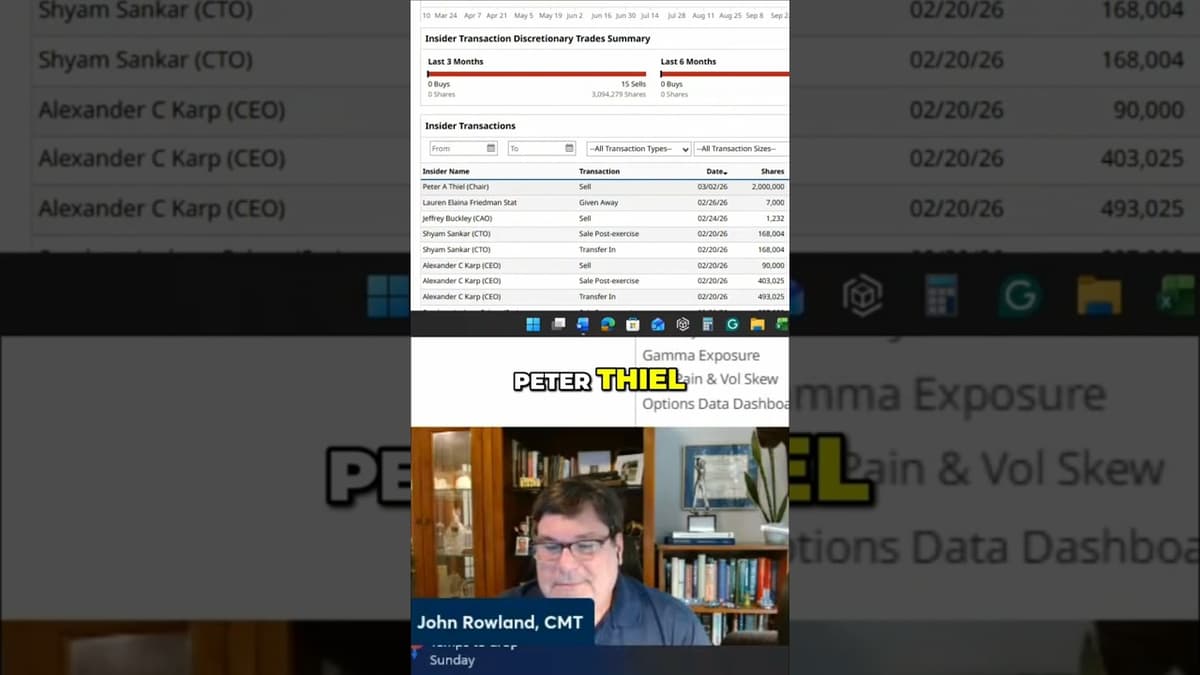
Palantir Stock Alert: Peter Thiel Dumps $289M! What Now? #barchart #stocks #trading #pltr
The video centers on Peter Thiel’s recent sale of roughly $289 million worth of Palantir (PLTR) stock, prompting a fresh “stock alert” for investors and traders. The hosts note that insider selling typically carries more weight than buying, especially when the stock...
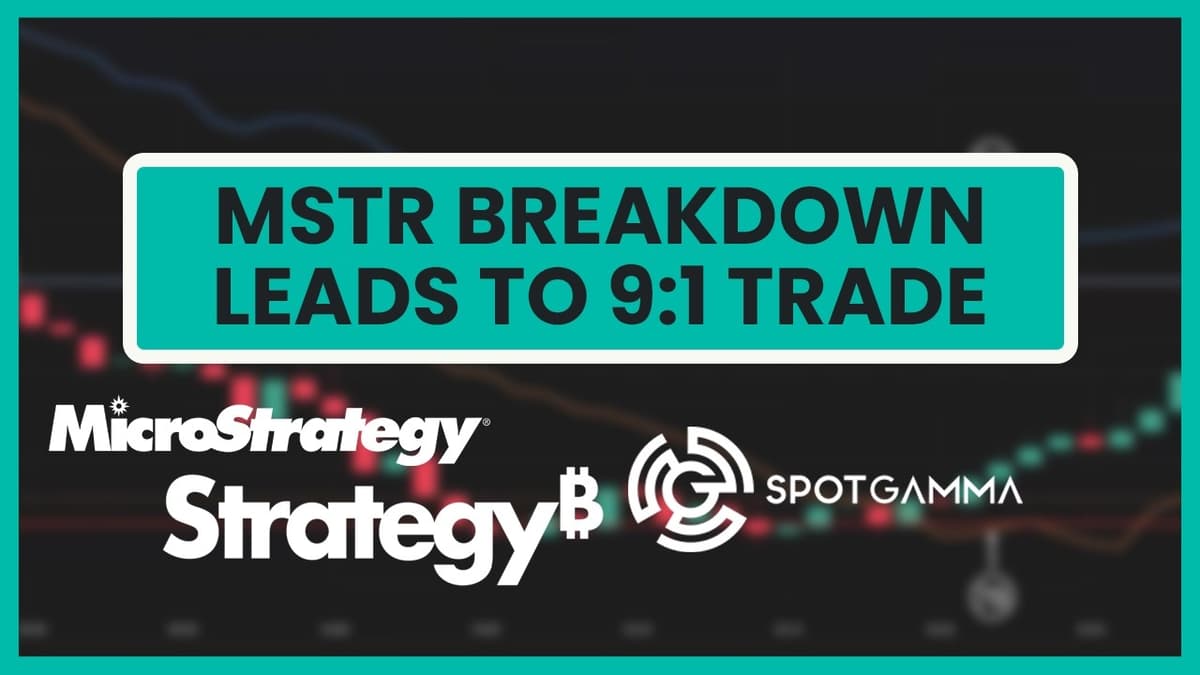
How SpotGamma Nailed the MSTR (Strategy) Breakdown for a 9:1 Trade
The video walks through a SpotGamma case study that leveraged proprietary gamma‑based tools to execute an intraday short on MicroStrategy (MSTR) on January 9. Doug Ples explains how he combined the Compass guided view, the put‑and‑call impact chart, and the real‑time...

The COB: Market Mayhem
Global markets tumbled Monday as a widening US–Israel–Iran conflict sent oil spiking toward and above $100 a barrel—at one point up about 25%—and knocked risk sentiment across equities and bonds. Australia’s benchmark slid as much as 4% intraday and was...
S&P 500 DROPS As Middle East Tensions ESCALATE #trading #stockmarket #analysis
The video discusses the recent drop in the S&P 500 as tensions in the Middle East intensify, with the presenter outlining his trading stance and technical outlook. He notes the index has slipped roughly 5% from recent highs, still above the...
From Journalist To Full-Time Trader: How I Did It (Glen Goodman)
Glen Goodman, a former BBC and ITV business correspondent, recounts his evolution from reporting on markets to trading them full‑time. After two decades in journalism, he leveraged his economic insight to experiment with stocks during the dot‑com boom, eventually discovering...
Why SPY and RSP Are Moving Differently Right Now
The video examines why the equal‑weighted S&P 500 ETF RSP has begun to diverge from the market‑cap weighted SPY, highlighting record inflows into RSP as investors seek to diminish exposure to the dominant “MAG‑7” stocks. The hosts explain that SPY’s weighting...

Tech Corner: NVDA Core of AI Trade
George Tillis of the Schwab Network opened the segment by highlighting Nvidia’s latest earnings beat, noting a 73% year‑over‑year revenue surge to $68.1 billion in Q4 2025 and earnings of $162 per share, the highest in the company’s history. The report underscored...

THE TRAP DOOR OPENS: S&P 500 Breaks Key Support (Stagflation Shock) 🚨
The S&P 500 slipped through the 6,790 support threshold, igniting market anxiety and prompting analysts to warn of a looming stagflation shock. A surprising -92,000 drop in non‑farm payrolls and a rising unemployment rate underscore a weakening labor market, while...

Massive Setups Forming in Forex & Oil Right Now (Weekend Analysis)
In this weekend briefing, TierOneTrading dissects nine key markets—including EURUSD, EURJPY, USDJPY, USDCAD, AUDCAD, EURCAD, CADJPY, the DAX and crude oil—to pinpoint high‑probability setups for the coming week. The analysis showcases advanced harmonic patterns such as Gartley, Cypher and Bat,...
The Bearish SPX Trade Setup I’m Watching Right Now
Heather opens the video by explaining her weekly‑quant‑pivot framework, which treats the H1/L1 bands as a "sandbox" where price typically closes. She applies this to both QQQ and the S&P 500, using the breakout of H1 or L1 as triggers for...
Oil Tags $91, VIX Spikes Towards 30, and the Software Bounce Looks Like a Trap
The weekly market wrap centers on three headline drivers: crude oil surged to $91 a barrel amid Middle‑East tensions, the VIX nudged toward the 30‑point mark, and a sharp software bounce raised concerns of a fleeting rally. All major...
Most SMC Traders FAIL Because They Skip This
The video explains how Smart Money Concepts (SMC) traders can simplify their analysis by clearly separating external price action—overall market structure—from internal price action—short‑term moves within that structure. Justin Bennett walks through a DXY chart on multiple timeframes, showing how...

Did the Bear Market Begin?
The hosts debate whether a bear market has begun, noting that the S&P 500 has been confined to a tight 3% trading range despite dramatic headlines such as a 31% weekly oil surge and geopolitical tension. They point to the recent...
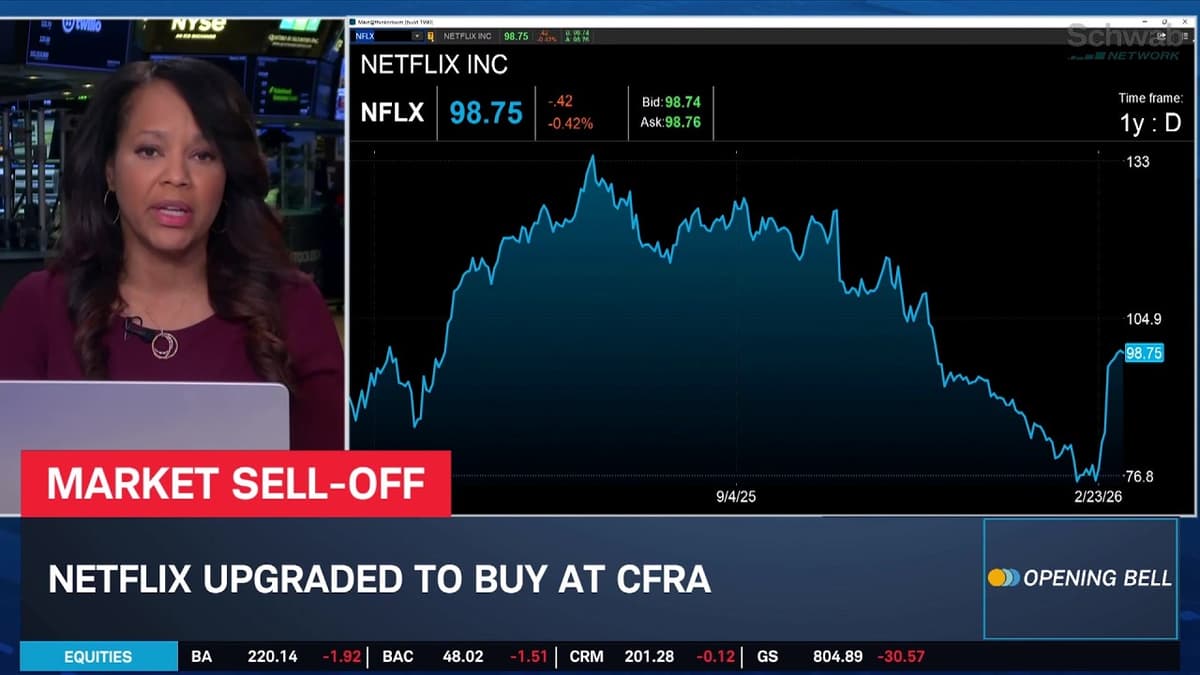
Friday's Morning Movers: NFLX Upgrade, TTD Downgrade, GAP Misses Earnings
The segment opened with Gap Inc.’s earnings miss, followed by a CFRA upgrade on Netflix and divergent analyst views on The Trade Desk. Gap reported Q4 revenue of $4.236 billion versus $4.244 billion expected and EPS of $0.45, missing both forecasts. Winter storms...

Sectors to Watch (Industrials, Oil, Tech) 📈 #Shorts
The speaker outlines a pronounced market rotation since the start of the year, moving capital away from high‑growth technology stocks toward industrials, infrastructure projects, and raw‑material sectors. He notes that while premium tech names like Microsoft remain attractive, short‑term upside appears...
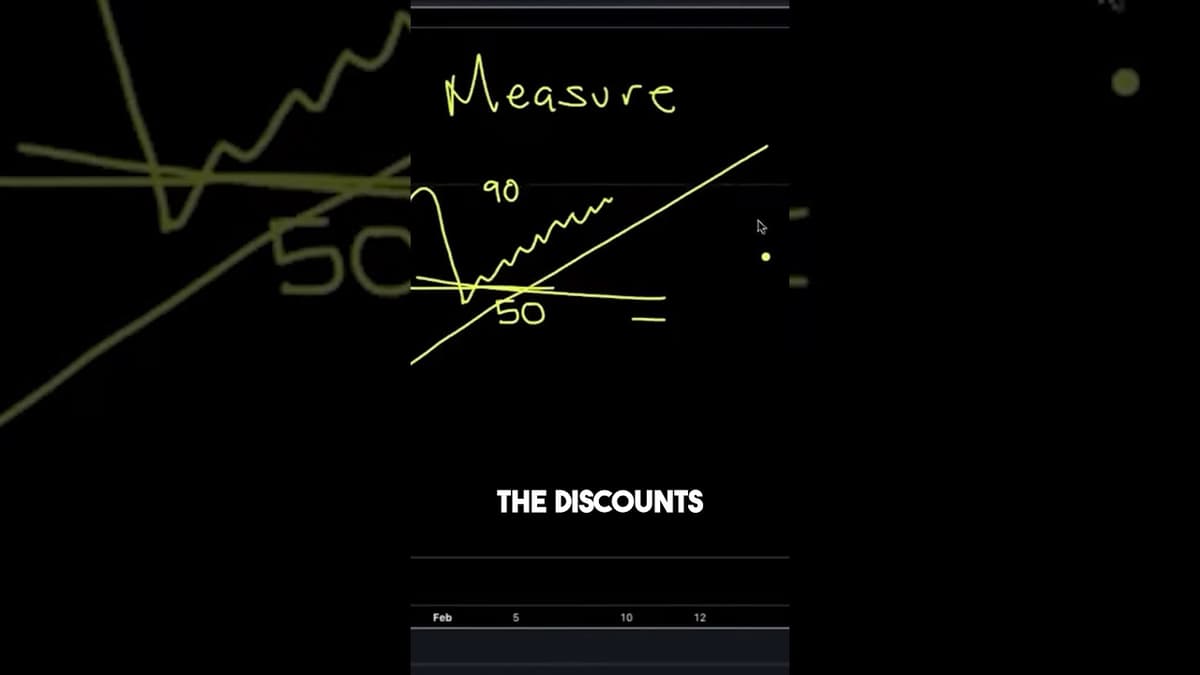
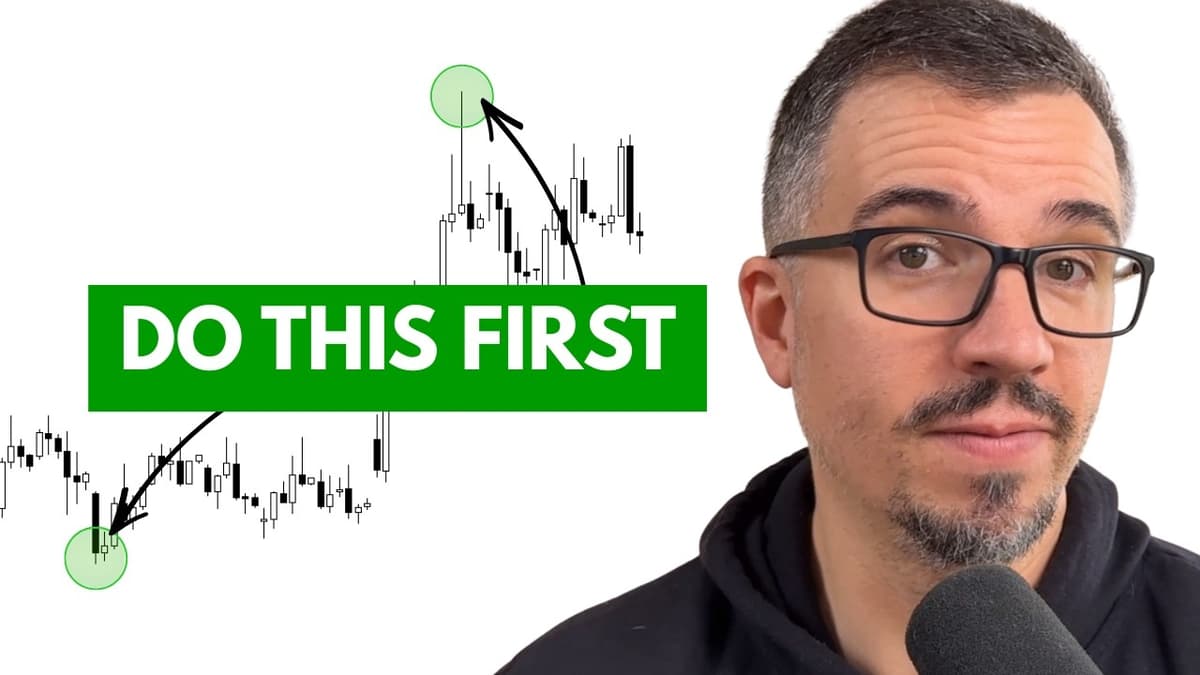
Price Action Is Nothing But Deal Hunting
The video frames price action as pure deal hunting, urging viewers to treat every tick as a signal of whether a discount is genuine or fleeting. The speaker argues that the only way to profit is to watch how quickly...
Gold Chart Analysis Today: Key Support Levels Based on Elliott Wave Analysis
The latest video delivers an Elliott Wave‑based technical breakdown of gold, pinpointing current wave structures and charting key support and resistance zones. Analysts identify a primary support level around $1,950 per ounce and a resistance band near $2,050‑$2,100. They outline...
Scalping for Beginners: What No One Tells You
Scalping is a high‑speed trading style where positions are opened and closed within seconds or minutes, often resulting in dozens of trades per session. Akil Stokes explains the mental discipline, technical precision, and low‑latency infrastructure required for success, while highlighting...
The Bearish Watchlist Traders Should Be Watching Now
In the February wrap‑up, trader Raie outlines a bearish watchlist centered on the NASDAQ, highlighting the index’s overall weakness and the consumer discretionary sector’s pronounced downtrend. He points to persistent red candles, bearish momentum and a multistructure trend as evidence, then...
Iran Uranium Rumor, Hormuz & Anthropic - Mar 5 - Stock Market LIVE, Live Trading, Stock News
A rumor surfaced that Iran may relinquish its uranium stockpiles, while Tehran announced a ban on European and Israeli vessels transiting the Strait of Hormuz, reigniting oil‑supply concerns. Oil futures held gains despite the mixed geopolitical signals. Meanwhile, AI firm...

Forex Day Trading Using Range Bar Charts
TierOneTrading’s video walks viewers through a live EUR/NZD day trade using range‑bar charts, illustrating a three‑step framework: locate market structure, identify the next structural level, and trade the move between them. The presenter highlights how range bars strip out time‑based...

Stocks Roll Over as Bears Gain Edge in Battle for SPX 6800
The S&P 500 index slipped below its recent highs as the market tested the 6,800‑point resistance level. Analysts on the Future of Finance panel highlighted a surge in bearish options flow, with put buying outpacing calls across key strikes. Large‑cap...

Scalping Trading Psychology Lessons
The video features full‑time scalper Jean‑François Boucher sharing five psychology‑focused lessons for high‑frequency traders. He argues that a trader’s edge stems more from mastering the nervous system than from perfecting chart patterns, and he outlines concrete habits to tighten that...

Everyone's Selling Amazon — Here's Why I'm Selling Puts
The video explains why the presenter is selling Amazon put options despite a wave of bearish sentiment, insider selling, and a recent earnings miss that pushed the stock below its $212 level. He argues that insider sales are often driven...
![Hidden Mag 7 Buy Zones That Trigger Bounces [LIVE]](/cdn-cgi/image/width=1200,quality=75,format=auto,fit=cover/https://i.ytimg.com/vi/66uDxr2sUjY/maxresdefault.jpg)
Hidden Mag 7 Buy Zones That Trigger Bounces [LIVE]
Melissa Beegle demonstrates how price repeatedly rebounds off concealed buy zones across the Magnificent 7 stocks and major indexes. She explains the mechanics behind these zones, showing traders where price is likely to snap back and how to enter with predefined...

Can You Really Predict Market Volatility?
The video tackles a perennial question for traders: can market volatility be predicted? It defines volatility as the magnitude of price swings and distinguishes between calm periods and turbulent bouts, setting the stage for a discussion on forecasting tools. It outlines...
You Might Want To Sell This Stock Soon...
Coinbase stock surged 14% in a single day despite unchanged business fundamentals. The price jump occurred without a corresponding move in Bitcoin, suggesting the rally is driven by market speculation rather than crypto price dynamics. The analyst flags the stock...

The Bounce Is Real. The Rally Is NOT.
During the midweek market update, Trade Brigade highlighted that the recent market bounce is a short‑term technical correction rather than the start of a sustained rally. The hosts dissected the S&P 500, Nasdaq 100, and Russell 2000, identifying key support and resistance levels...
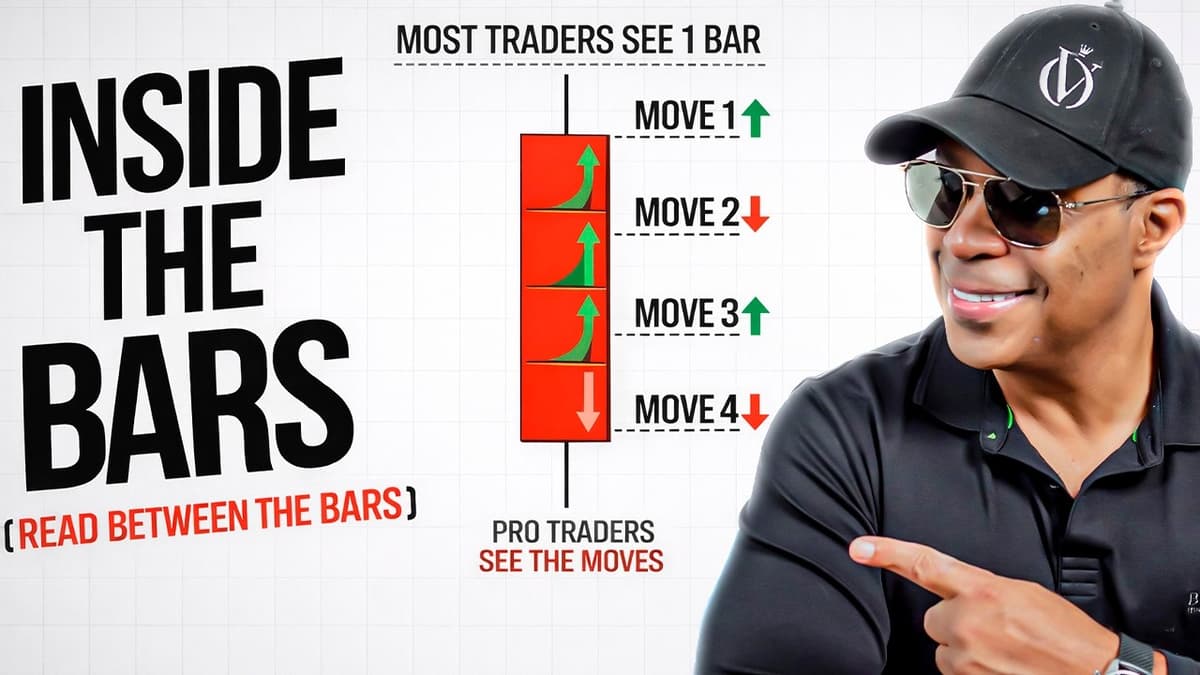
What Most Traders NEVER See Inside a Candle
The video teaches traders to look inside each price candle, treating it as two distinct movements—an initial rise followed by a subsequent fall—rather than a single, static bar. By visualizing the green (up) segment and the red (down) segment separately, the...

Stock Market Today: AVGO Earnings, TSLA New Bull, Bitcoin Rebound Rally #shorts
Nasdaq led a broad market rebound on Thursday, climbing about 1.5% after Tuesday’s sharp sell‑off, while the tech‑heavy index outperformed other gauges. The rally was underpinned by several headline‑making developments, including Broadcom’s after‑hours earnings beat and a $10 billion share‑buyback, Bank...

This VIX Squeeze Could Flip the Tape — Here’s the Trigger
In the latest market recap, Henry highlights a VIX squeeze signal that has been forming for weeks, emphasizing that the index remaining above its rising mean keeps a caution flag raised. He explains that a VIX surge into the 32‑37+...

IRAN RUMOR OF DE-ESCALATION, OIL VOLATILITY - Mar 4 - Stock Market LIVE, Live Trading, Stock News
According to a New York Times report, Iran has initiated back‑channel communications aimed at ending the ongoing war, marking the first positive development in the past 100 hours. The rumor sparked a risk‑off rally, lifting the S&P 500 and pulling down...

EURUSD to See Further Relief Before the Next Drop
EURUSD has bounced off a major higher‑timeframe support zone, with price now trading within the weekly OTE range and staying above the key external low on the daily chart. The 4‑hour chart shows price defending channel support in discount, prompting...

When Fear Hits the Stock Market, Where Can Investors Find Safety? #stocks #trading #barchart
The video discusses investor behavior when fear grips the market, noting that while some flee to cash, others seek sector-specific opportunities. The speaker highlights recent sector performance—energy up ~23%, materials ~24%, consumer staples ~12%—and focuses on healthcare, which is only...
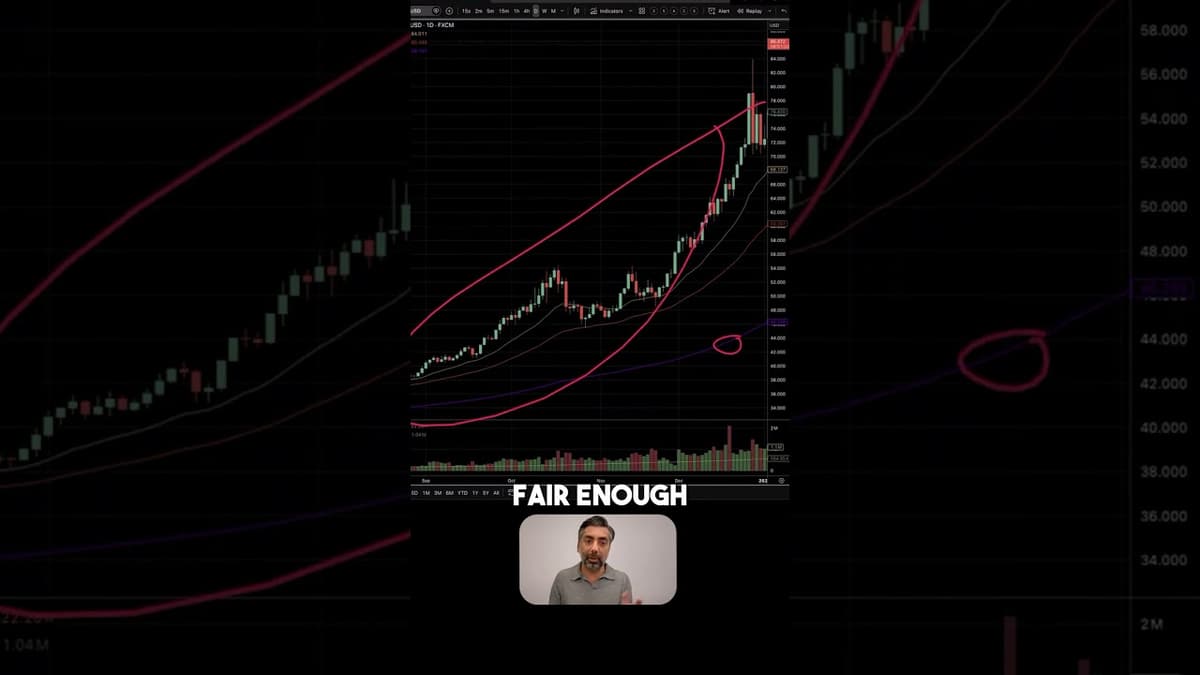
Reversal After Parabolic Move
The video dissects what a sharp reversal looks like after a parabolic price surge, emphasizing the divergence between price action and exponential moving averages (EMAs). It explains that a parabolic move occurs when price climbs far above its 20‑, 50‑,...
Indicators Didn’t Work For My Trading
A trader recounts how adopting the KISS (Keep It Simple Stupid) principle transformed his approach: he cleared cluttered charts of nonessential indicators and now uses only a minimal set that he actually needs. The simplification eliminated information overload, reduced false...

When Short-Term & Long-Term Trades Align… It’s GO Time 🚀📈
The video explains that when a trader's short‑term setup and long‑term market bias point in the same direction, confidence and conviction surge. This alignment stacks probability in the trader's favor, turning a routine trade into a high‑conviction opportunity. The presenter...

Equity Index Futures Print Broad Reversal Intraday. 3/3/26
Equity markets swung dramatically on March 3, with the Nasdaq‑100 and other indices rebounding sharply from session lows. WTI crude spiked toward $78 per barrel before retreating to $73, while gold faced pressure despite a risk‑off backdrop. Banking stocks rallied...

The Hidden Downside Signal That’s Still Active (Moxie)
TG Watkins explains how his proprietary Moxy indicator identified a hidden downside signal months before recent market turbulence. He argues that the traditional "flight to safety" is cracking, signaling a rotation rather than a pure risk‑off sell‑off. The video breaks...

EURUSD Has Hit Our Killzone –But Is It a Buy?
The EUR/USD pair has finally entered the analyst’s predefined killzone, a confluence of prior resistance and a completed AB=CD harmonic pattern. A strong rejection candle at this level signals potential buyer re‑entry, prompting the analyst to await one more confirmation...

1 Minute Scalping Live Trading
The video demonstrates a one‑minute scalping technique performed live on TradingView, directing viewers to the TMAFX platform for execution. It includes affiliate links to the broker, charting service, and a Telegram community for ongoing support. A comprehensive disclaimer clarifies that...

Watch How I Made 5R on This JPY Trade (FULL Tutorial)
The video is marketed as a full tutorial on achieving a 5R profit target on a JPY trade, yet the transcript consists almost entirely of repetitive thank‑you remarks and no substantive trading content. The presenter never outlines the market rationale,...

What's Hot During War #EDV #FRES #PAF #LLOY #JOG #INF #HREE #RBW #IAG #TLW #PXEN
Investors are navigating a volatile market as the Israel‑U.S. strike on Iran sparked immediate sector swings. Energy names such as Tullow Oil and Prospects Energy jumped, buoyed by African assets and a fresh CEO steering European gas projects, while the UK...

Stock Market Today: Strikes in Iran, New NVDA Partnerships, CRWD Upgrade #shorts
Marley Kaden recapped a mixed‑bag trading day where U.S. indices closed modestly higher despite opening under pressure from geopolitical headlines. The Russell 2000 rose about 0.9%, while the Dow slipped just over 0.1%, reflecting divergent sector moves. Energy and defense stocks...