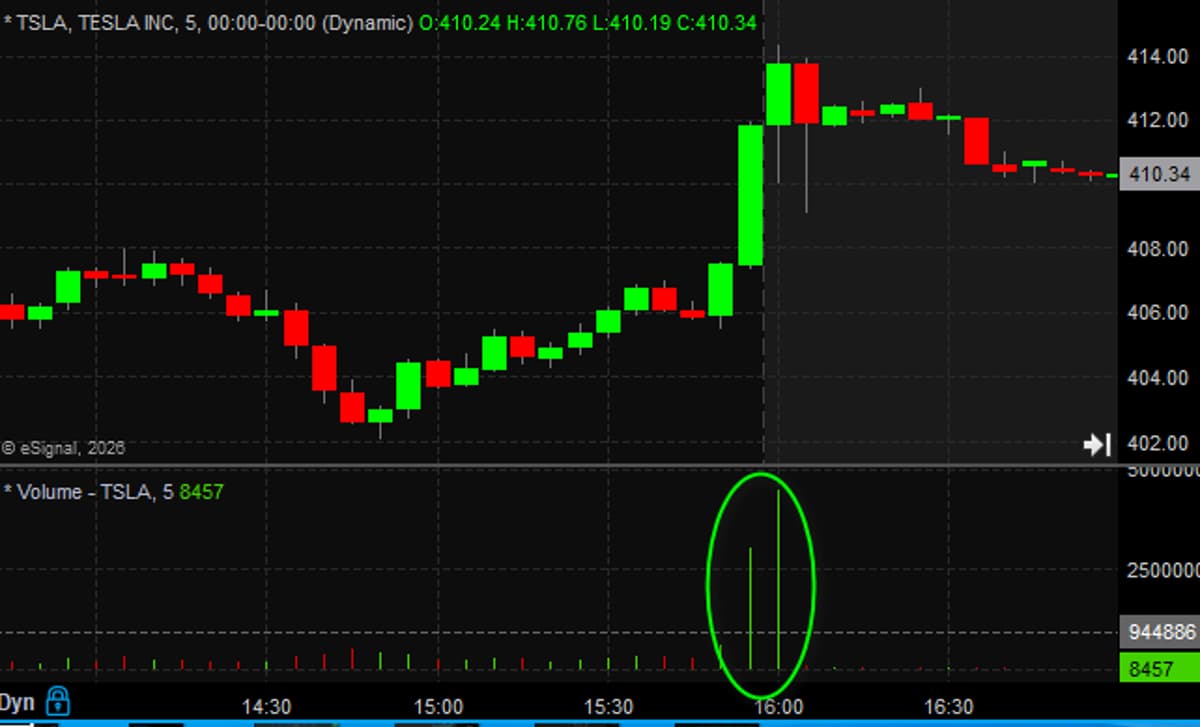
Tesla Sees Back‑to‑back Massive Closing Buy Imbalances
two days in a row very large buy imbalances for the Close in $TSLA. https://t.co/HXj1iy6ECo
Small Loss Turned Profit as AMD Rebounds
Taking this $4 loss near the close yesterday looks genius today with the rebound $AMD
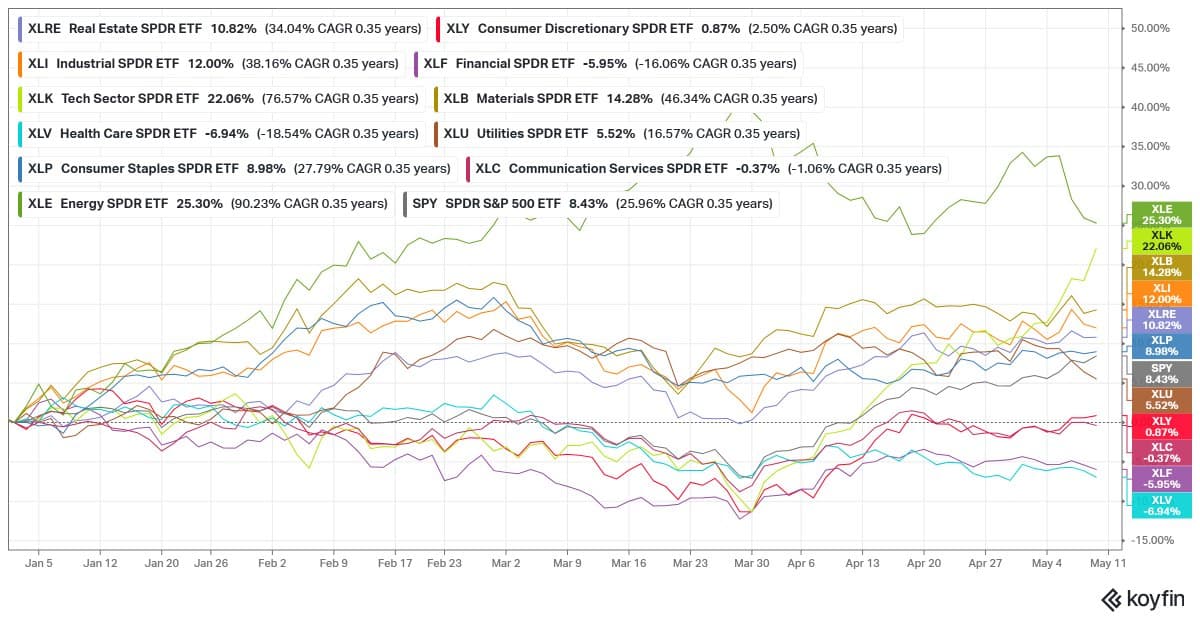
Energy Beats Tech YTD, But Momentum Fades Fast
Energy $XLE still beating Tech $XLK YTD... but those alligator jaws are snapping fast @Koyfincharts https://t.co/LUWxrNi5ax
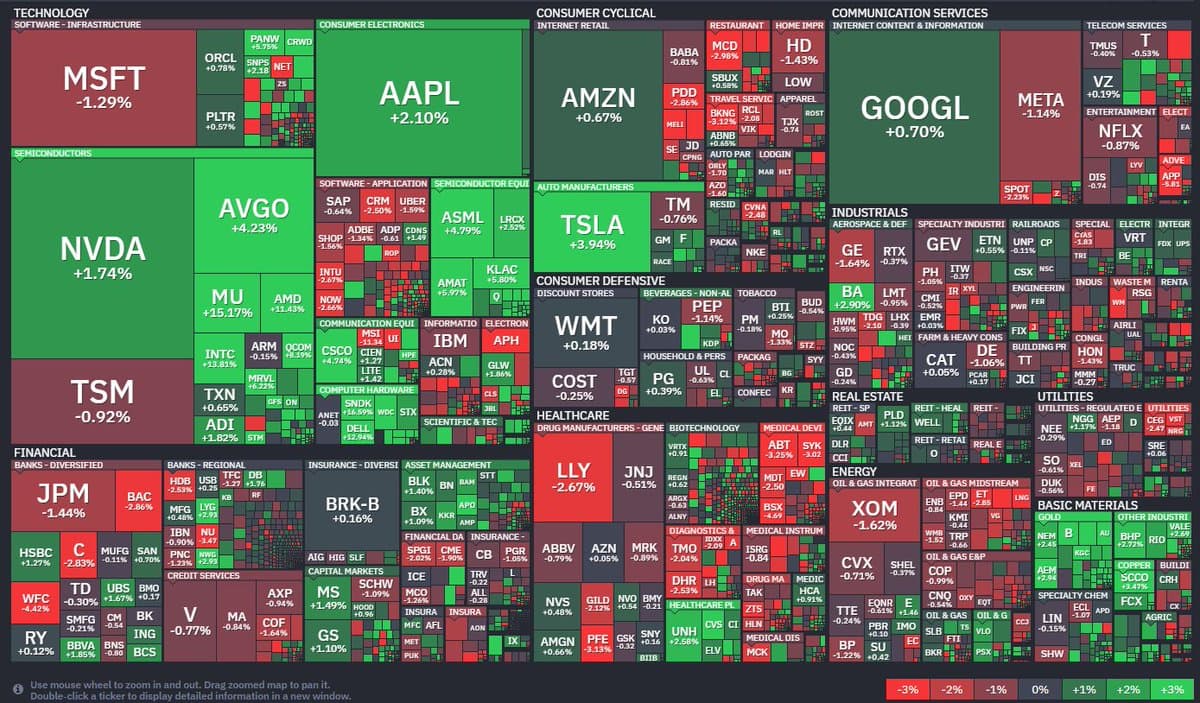
Tesla Tops Mag 7 Weekly Gains, Others Surge
$TSLA best Mag 7 name this week.. +4% $MU +15% $AMD +11% $INTC +14% $SNDK +17% $DELL +13% https://t.co/LRKlVsPGlU
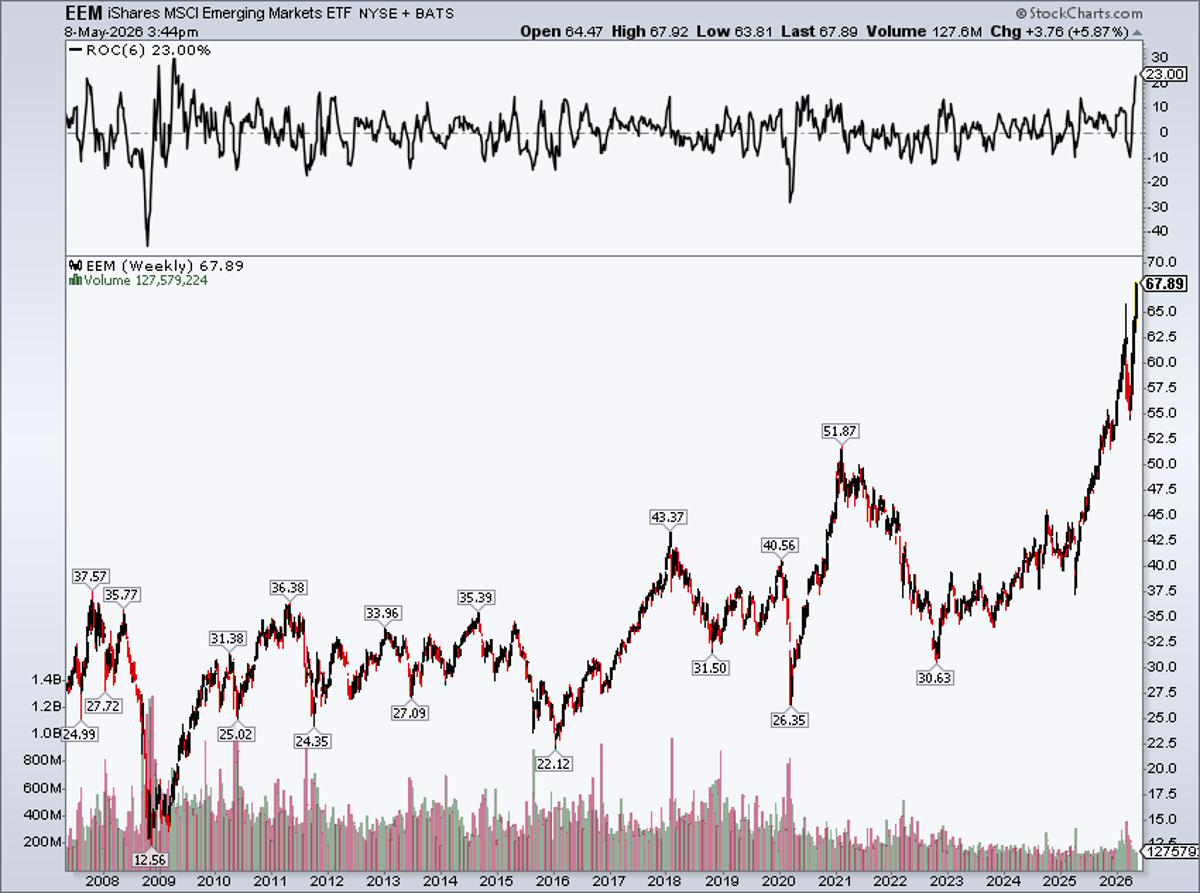
EEM Surges 23% in Six Weeks, Breakout Confirmed
$EEM +23% last 6 weeks... best rally in 17 years... I'd say EM finally broke out @stockcharts https://t.co/AqKJclrdRe
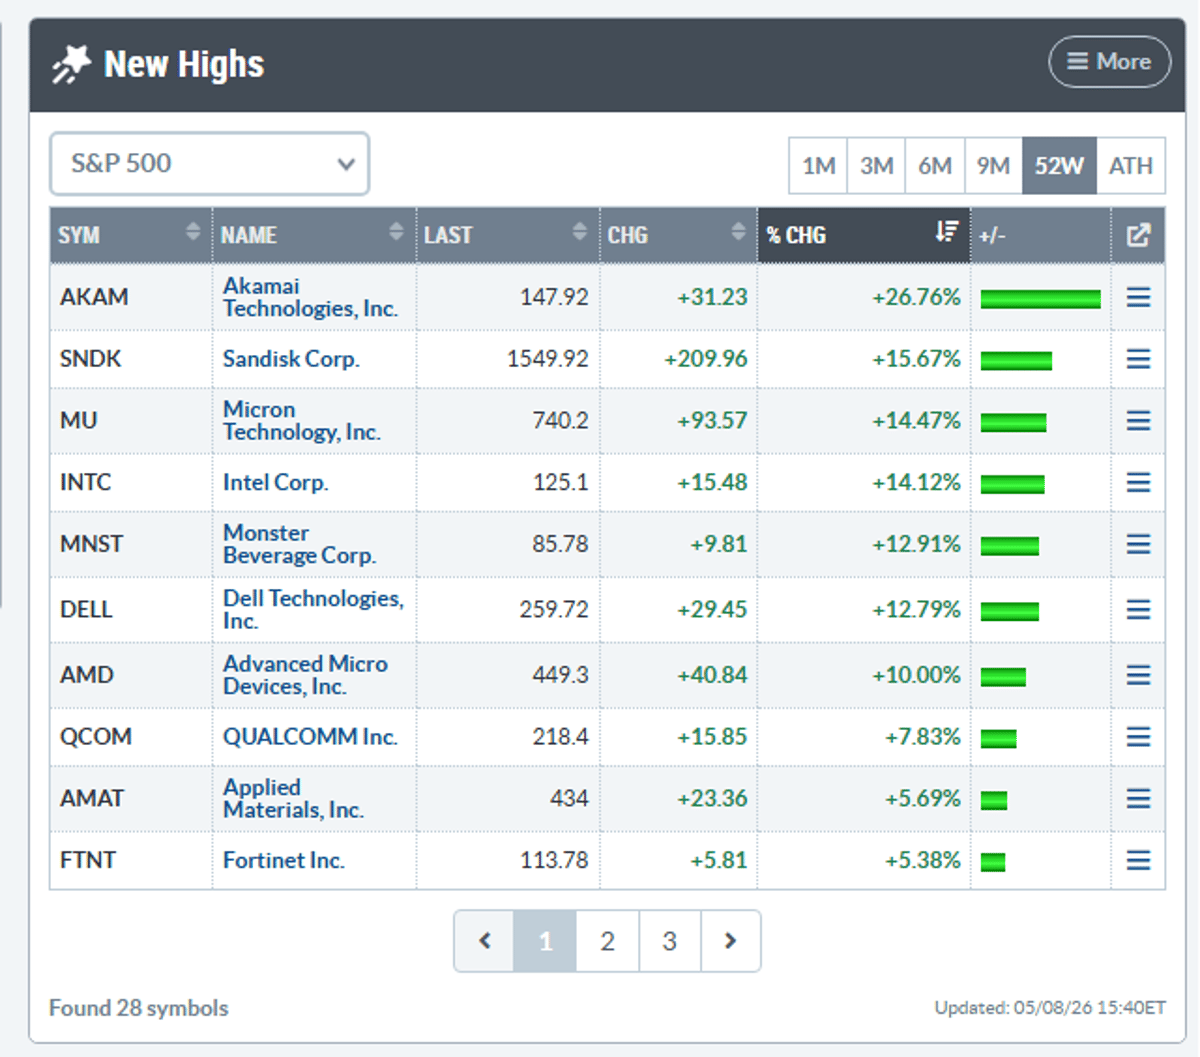
Few 52‑week Highs, but Those Surge Dramatically
There aren't that many 52wk highs today... but those on the list are making massive moves https://t.co/WikWSSZlQ0
Vishay Soars on Chip Rally, Yet Overvalued – Trim Now
Semiconductor rally drives Vishay to $34.24 (52‑wk) +160% Y/Y. Shares exceed fair value; earnings in 5 days raise risk. Action: trim exposure before results. — Viktor Kopylov, PhD, CFA More insights: t.me/si14Kopylov

RKLB Skyrockets 10x From $10 Flag
$RKLB is up 10x from its high tight flag at $10. I wrote about publicly on my blog in October 2024. https://t.co/kYnTUIwg0n

Overbought? Take Profits, Raise Stops, Stay Long
I moved up a lot of stops today and did take some partials off into strength on some names. Market powering higher but extended. Overbought can stay overbought. It is not a reason to sell IMO....
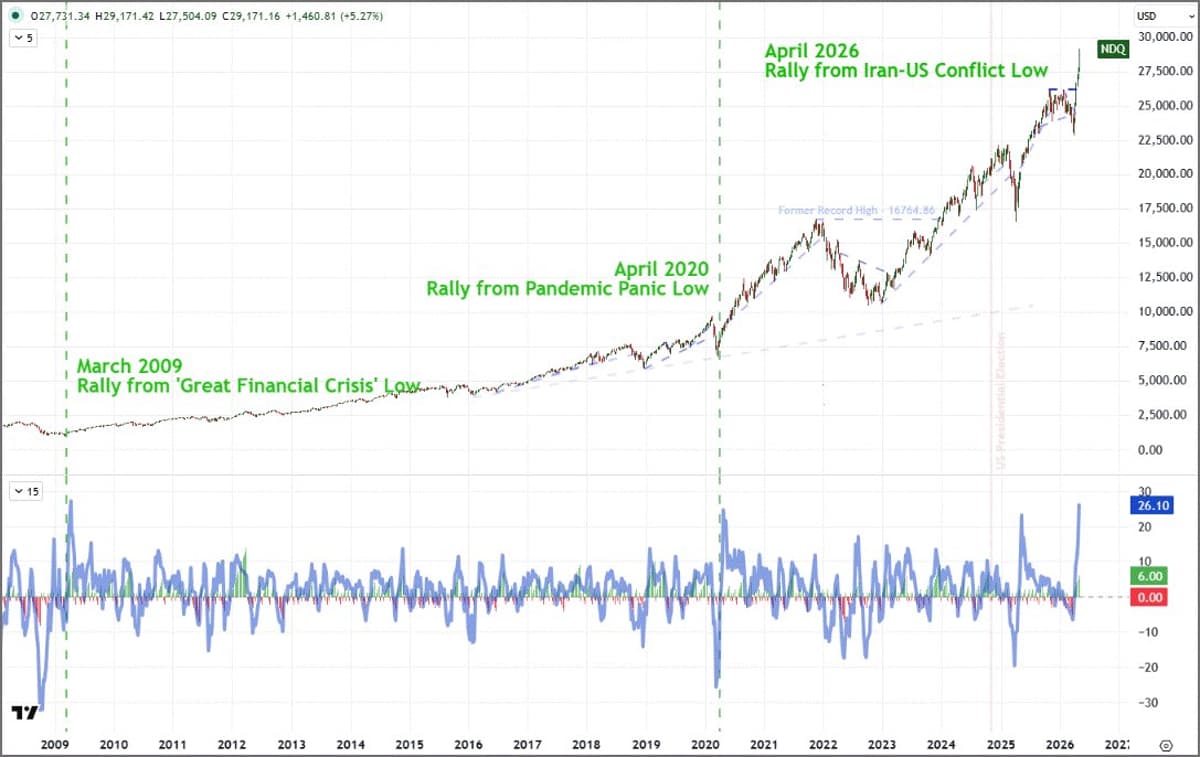
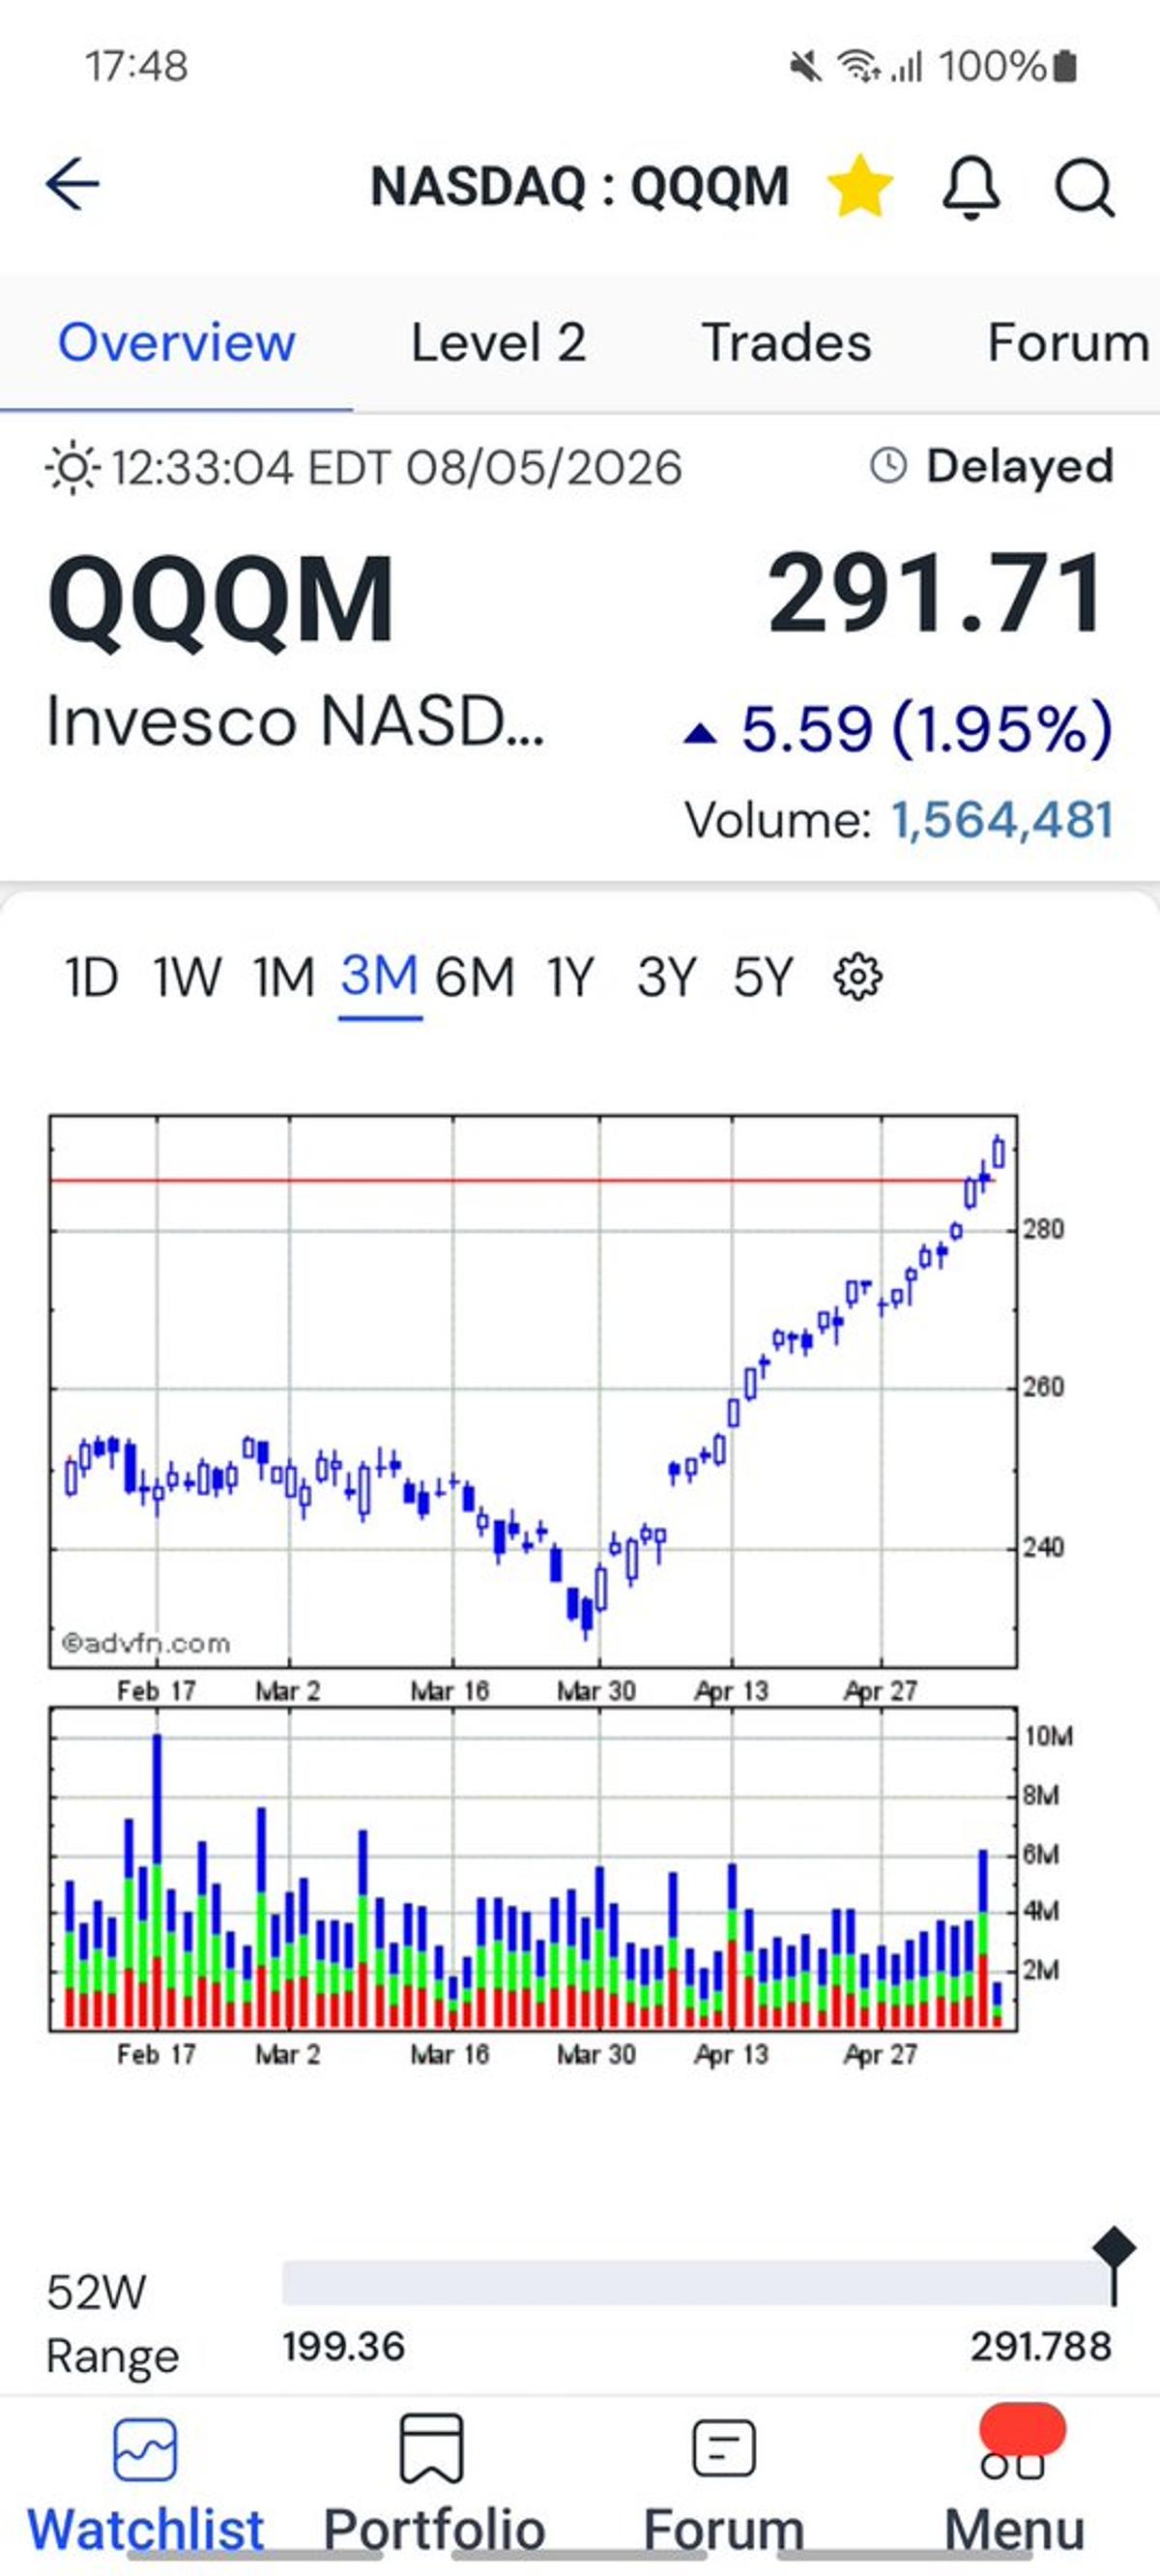
Nasdaq 100 Posts 6‑week Rally, Biggest Since 2009
The Nasdaq 100 is pushing out a sixth week's rally. Longest bull run since October 2024. Biggest 6-week rate of change (26%) since the recovery after the bottom dropped out during the Great Financial Crisis (2008/2009) https://t.co/oXCdaz8NiD
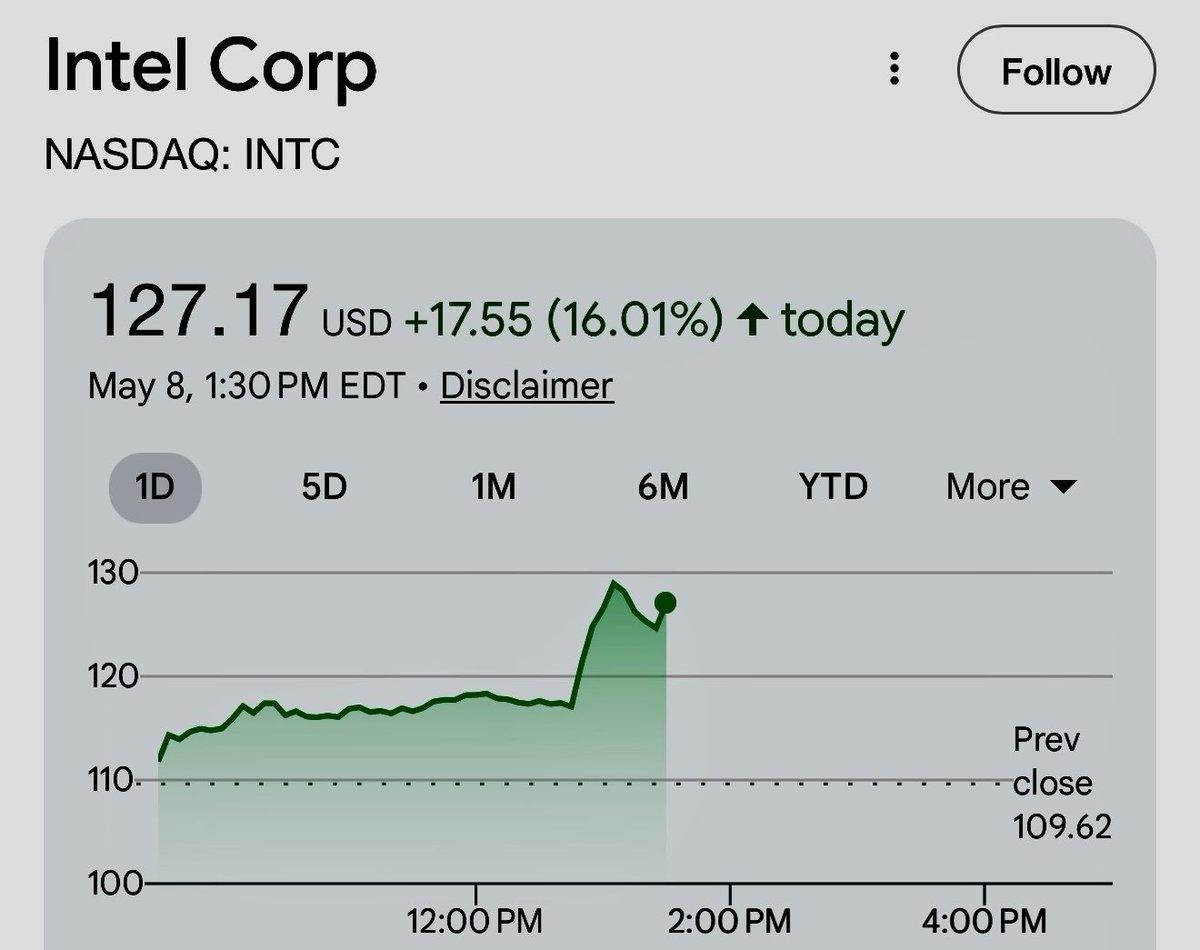
Memory Wall Fuels Surge in Intel and AMD Shares
Driven by high degree of need for Context Engineering, ‘Memory Wall’ tilts the focus to CPUs. @Intel is up another 16% and @AMD is up another 9% today. https://t.co/G2kCefO0w9
Nasdaq's Rally Overbought; Consolidation Likely Ahead
The #Nasdaq Comp has had an incredible run up. The Daily RSI must be quite Overbought now, so some Consolidation is needed: https://t.co/4MNQzoSEwO
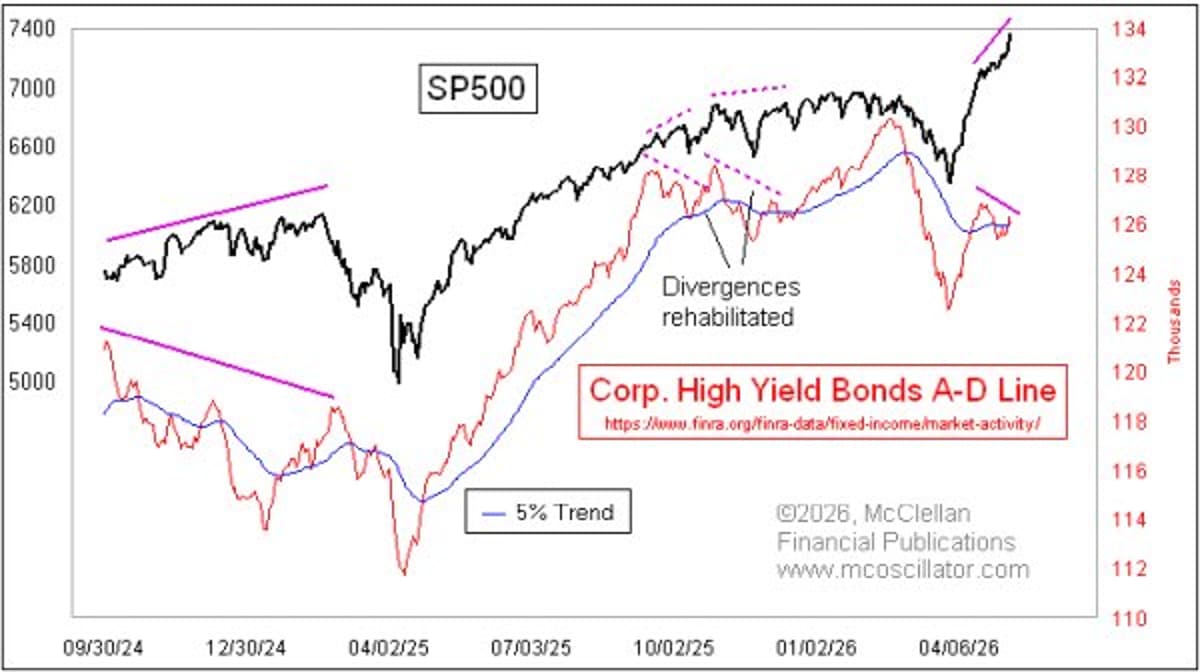
Bearish Bond Divergence Signals Liquidity Stress Ahead
Curious… “The daily Advance-Decline (A-D) Line for high yield corporate bonds is making a bearish divergence versus the SP500. This is a concern because it conveys a message saying that there are liquidity problems.” @McClellanOsc I would say this is a...

Tesla Undervalued: Driverless Robotaxis Under $500
While people online were calling me a moron, an asshole, and shitting their pants over a minor correction I was buying calls Tesla remains dramatically undervalued. There are driverless pure vision Robotaxis on the road and it’s still trading under...
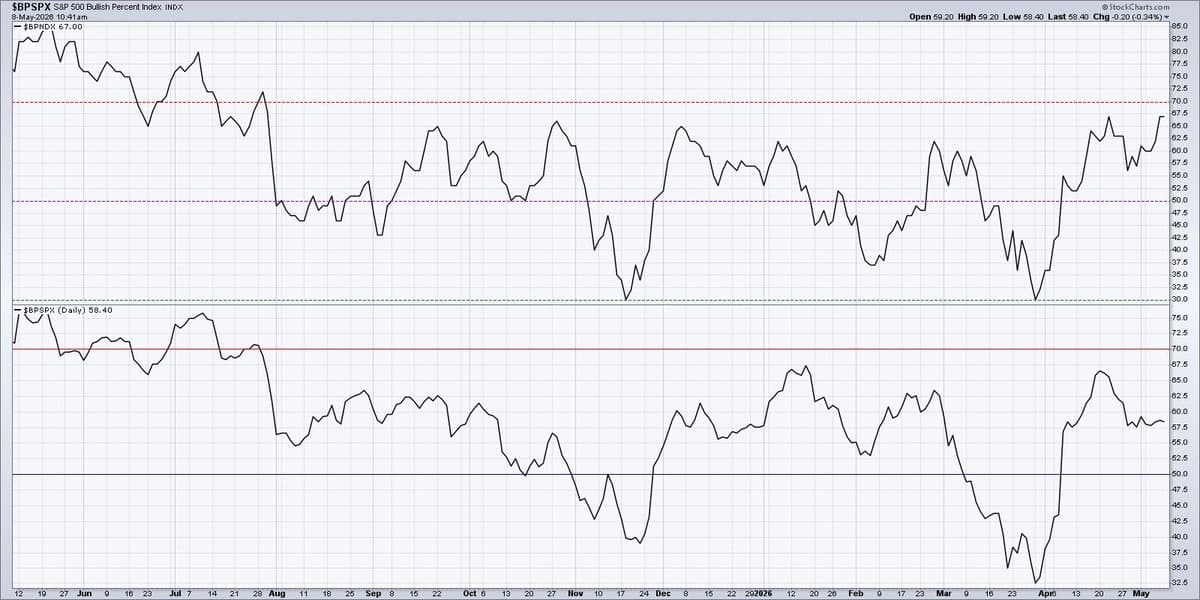
Large‑Cap Growth Breakouts Power May Gains, Not Broad Market
Bullish Percent Indexes are breadth indicators based on point & figure charts. So far in May, $BPNDX has moved higher while $BPSPX has remained sideways. Conclusion: breakouts in large cap growth are driving recent gains instead of a...

Volume Signals Big Moves in Emerging Uptrends
One technique I’ve probably underused over the years? Volume. In today’s video I explain why “power days”- big moves on big volume- can be such an important clue during emerging uptrends. https://t.co/TL5NzTgeF7
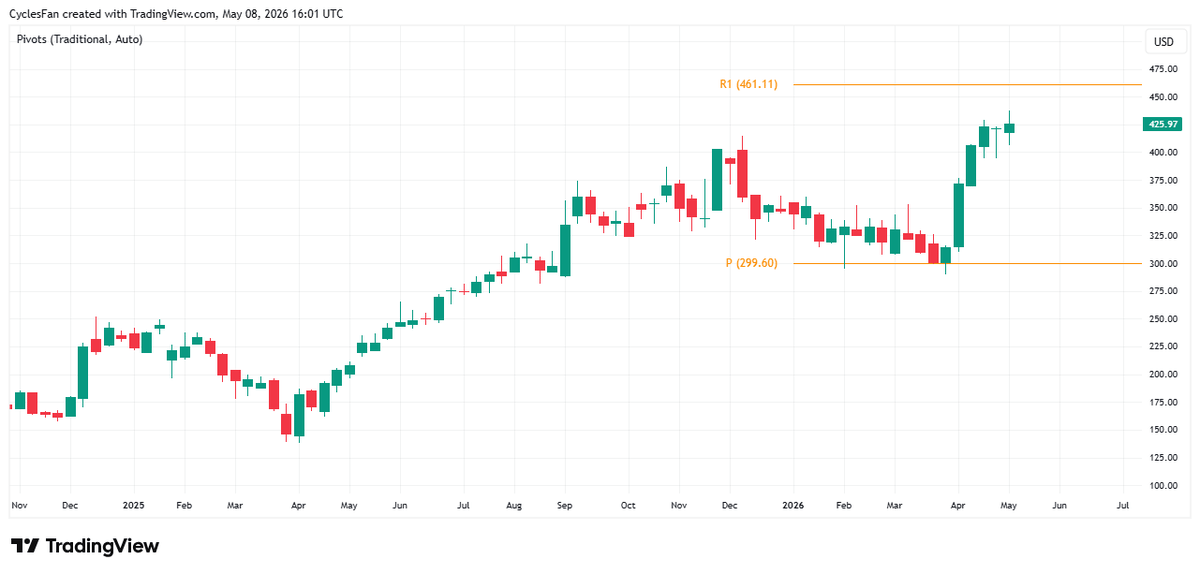
AVGO Stalls Near ATH; 461 Resistance Ahead
$AVGO - Made a new all time high 2 weeks ago but has barley made any progress since then. The next upside target is the 1st yearly resistance at 461. https://t.co/dgeAOMOmFc
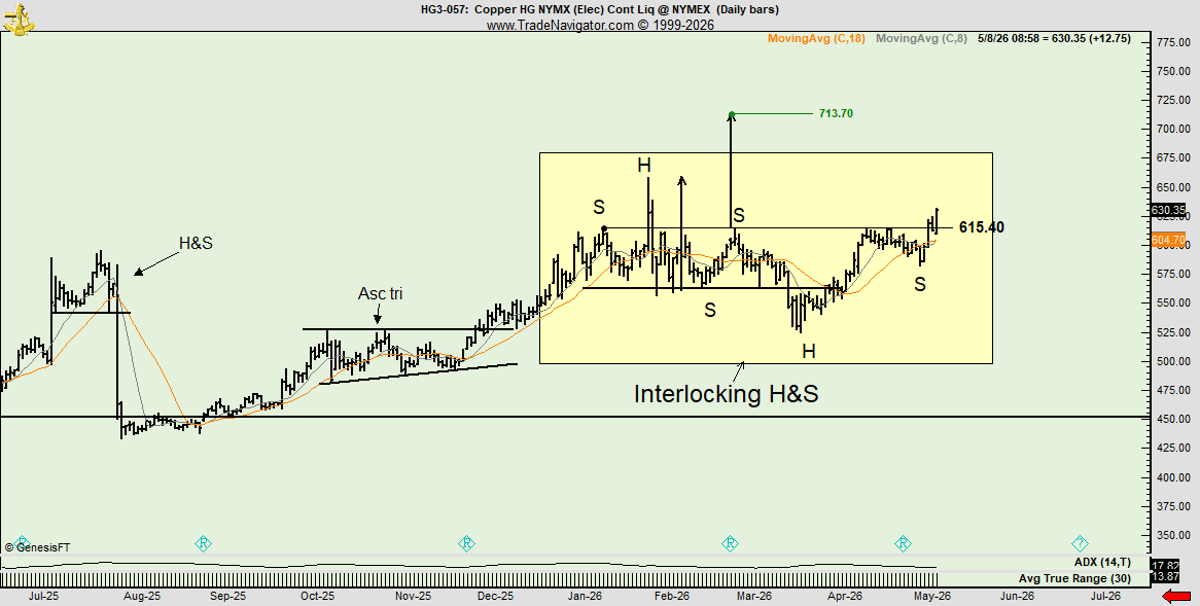
Trust Horizontal Structure, Not Diagonals, in Interlocking H&S
Subject: Interlocking H&S This is called an interlocking H&S whereby the right shoulder of the head of the topping pattern becomes the left shoulder of the inverted H&S. This can be a powerful pattern. The target is determined by projecting the...
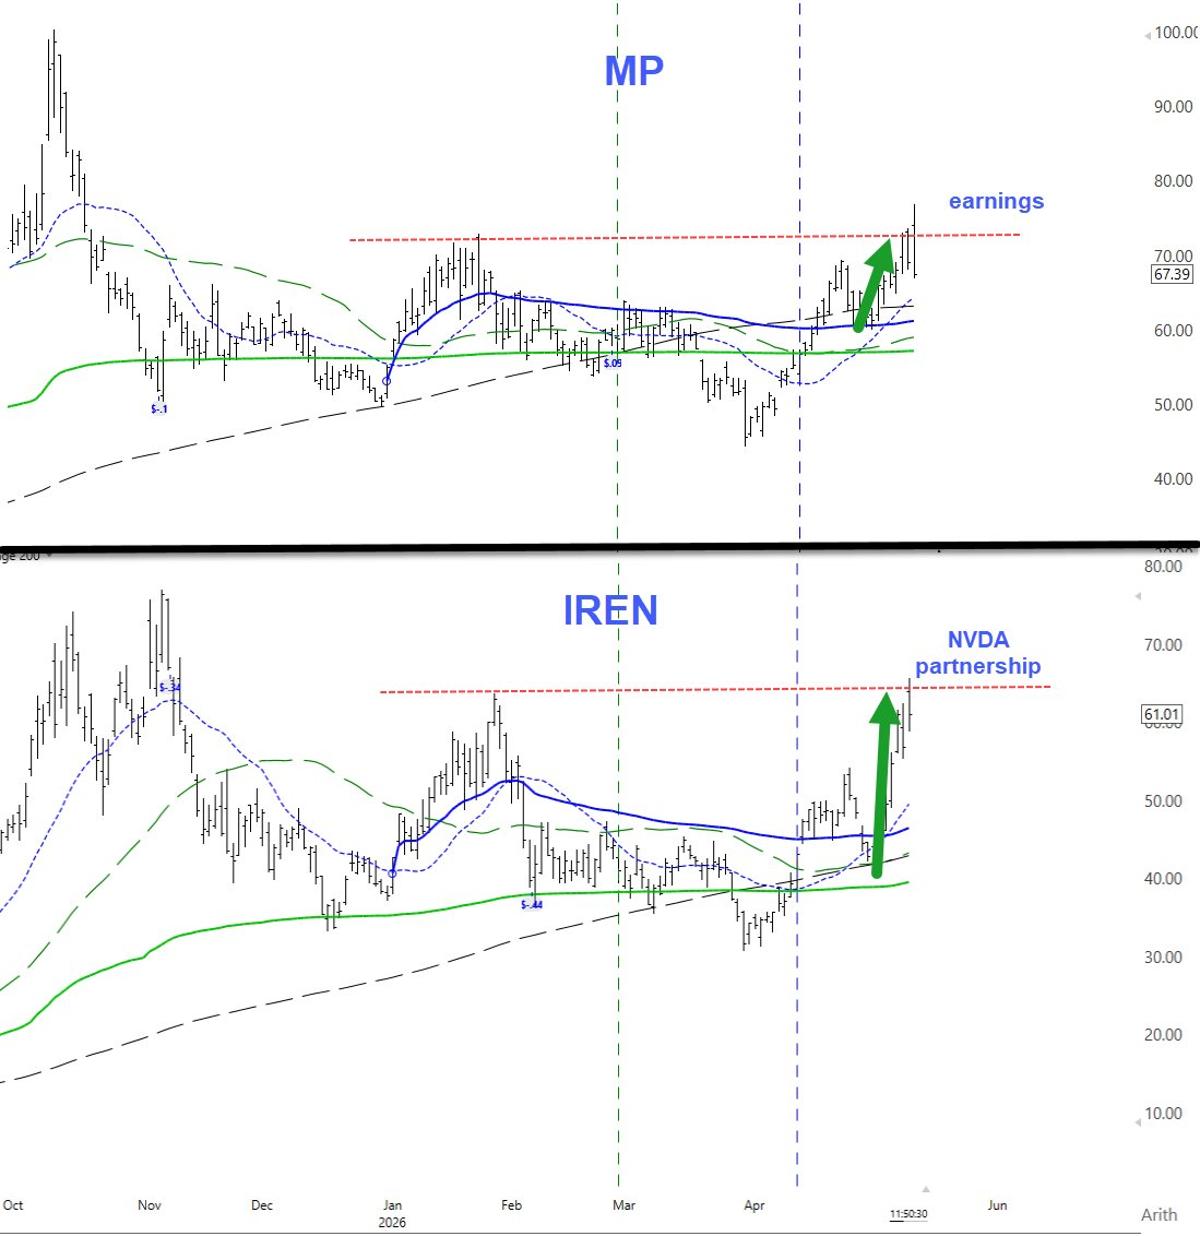
News‑driven Breakouts Often Get Sold Into: Buy Rumor, Sell News
Extended breakouts that come with news are often sold into. Two great examples today with $MP and $IREN Buy the rumor, sell the news
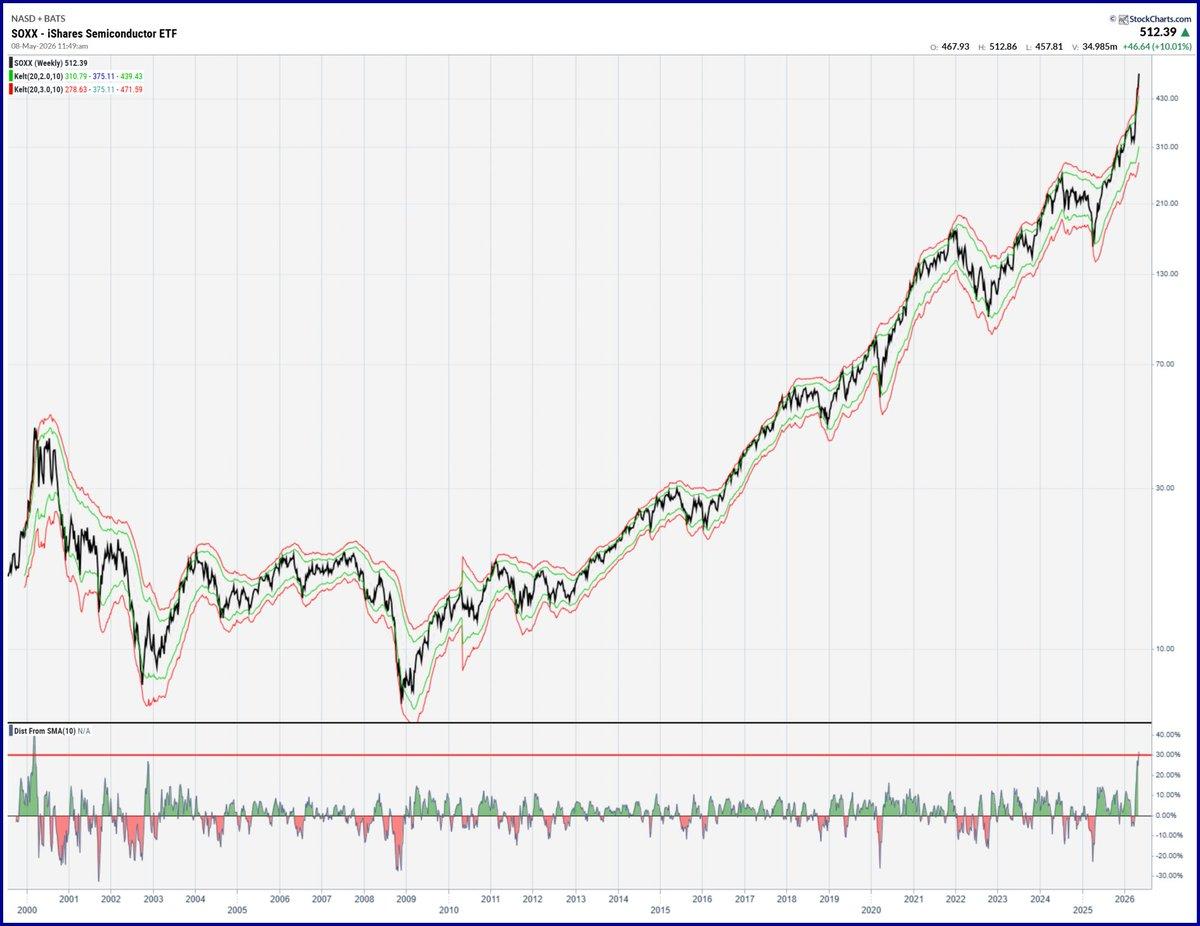
10‑Week MA Reveals Dot‑Com Bubble Overbought Spike
OK. My bad. Weekly price chart. Need to adjust MA to 10 weeks (50 days). We did get even more OB back in the DotCom bubble. That ended well, right? 😉 https://t.co/qyMoaY829y

Apple Stock Poised for Strong Gains Today
Apple, IBD Stock Of The Day, Looks Ripe For The Picking. Here's Why. https://t.co/jdPXGmhqVp $AAPL
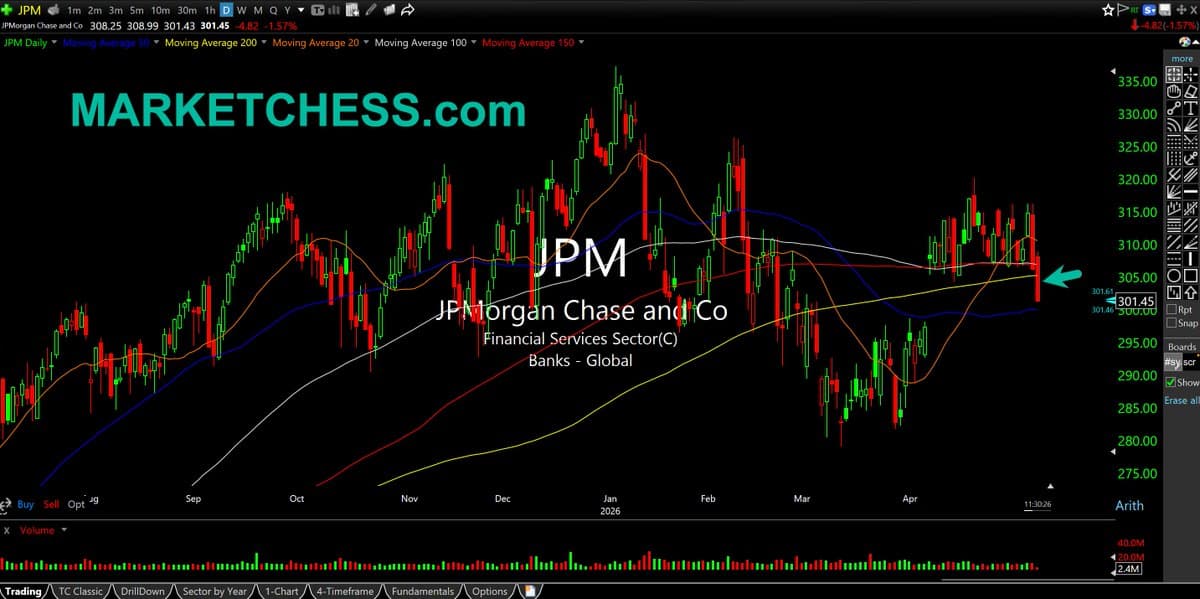
JPMorgan Slides While Chips and Nasdaq Surge
$JPM Daily. As stealth a breakdown as you'll see for JPMorgan given its size & prominence. But in this tape we have chips & Nasdaq melting up again. Chase losing 200-day m.a. pretty soundly here https://t.co/4cDfuRrsOG
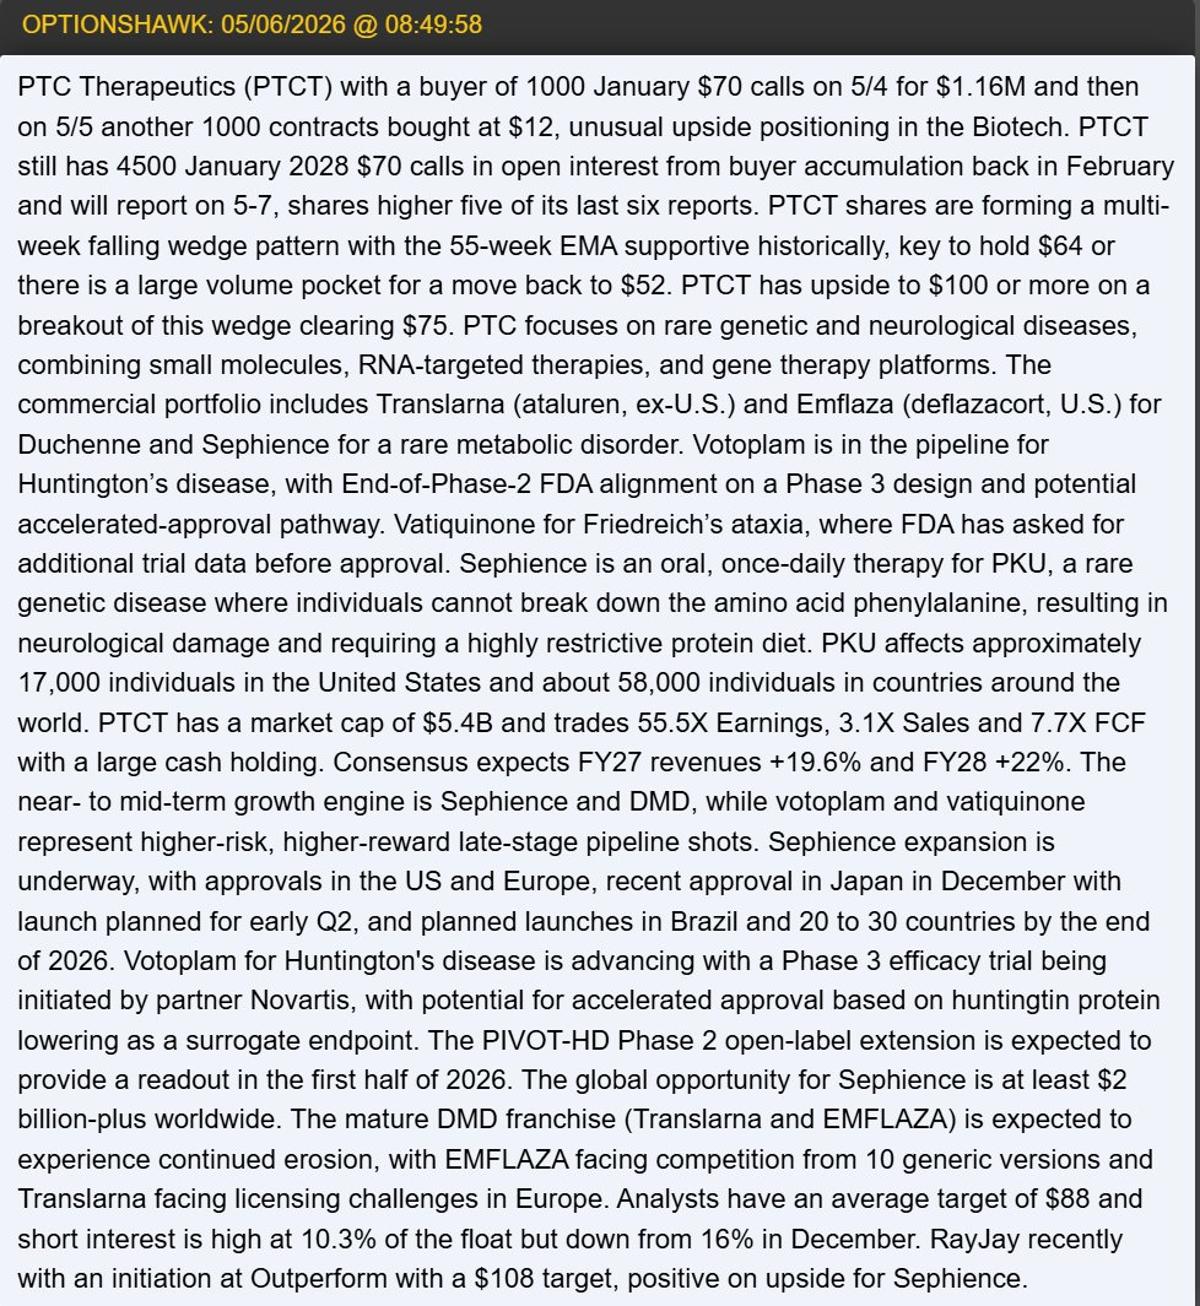
PTCT Jumps 17% on Strong Drug Uptake
$PTCT up 17% on results, really liked that one after writing up this week, nice value with strong uptake in its new drug, and those Jan. calls kept accumulating https://t.co/HEe8G2Sjdx
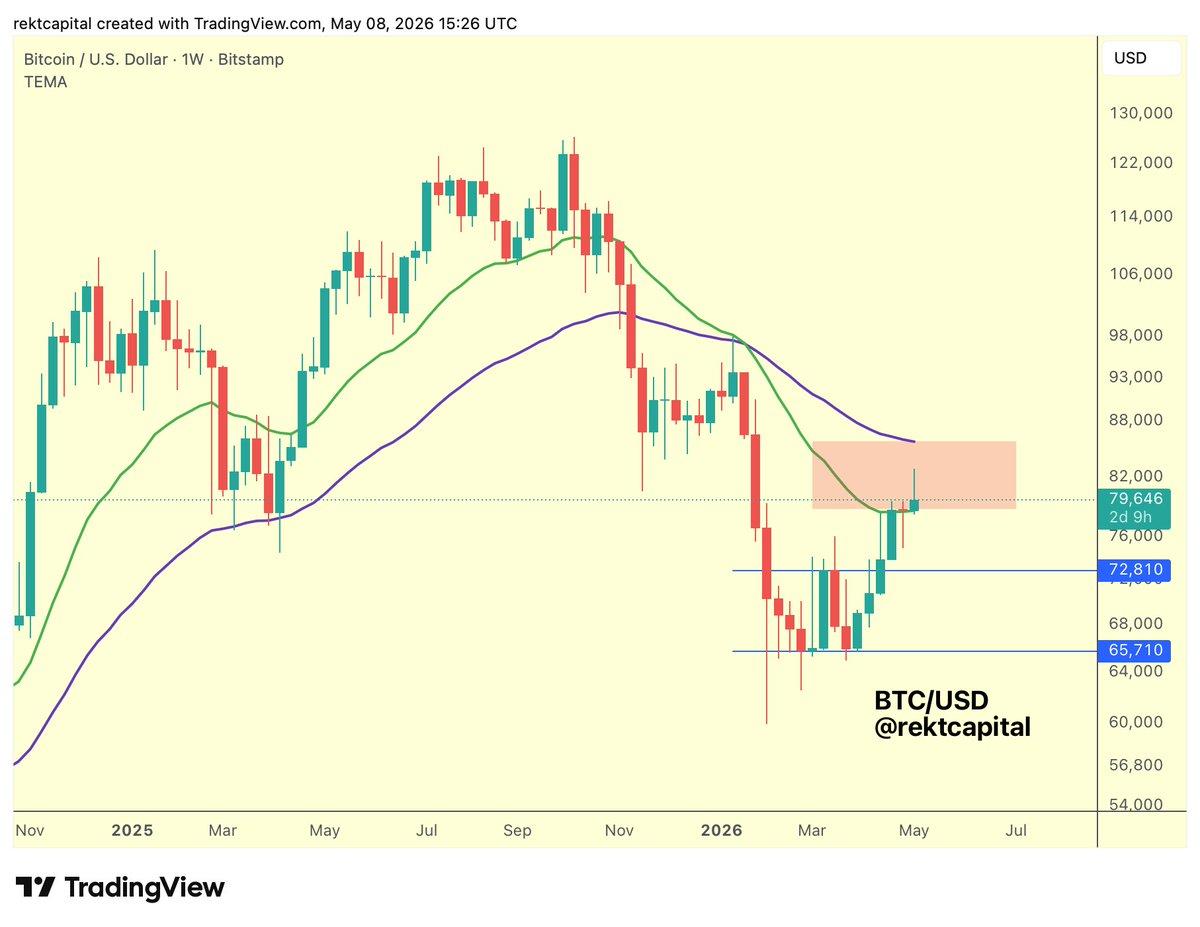
Bitcoin Faces Another 21‑Week EMA Retest Threat
#BTC Bitcoin has managed to successfully retest the 21-week EMA (green) at least momentarily, enabling this recent move up But that move through this resistance area hasn't been very sustainable thus far, which opens up the possibility for yet another retest...

War‑rumor Rally May Be Short‑lived, Sell Soon
Remember the old adage, buy the rumor sell the news... Well if folks are buying in anticipation of the end of war/conflict rally, they appear to have already created that rally. Will be interesting to see how long the spike up...
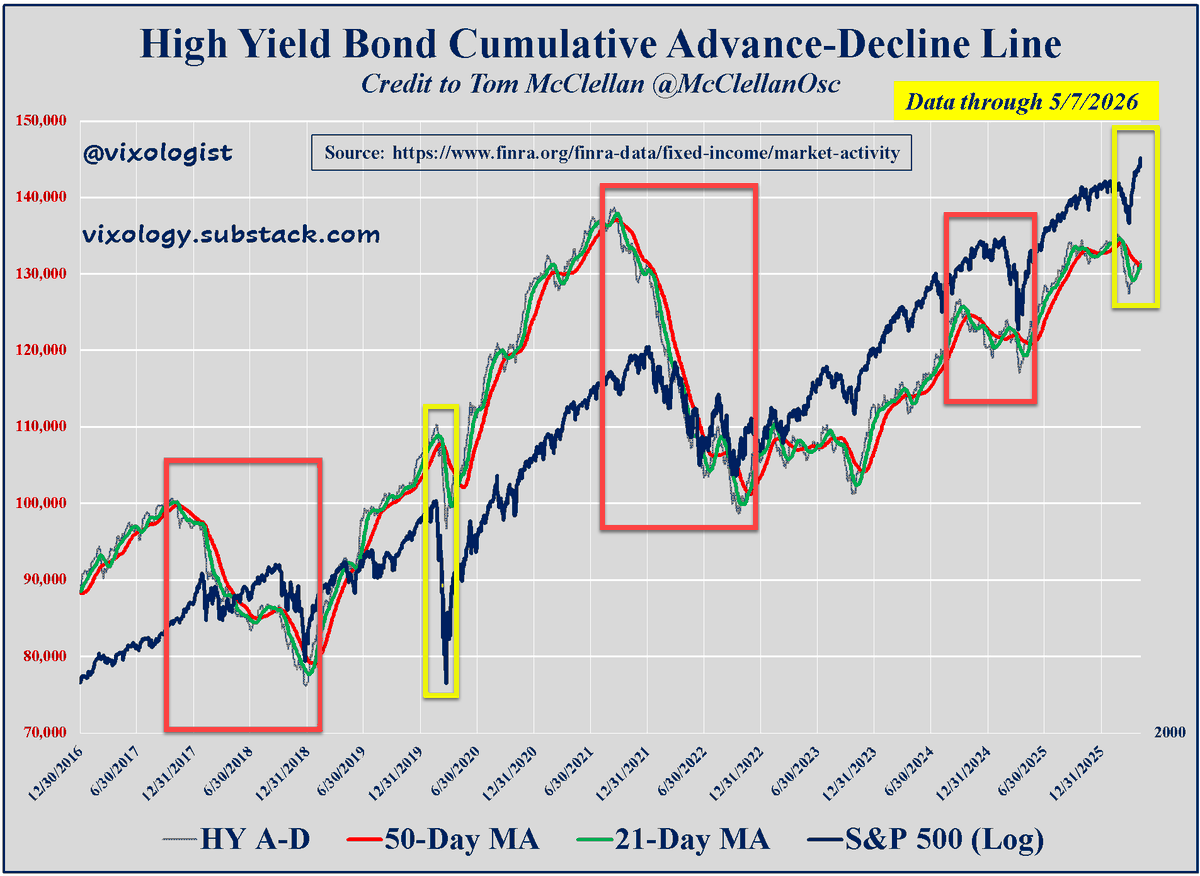
High-Yield Bond Flash Warning: Historical Chart Worth Watching
Tom clued me into this a number of years ago. Here's a look that goes back farther and highlights a couple of other times when it's been valuable (2018 and 2022). Nothing's perfect but this one should be on your...
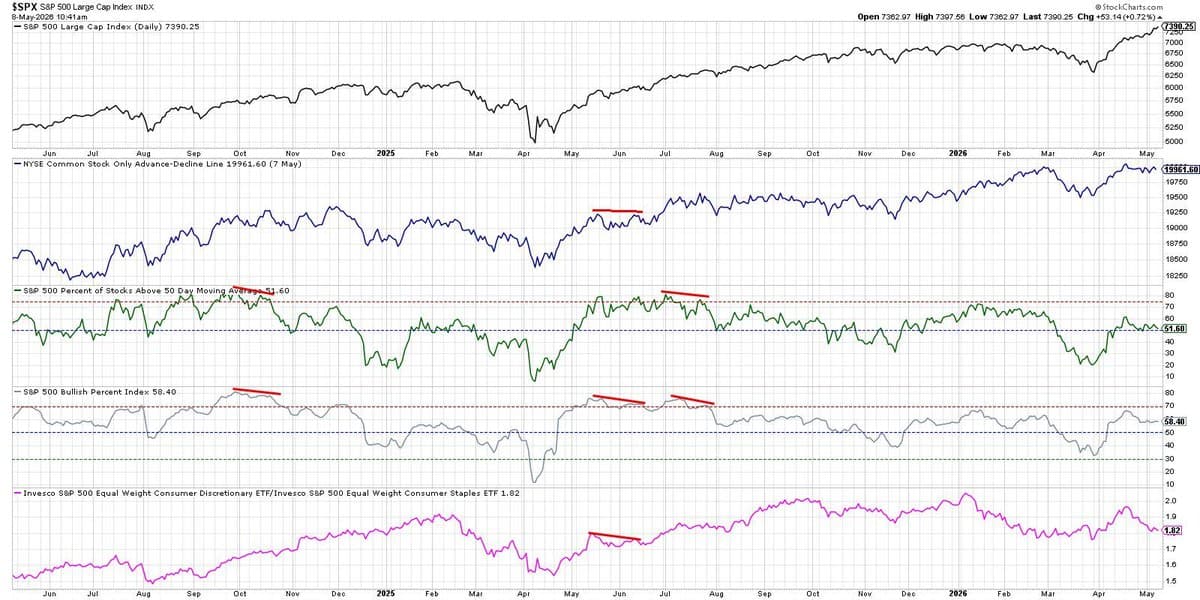
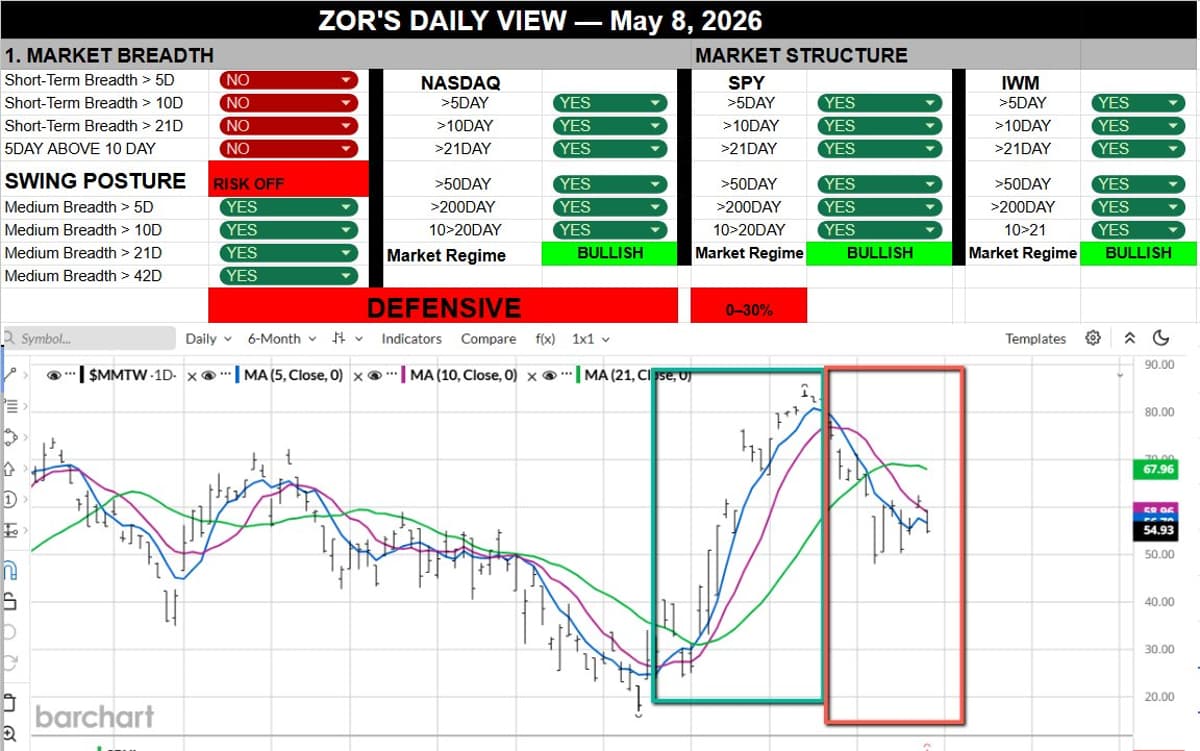
SPX Hits Record, Yet Market Breadth Weakens Significantly
While the $SPX has made a new all-time high in May... 📉 the NYSE advance-decline line has been drifting lower 📉 less $SPX members are above their 50-day MA 📉 Bullish Percent Index has gone down 📉 defense $XLP is outperforming offense $XLY https://t.co/iuUdTnHwvG

Current Price Action Mirrors 2021 Internet Bubble
price action eerily similar to internet bubble as well as 2021. as well as some of they bullish commentary...
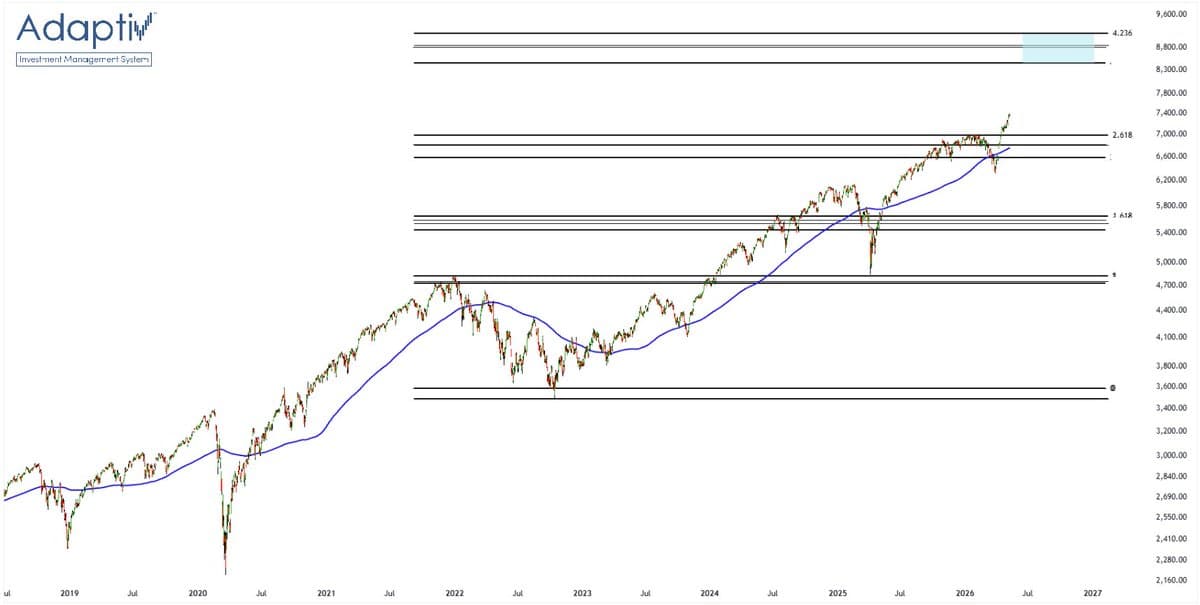
Fibonacci Extension Points S&P 500 Toward 8,800
The next Fib level/extension (from the 2022 bear market) brings us to roughly 8800 on the S&P 500. Previous targets have panned out pretty well. TBD whether this one takes the same route. $SPX $SPY $ES_F https://t.co/cT70QE2euF
Investor Places Massive $30
Intel (INTC) buyer of 1000 January 2028 $170 max strike calls $30 to $31.50 👀👀

Tesla Surpasses All Major Moving Averages After Holding
TSLA put all my shares into let it ride. Price now over all major ma's
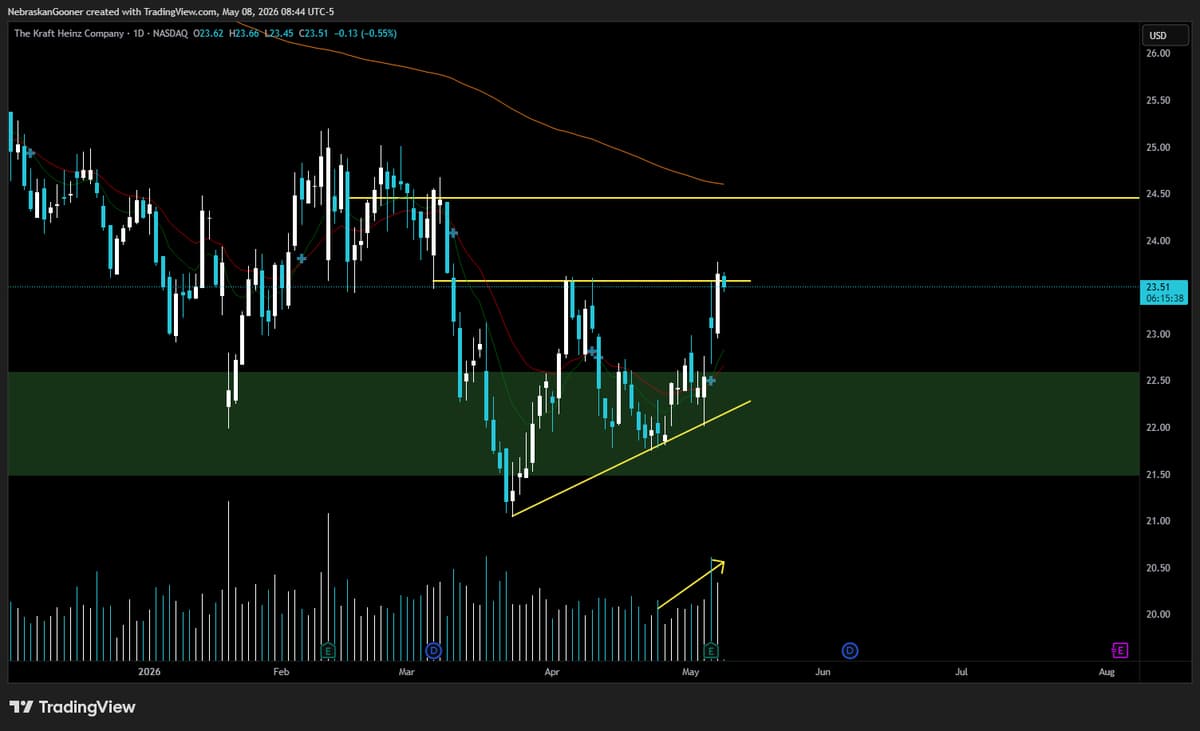
KHC Shows Potential Bottom Breakout, Eyes $24.50 Target
$KHC Potential bottoming structure breakout yesterday. If today holds above then we could see a push. Ultimately needs to reclaim $24.50 but this is a good start. Looks like reversal forming. CC: @BigCheds for putting this on my radar https://t.co/BxbJaftSYz

Buy May 8 Call Spread, Sell Put for Credit
$COIN "Trade Idea 2: Buy the May 8 Expiry 197.50/200 Call Spread ($1.30) and sell the May 8 Expiry 175 Put for a 5 cent credit." Puts expire, unfortunately so does call spread

Buy 69/71 Call Spread, Sell 60 Put on AFRM
$AFRM "Trade Idea 2: Buy the May 8 Expiry 69/71 Call Spread ($1.25) and sell the May 8 Expiry 60 Put for 25 cents." Sell to close call spread on anly weakness in stock, look early. Puts expire
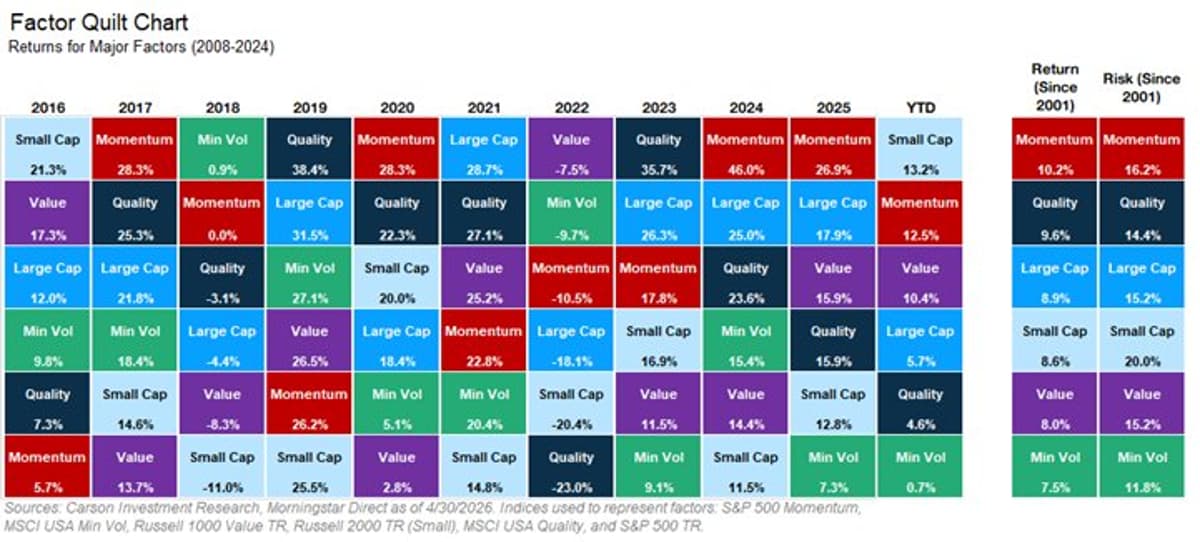
Momentum Persists as Small Caps Join the Rally
Here's an updated version of our @CarsonResearch Quilt Chart. Momentum doing what it does, but nice to see smalls join the party. https://t.co/T9KO9Uho9R
Earnings Gainers Spike on Unusual Call Alerts, TTD Put Underwater
FROG, LASR, TNDM, AKAM big earnings gainers that each saw unusual call trade alerts yesterday; TTD put seller for Oct. starts underwater but has time
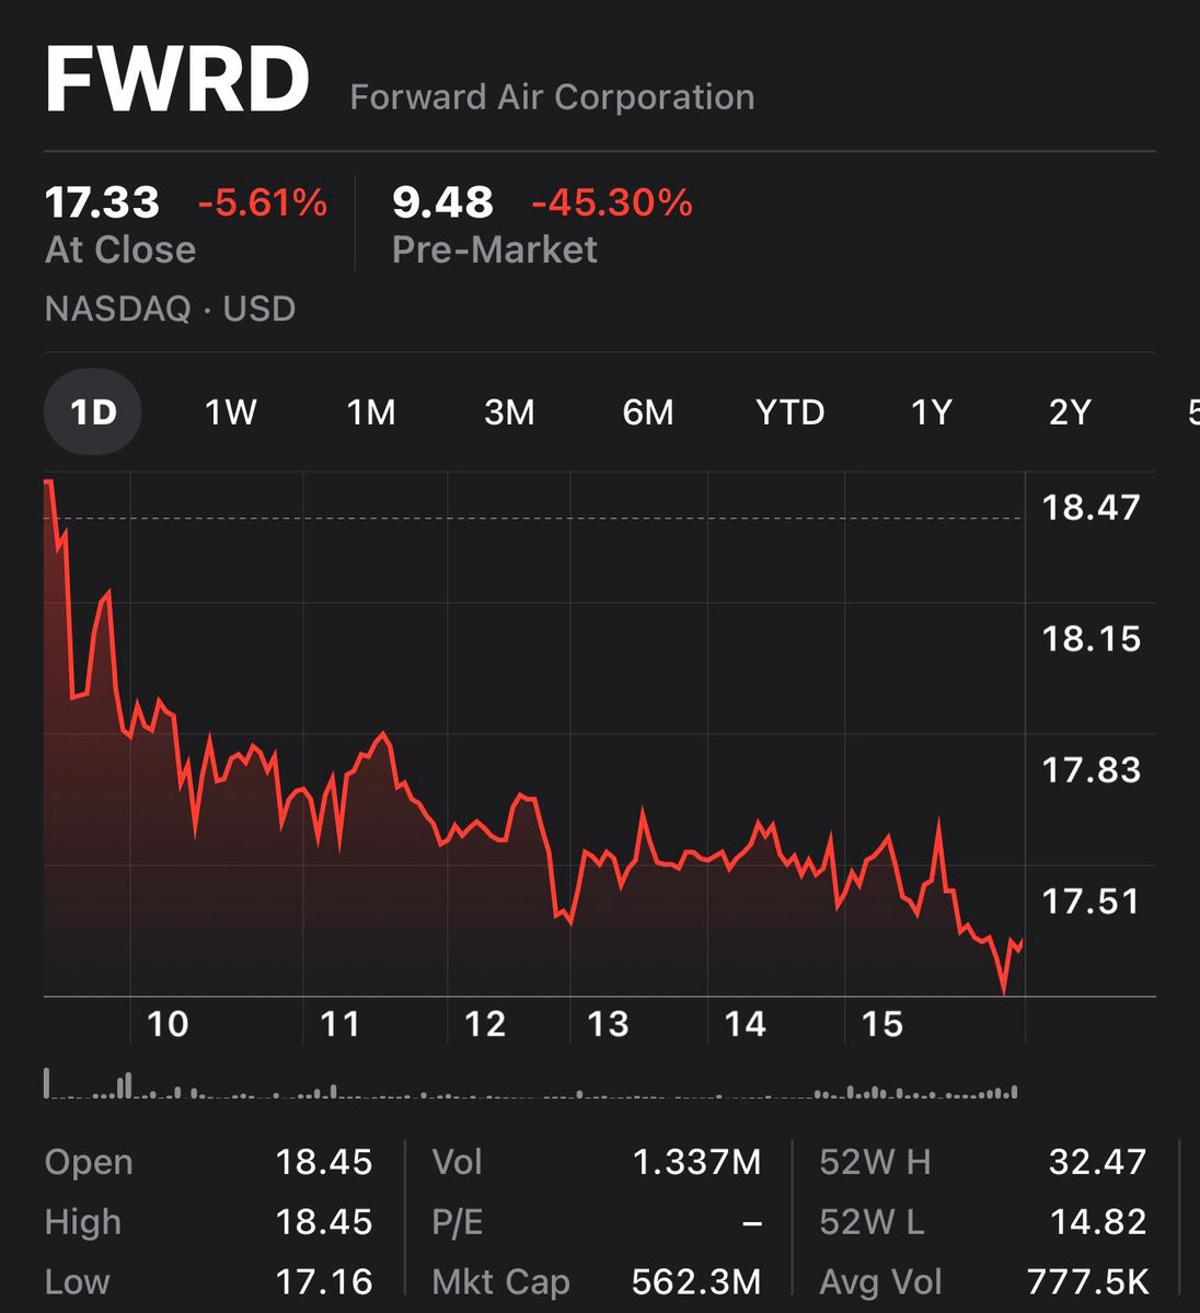
Forward Air Plunges 45% After Hours, Covenant Default Risk
Forward Air got obliterated in after hours. Down 45% today. Risk of default to bank covenants. https://t.co/wh6l8IW59O
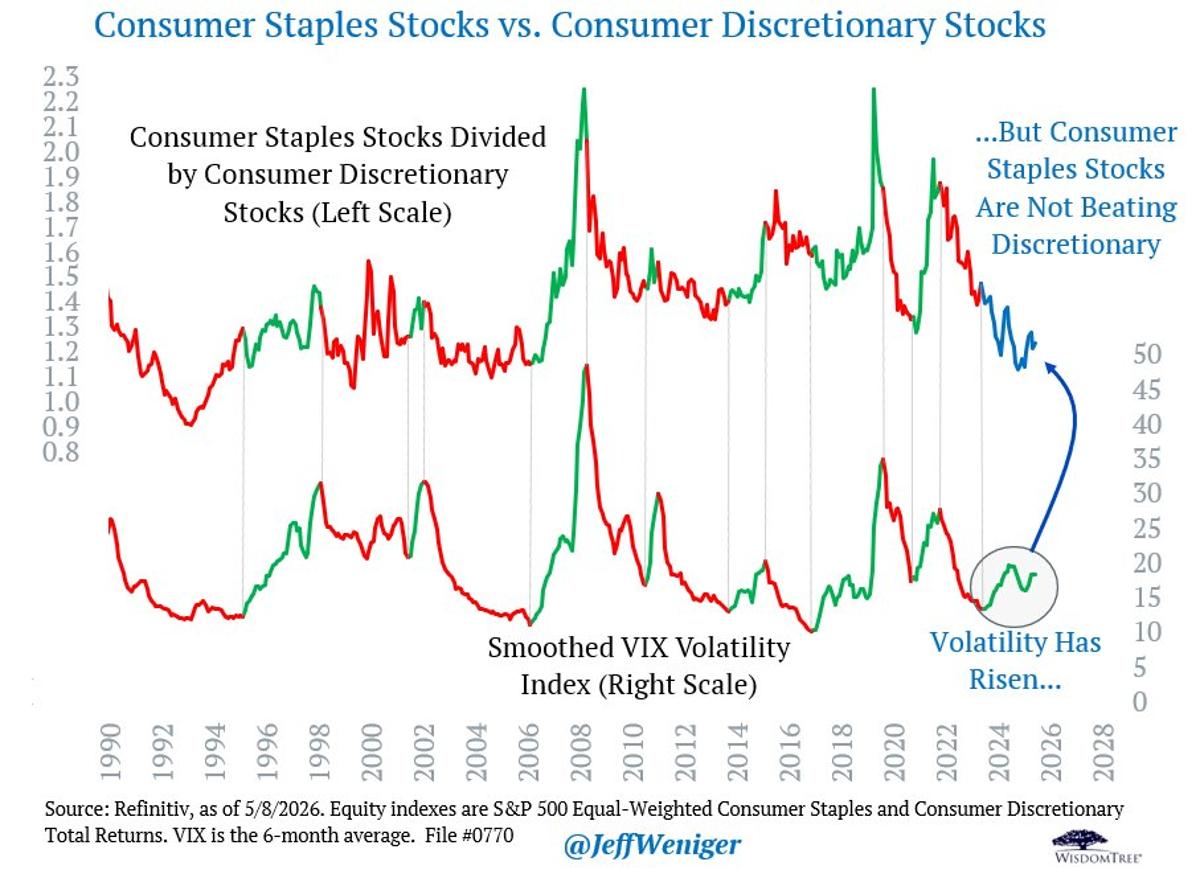
Staples Stumble in Eighth Volatility Cycle Since 1990
Bullish chart for Consumer Staples stocks. Seven rising vol cycles, seven times the Staples sector was victorious versus Consumer Discretionary. But in this, the eighth rising volatility cycle since 1990, yikes: no love for Staples. Maybe the love returns? https://t.co/MenhcpkhRl
Adapt to New Regime: Trade Today's Choppy Tape
The hardest adjustment now: accepting the regime is changing. Trading like it is still last month. After a month of straight moves, traders start trading the “what ifs”: “should’ve held.” “should’ve sized up.” That’s not the current tape. As of today—subject to change— I expect chop. Trade...
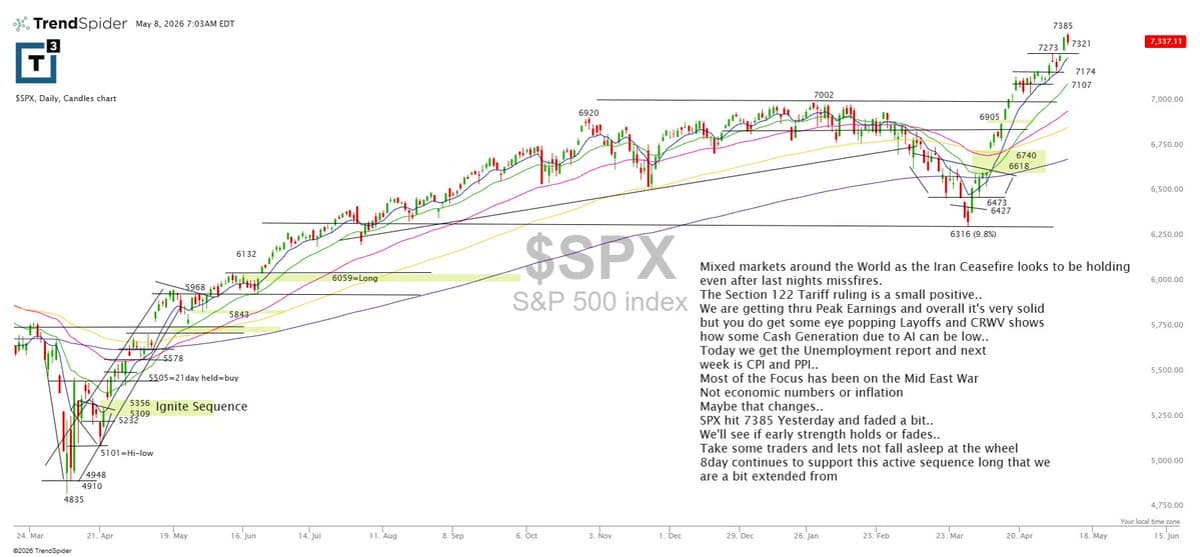
SPX Tests Early Strength Near 7385, Watch Support Levels
$SPX hit 7385 yesterday and then faded a bit, so now we’ll see if early strength holds or fades. The 8-day continues to support this active sequence, but we’re getting extended. Key nearby levels to watch are 7321, then 7273...

Targeted Diversification Solves Hedge Fund Crowding
In today's Early Look: "High Beta Mo in #Quad2" My answer to the uniquely American Hedge Fund crowding problem is simple: #GoAnywhere. But don't go everywhere. https://t.co/w5ZaT9eSFS
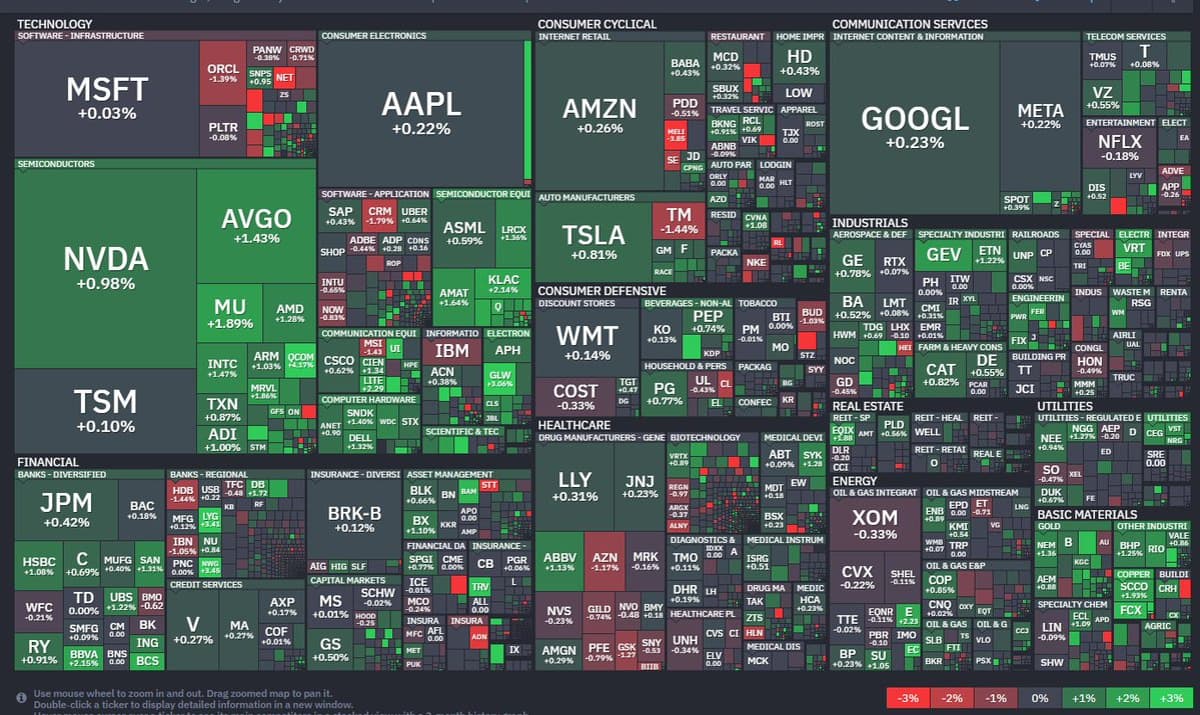
Broad Market Gains, Oil and Bitcoin ETF Slip
$SPY +0.4% $QQQ +0.6% $SMH +1.3% $EEM +0.7% $IWM +0.3% $TLT +0.3% $USO -1.0% $GLD +0.2% $IBIT -0.5% @finviz_com https://t.co/7LAW5uQ5Ur
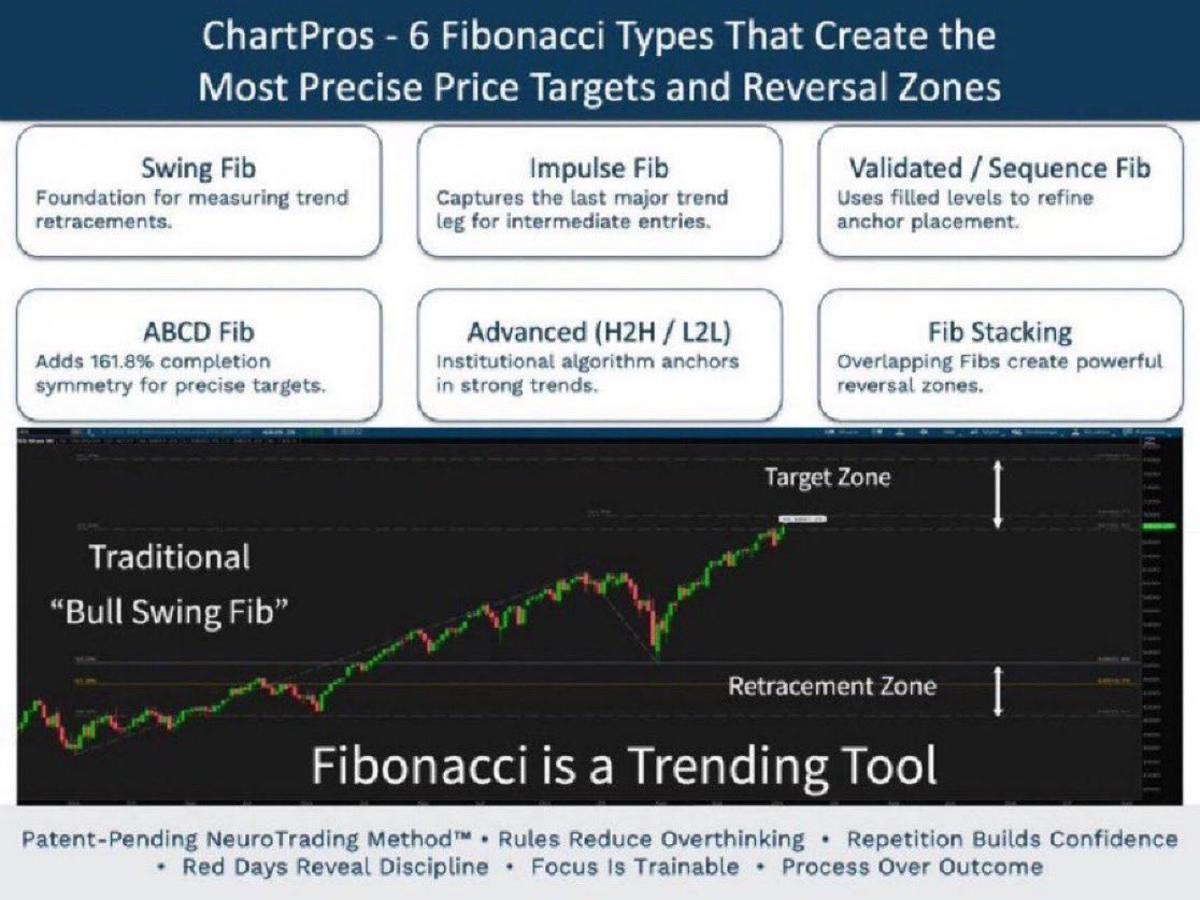
Free Guide to Master 6 Fibonacci Patterns
Here’s a link below to a FREE Fibonacci Trading Strategy Guide (ebook): 📈📉 Learn the 6 Fibonacci Pattern Types that Create the Most Precise Price Levels, Targets, and Reversal Zones for traders. Click here: 👇 https://t.co/AXA7xH9yWB FREE today courtesy of: @StockChartPros https://t.co/59KTpmSqwq
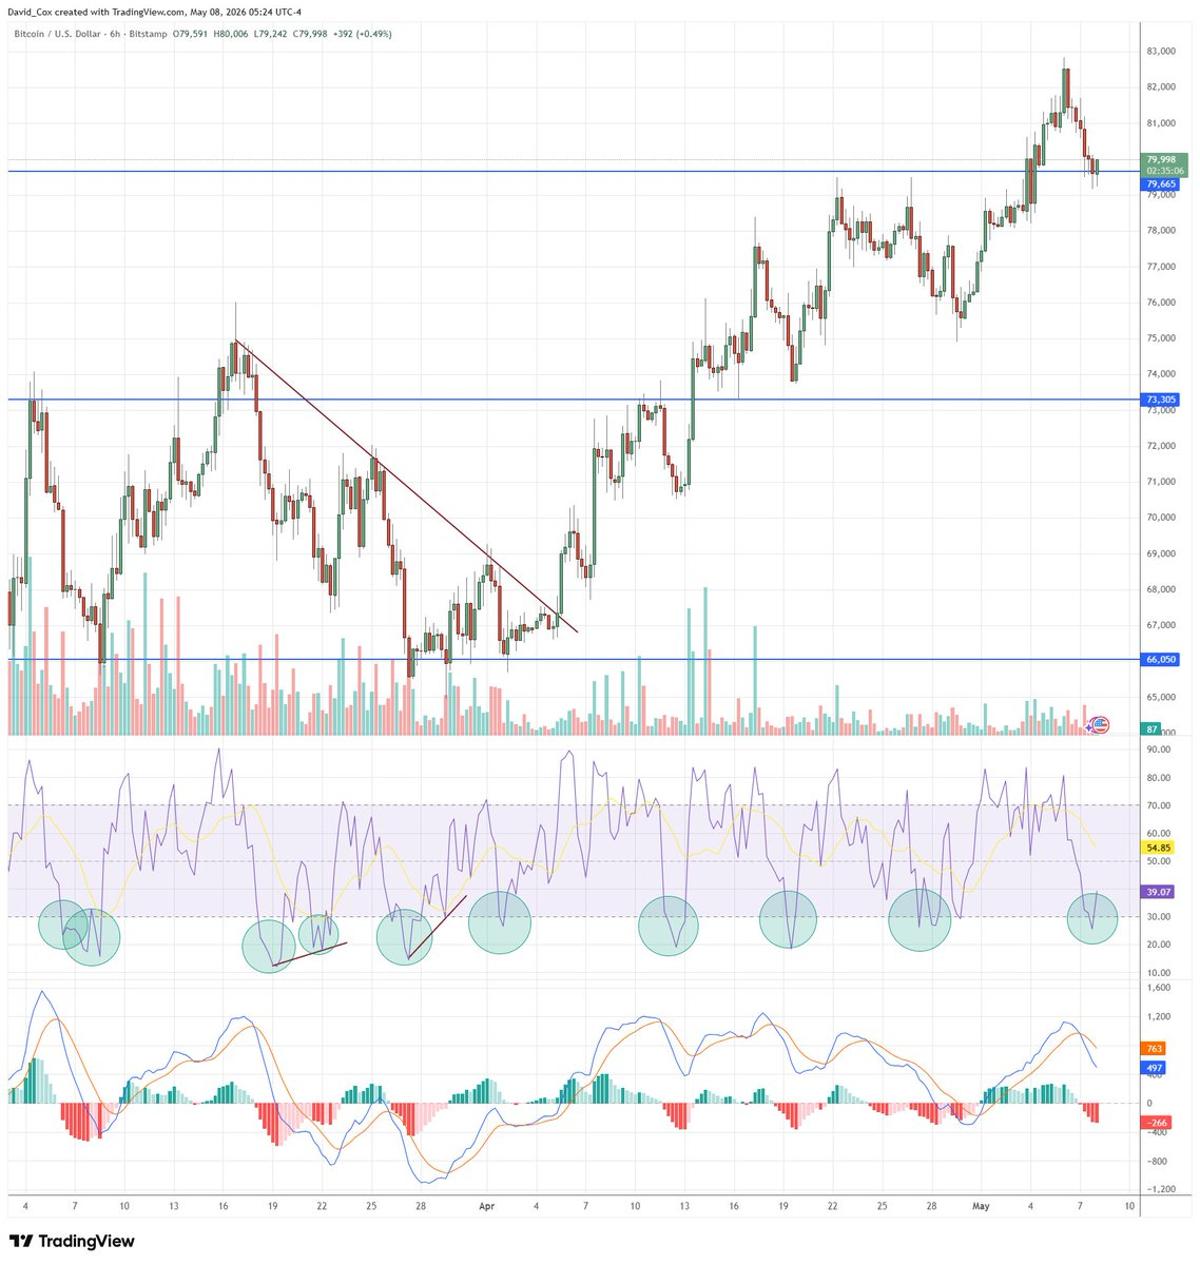
BTC Rebounds From RSI Oversold, Climbing Toward $80K
Bitcoin #BTC $BTCUSD is just turning up from an RSI(5) oversold pullback on the 6-hour chart in an uptrend... the last one was in the mid $70Ks... sitting ~$80K https://t.co/8MH8AdrUc6

Indonesia Stocks Tumble 2.9% Overnight, Short Positions Held
INDONESIA: stocks smoked for another -2.9% loss overnight and we remain short of them https://t.co/phrY7BQxit
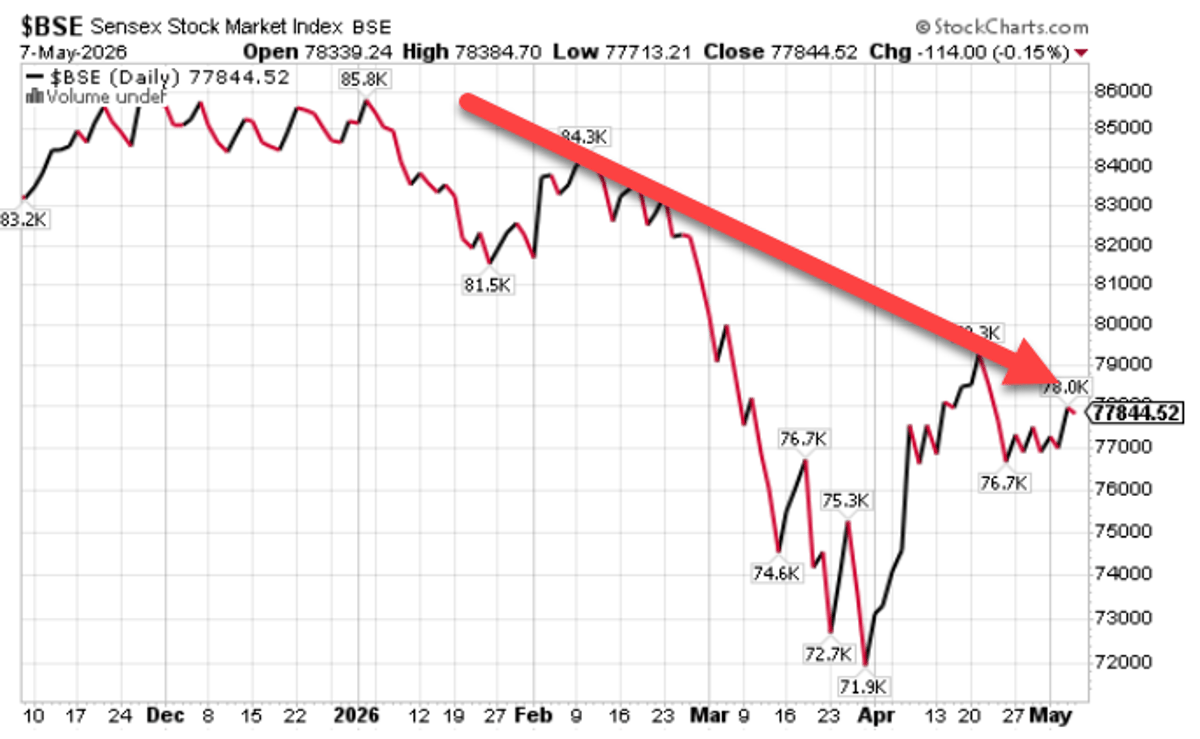
India Short Drops 0.7%, Outperforms China Longs
INDIA: our biggest Country Short was down -0.7% overnight and has been a great short relative to Country Longs like China https://t.co/SElzQfM9dG
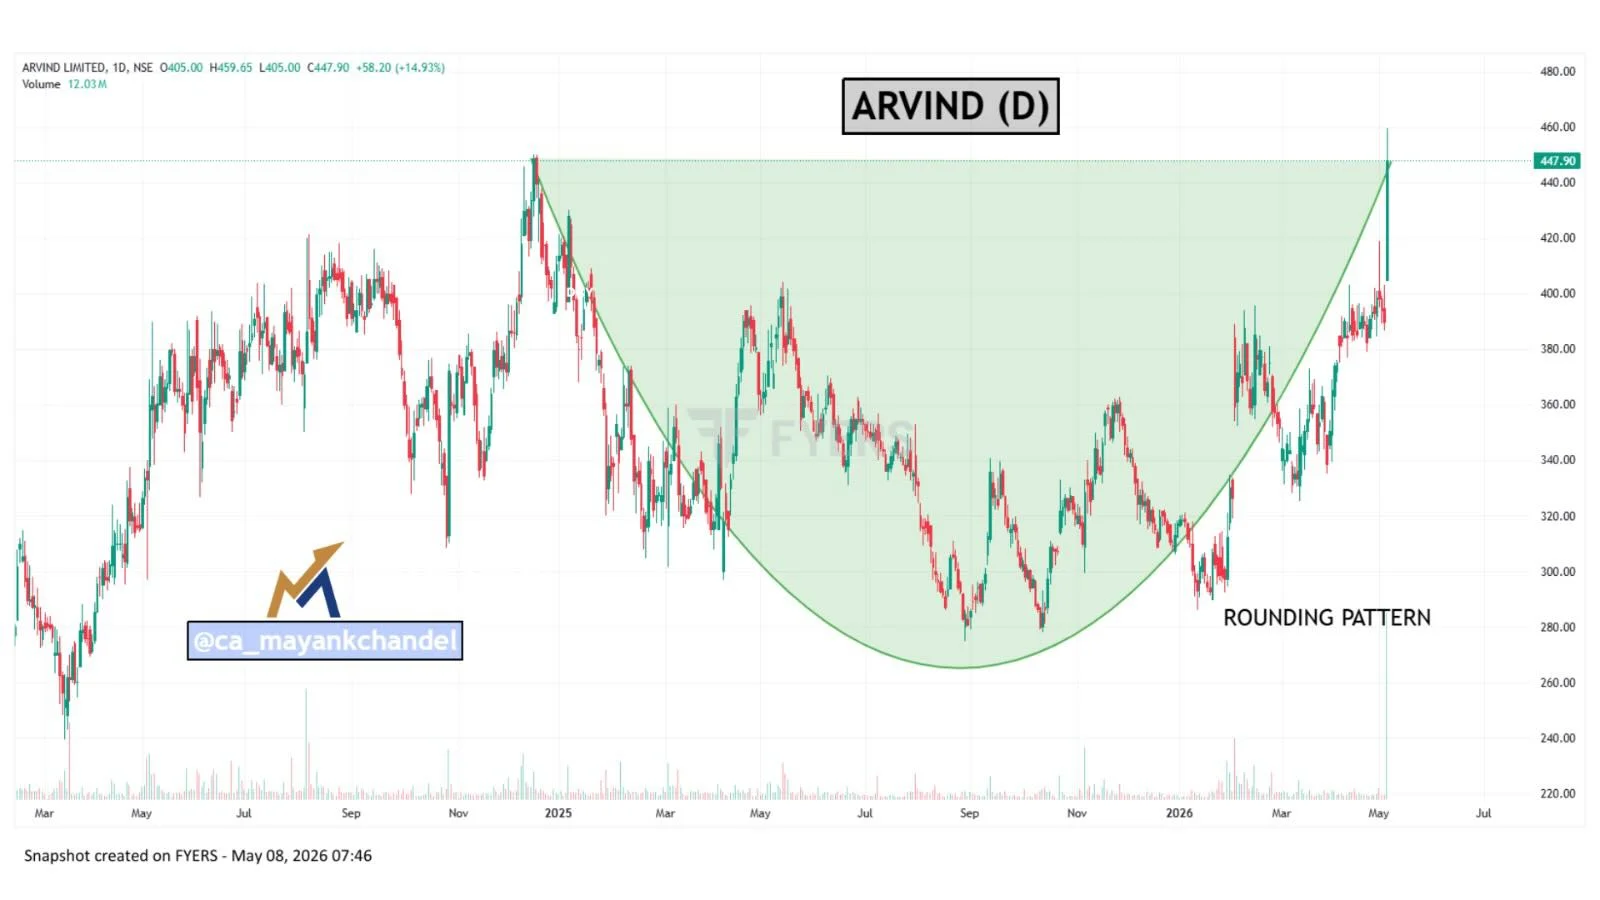
ARVIND Approaches Breakout: Watch for Rounding Pattern
Stock to watch #ARVIND - ARVIND trading near breakout zone - Rounding pattern Keep it in your watchlist for a potential trading opportunity 👀🚀 #Nifty #Nifty50 #SmallCap #Largecap #Midcap #Sensex
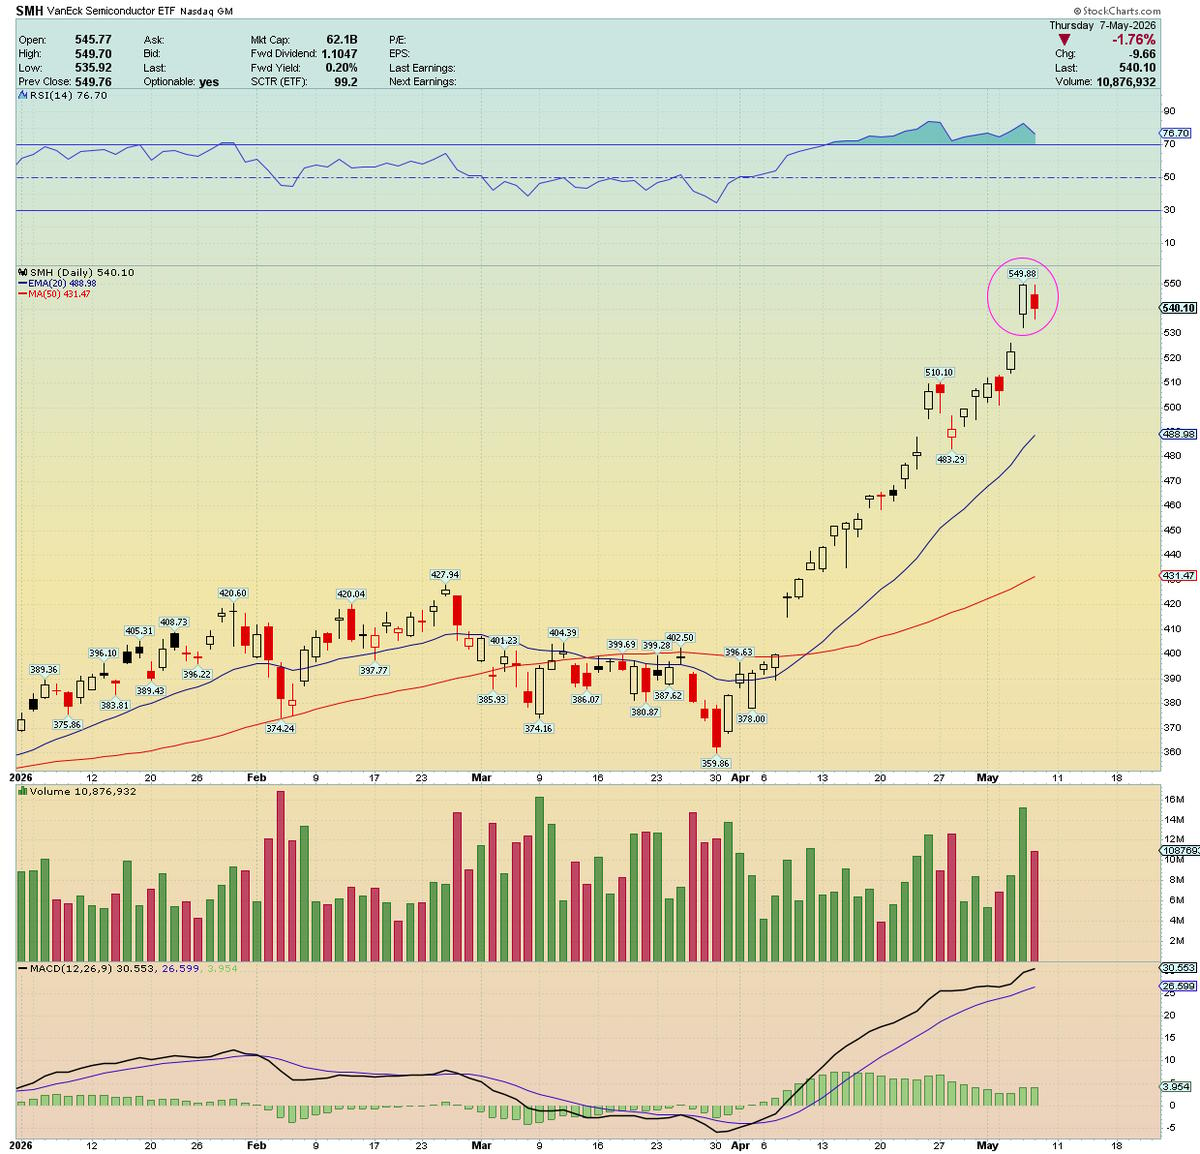
Bearish Harami Signals Overdue SMH Pullback Opportunity
A Bearish Harami candlestick pattern printed in $SMH this week(yesterday and today) ... If a healthy and overdue pullback in this sector is ever going to happen, here's the spot to do it, imho https://t.co/83usB5FgMR
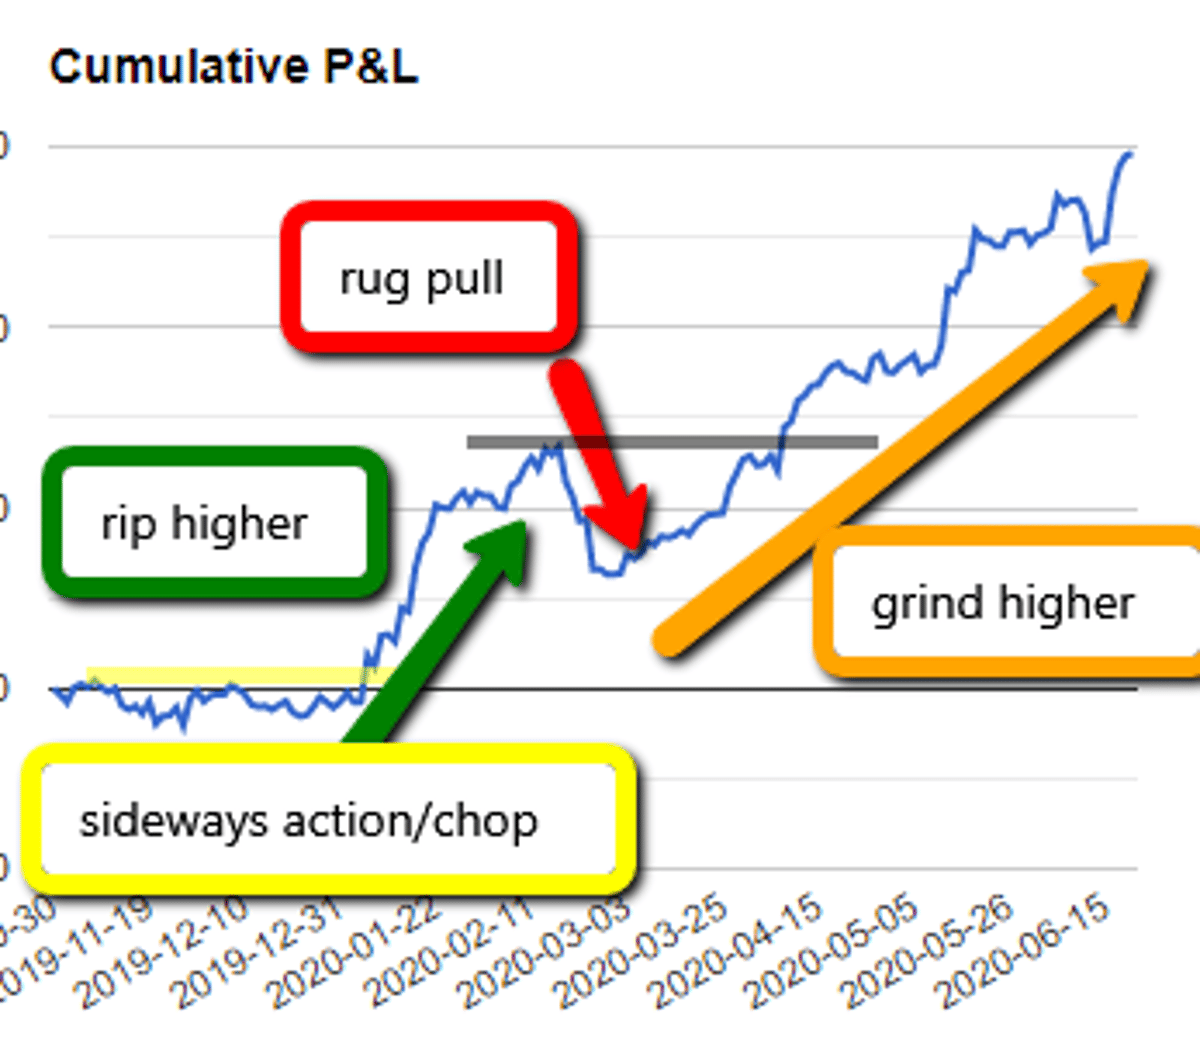
Seeking Higher Lows and Higher Highs Amid Cycles
The cycle never changes: → chop → rip → rug pull → grind higher All you want is: higher lows + higher highs. https://t.co/DKs9o4i2IT

Never Average Down; Adding to Losers Kills You
Paul Tudor Jones lost 65% of his account on one cotton trade in 1979. Then he opened Tudor Investments and made 100% per year for 5 straight years. His "worst" year? Up 99.2%. In '87, he called the crash. Made $100M in a...