Today's American Stocks Pulse

Dow climbs nearly 200 points to record close as oil eases on Iran truce hopes
The Dow Jones Industrial Average jumped about 200 points, closing at a fresh all‑time high. The rally was driven by a pullback in oil prices after optimism surrounding a potential Iran truce. Markets remained cautious amid mixed political signals.

Vanguard Total Stock Market ETF Tops Picks Under $500 Amid Earnings Surge
Analysts recommend Vanguard Total Stock Market ETF (VTI) as the best sub‑$500 ETF, citing 15% Q1 earnings growth for the S&P 500, forward P/E near historical norms, and a 0.03% expense ratio. The pick balances geopolitical headwinds and rising oil prices with robust corporate earnings.
S&P 500 Hits New High on Apple Earnings: Stock Market Today
Apple’s fiscal Q2 beat expectations, driving the S&P 500 to a fresh 7,230 record and lifting the Nasdaq 0.9% to 25,114. The iPhone segment posted a 22% YoY revenue jump, with China sales up 28%, prompting a 3.3% stock surge and...

Stocks Eye Weekly Wins After Impressive April Finish
U.S. equities extended record highs in early May as the S&P 500 and Nasdaq posted their strongest monthly gains since 2020, despite heightened U.S.–Iran tensions and a Wall Street Journal story questioning OpenAI’s finances. Strong earnings from Alphabet, Amazon, Caterpillar and...

IRhythm Q1 Revenue Jumps 25.7% to $199.4M as Wearable ECG Demand Holds Strong
iRhythm posted $199.4 million in first‑quarter revenue, up 25.7% year‑over‑year, as demand for its wearable ECG platform stays robust. The company narrowed its GAAP net loss to $13.9 million but flagged ongoing regulatory scrutiny, including an FDA warning letter and a pending...

Pershing Square Closes $5 Billion Dual-Listing IPO, Marks Major Capital Markets Event
Pershing Square USA and Pershing Square Inc. closed a combined initial public offering that raised $5 billion in gross proceeds. The shares began trading on the NYSE on April 29, 2026 under the symbols PSUS and PS, with a consortium of...

S&P 500 Sets New Record as Optimism Over Iran Conflict Fuels Large‑Cap Rally
The S&P 500 climbed to a new all‑time high, up 0.12%, as investors bet on a swift resolution to the Iran conflict. Billionaire Howard Marks warned that the rally may not be a bargain, while Bill Ackman defended the premium...

Vanguard Russell 2000 ETF Posts 11.1% YTD Gain, Beats S&P 500, Nasdaq‑100 and Dow
Vanguard's Russell 2000 ETF (VTWO) logged an 11.1% year‑to‑date return through March 2026, eclipsing the modest 1.6%‑7.1% gains of the S&P 500, Nasdaq‑100 and Dow Jones. The outperformance stems from diversified small‑cap exposure and favorable U.S. policy tailwinds, while larger‑cap indexes remain...
Sell in May and Go Away? Not so Fast, as Earnings, Geopolitics May Offset Seasonal Concerns
The classic “sell in May and go away” rule is losing traction as the S&P 500 rebounded 10% in just 11 sessions after an oil‑supply shock, erasing a near‑10% decline. Historical data shows a modest 2% gain for May‑October since 1945,...

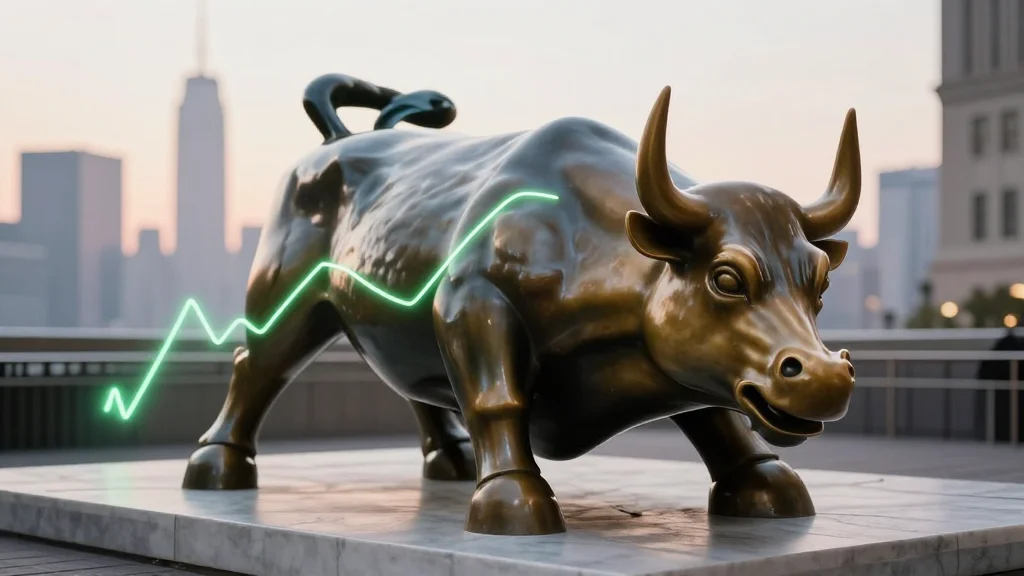
US Markets Surge $400B, New All‑Time Highs Signal Bull Run
🚨 BULL MARKET IS COMING 🚨 U.S. markets opened adding another $400,000,000,000 today. S&P 500 hits new all-time high 🔥 NASDAQ hits new all-time high 🔥 Over $6 trillion Mcap added to the US stock market in APRIL. POSSIBLE SIGNS OF END OF WAR &...

Tech Rally Defies Stagflation as ISM Stalls
Basically, the call wall (SPX $7200 was ceiling/now floor) keeps getting rolled up as AI/Tech/Memory names beat, while the real economy enters stagflation. US APRIL ISM MANUFACTURING INDEX UNCHANGED AT 52.7; EST. 53.2 US ISM MFG PRICES RISE TO 84.6, HIGHEST SINCE...

Tech Stocks Surge as Healthcare Faces Setbacks
Technology stocks led the market higher, with Oracle surging 5.05% and Microsoft gaining 1.38%, while the broader tech sector benefited from strong demand for cloud and AI services. In contrast, the healthcare index fell as Amgen dropped 4.81%, though Eli Lilly...

10‑Q Filings Reveal Earnings Details Beyond Hype
It’s been a week of hyperscaler earnings. Microsoft, Meta, Amazon, and Google all reported. Not surprisingly, the big capex spending got the headlines. But as I was taught as a young reporter, a press release is just that, a press release....
Rule Change so SpaceX Should Join Sp500 6 Months After IPO
The S&P Dow Jones Indices has proposed rule changes that would let megacap firms such as SpaceX qualify for index inclusion after just six months of public trading, cutting the current twelve‑month waiting period. The proposal also removes the 10 %...
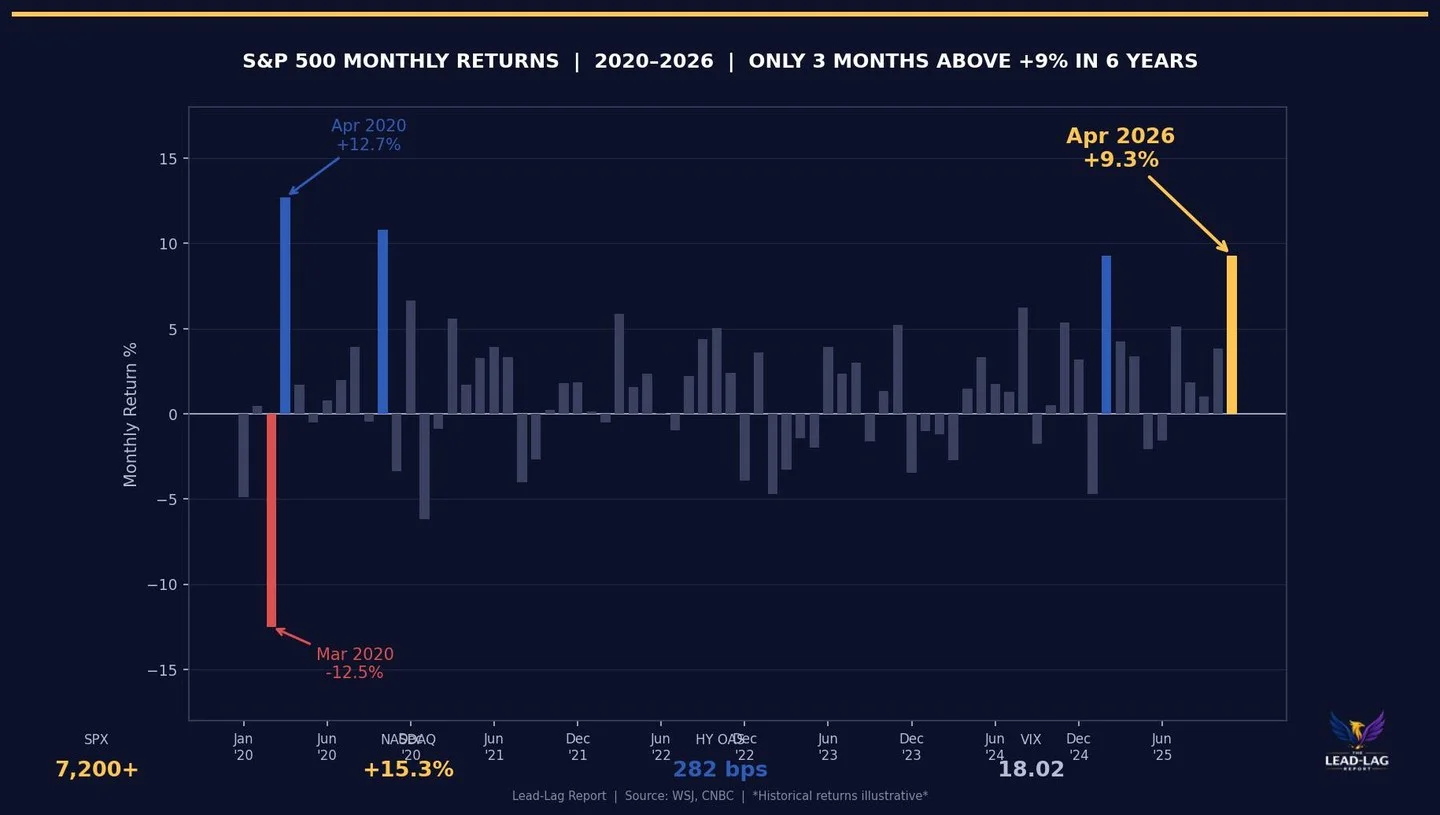
Record Highs and Low Volatility Signal Dangerous Market Crowding
Record closes and “calm” volatility are a dangerous combo. SPX: first close above 7,200. Nasdaq: +15.3% in April. HY spreads: ~282 bps. VIX: 18.02. That’s not fear. That’s crowding. The unwind never rings a bell. markets

Company News for May 1, 2026
Alphabet’s shares jumped 10% after reporting Q1 2026 adjusted earnings of $5.11 per share, far exceeding the $2.64 consensus. Eli Lilly saw a 9.8% rise on Q1 fiscal 2026 revenue of $19.8 billion, beating the $17.6 billion estimate. Qualcomm posted a 15.1% surge...
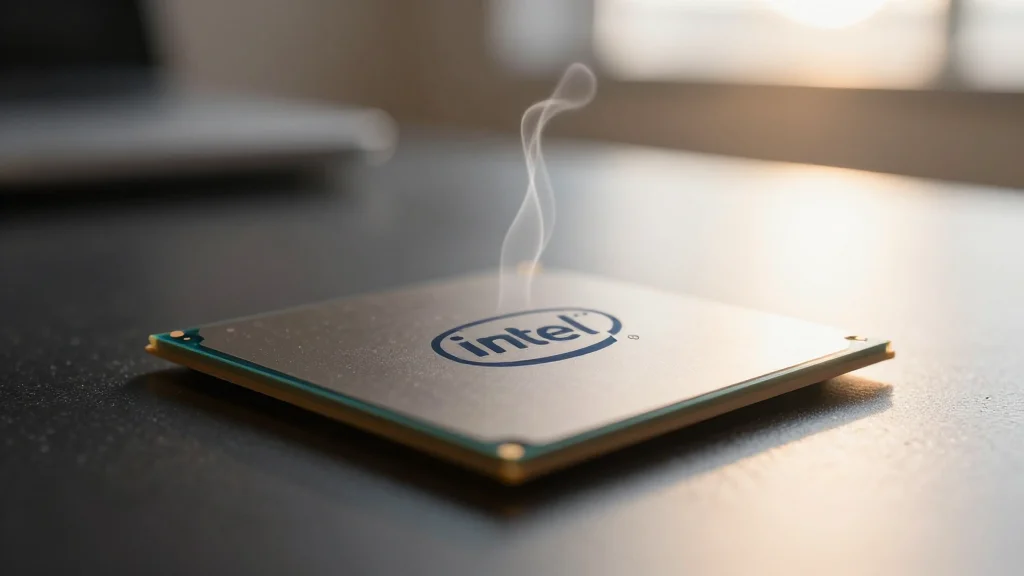
Cramer Dismisses Intel Bear Case After 16% Post‑Earnings Rally
Jim Cramer announced on X that he has "NO bear case" on Intel after the company reported Q1 2026 revenue of $13.6 billion, a 7% year‑over‑year rise that topped consensus by $1.3 billion. The earnings beat sparked a 16% after‑hours rally and...

Tetra Tech Posts 8% Q2 Revenue Rise on Surge in High-End Consulting
Tetra Tech announced second‑quarter 2026 net revenue of $1.05 billion, an 8% year‑over‑year increase, as high‑end consulting for water, environment and sustainable infrastructure lifted EBITDA to a record $146 million. The results prompted an upgrade to full‑year guidance and a larger dividend.

Caterpillar Beats Q1 Estimates, Lifts Dow 1.5% as Shares Surge 10%
Caterpillar reported first‑quarter revenue that rose 22% year‑over‑year, beating analysts' forecasts and sending its stock up 10.12%. The earnings lift helped the Dow Jones Industrial Average climb 1.5%, offsetting weakness in mega‑cap tech stocks.
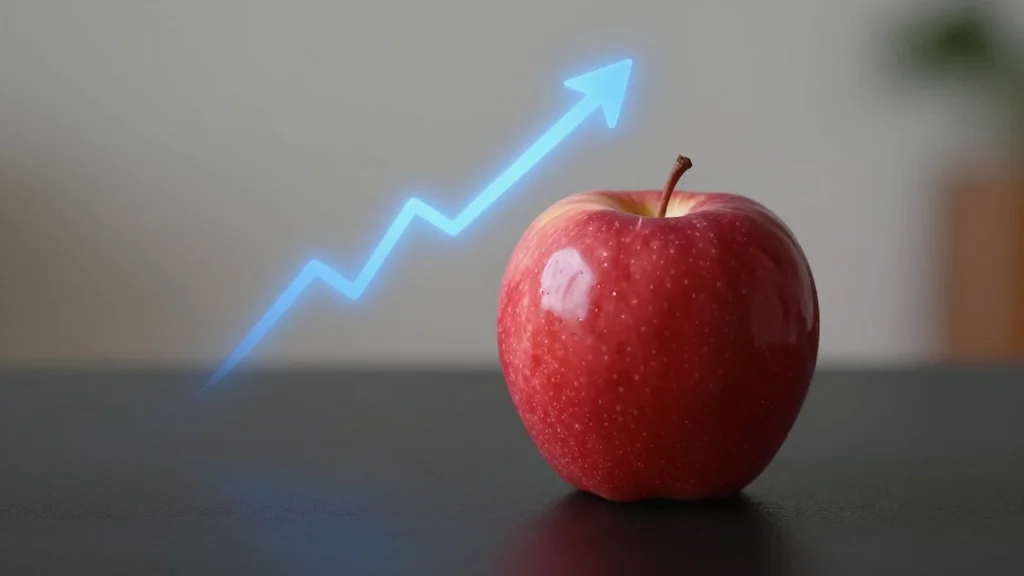
Apple Posts $111.2 B Q2 Revenue, Forecasts 14‑17% Growth and Names John Ternus as Next CEO
Apple announced $111.2 B in Q2 2026 revenue, up 17% year‑over‑year, and gave guidance for 14‑17% revenue growth in the June quarter. The earnings call also confirmed a leadership change, with chief engineer John Ternus slated to become CEO and Tim...

Morning Market Brief
In this Morning Market Brief, Lawrence Fuller highlights the Nasdaq and S&P 500 hitting all‑time highs, driven by a strong rally in small‑cap stocks and upbeat earnings. He breaks down the latest economic data—Q1 GDP at 2%, personal spending up...

TMTB Morning Wrap
Futures in the S&P 500 edged up 15 basis points after a wave of strong earnings from internet and software companies. Twilio (TWLO), Atlassian (TEAM), Riot Platforms (RDDT) and Roku (ROKU) all posted beats, while Roblox (RBLX) lagged and Apple...
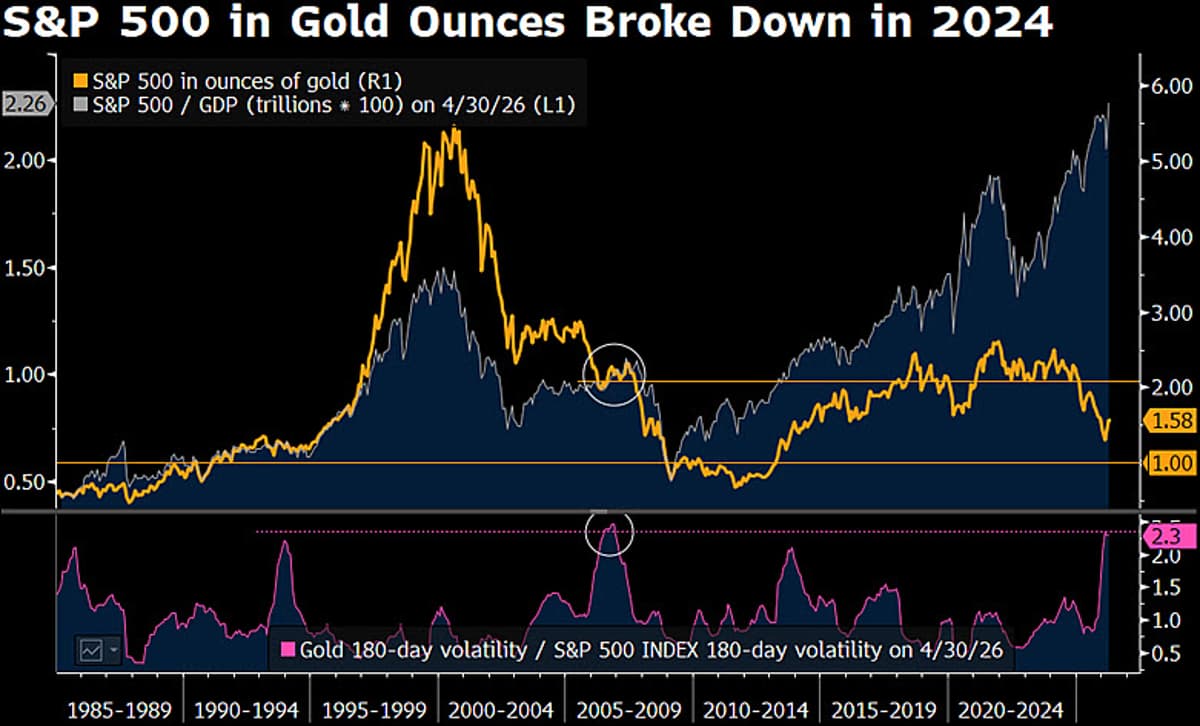
SPX/Gold Ratio Likely Keeps Falling Through 2026
SPX/Gold Trend Is Down; Can It Continue in 2026? The S&P 500 in gold ounces breached 2.0 support in 2024, and the next big driver may be the SPX. At 1.58 on April 31, the SPX/gold ratio has bounced from 1.29...
Morning Reads
Wall Street posted its strongest month since 2020, with the Nasdaq Composite jumping over 15% and the S&P 500 gaining 10% in May. The surge was powered by a resurgence in AI infrastructure stocks, highlighted by triple‑digit gains at Intel and...

Sell in May and Go Away? Maybe Not
U.S. equities have surged, with the S&P 500 up 9.2% through April and on track for its strongest April performance since 2020. The rally is fueled by easing Iran tensions, expectations of the Strait of Hormuz reopening, and solid Q1 earnings....

Apple's Strong Earnings Boost Mega Caps, Manufacturing Data Next
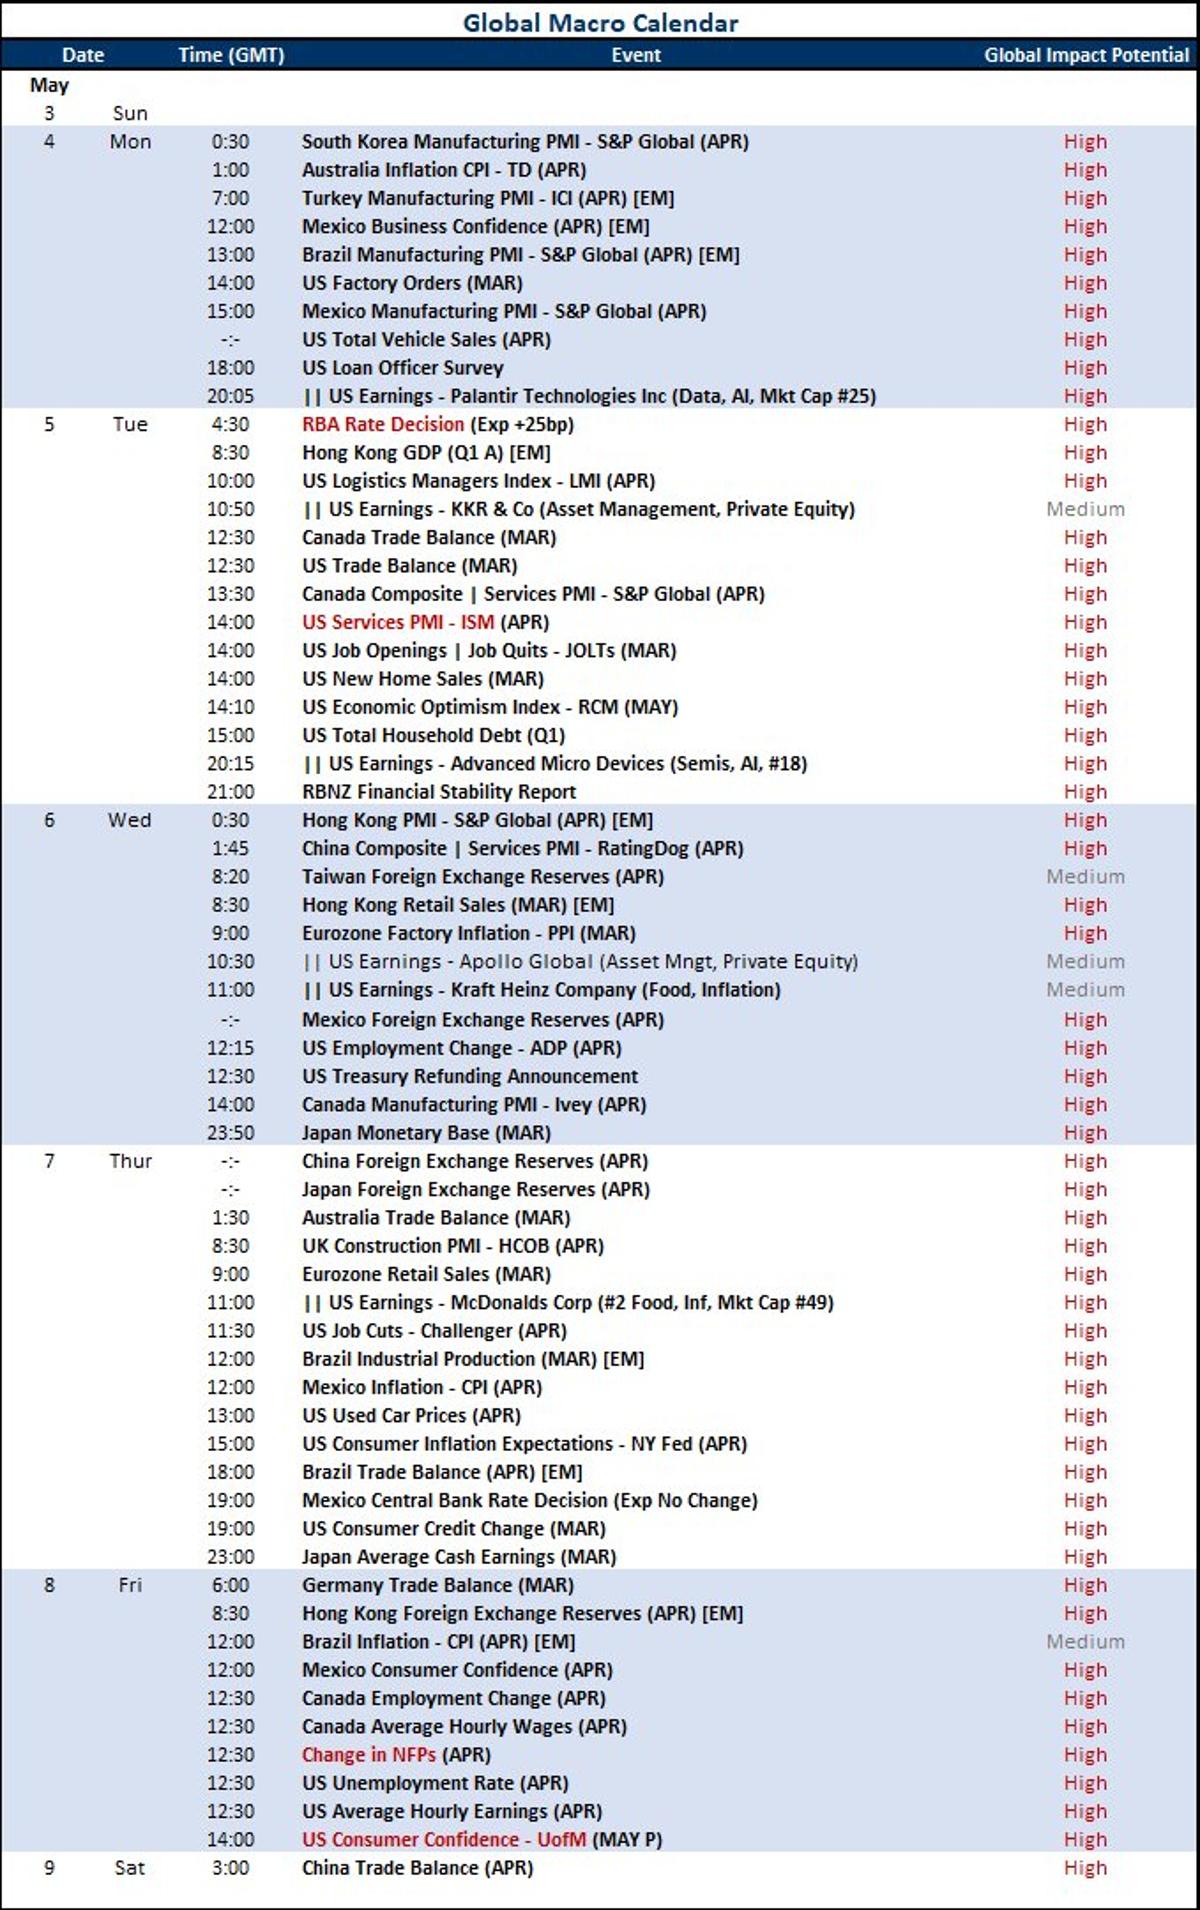
🚨 Morning Market Rundown – May 1, 2026 🚨 Manufacturing data + a big $AAPL earnings reaction headline the open 👀 🗓️ Economic Events: 0945 - S&P Manufacturing PMI (Apr): Exp 54; Prior 54 1000 - ISM Manufacturing PMI (Apr): Exp 53.2; Prior 52.7 📈...
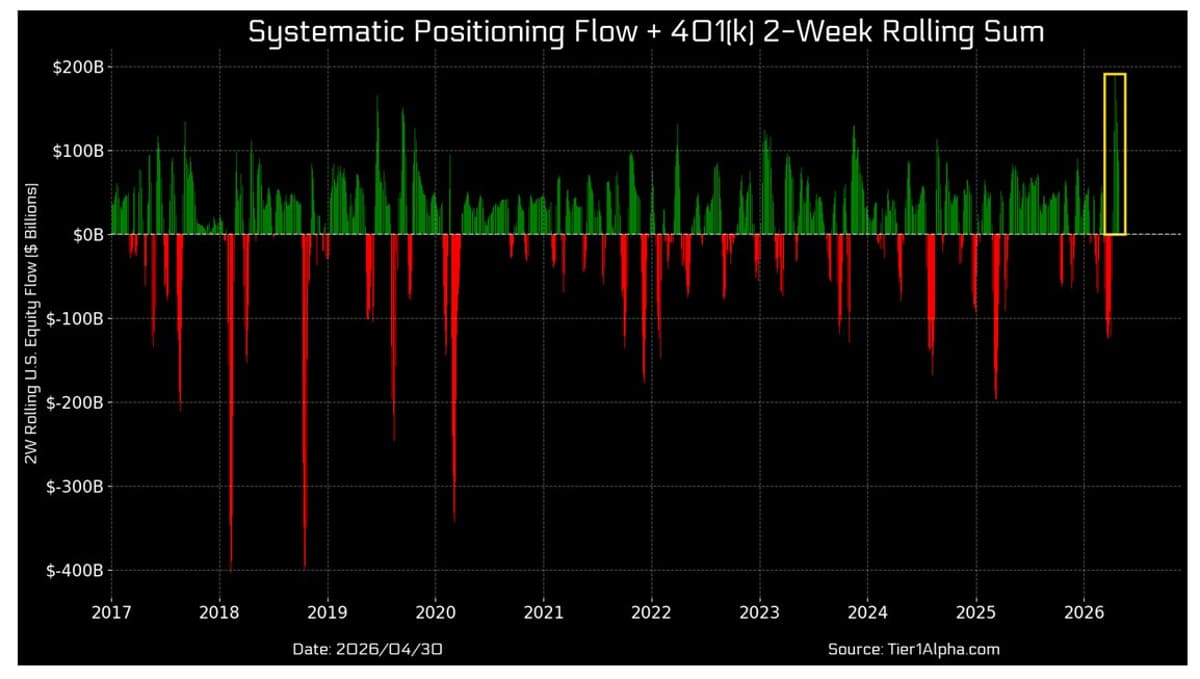
Massive 401(k) Flows Drive Equity Rally
The Flows If you don't have the humility to respect either the market or its flows, you'll get an education "As we have been tracking over the past several weeks, a large part of that move was supported by an estimated...

Walmart and Costco Outperform as Retail Titans Show Resilience
Walmart and Costco posted strong earnings and stock performance as consumer spending patterns shift, with Walmart’s advertising business expanding 37% and Costco’s membership fees rising 13.6% in Q2 FY2026. Both firms are navigating tariff refunds and operational tweaks while maintaining...

Viavi Solutions Beats Q3 2026 Estimates, Raises Q4 Guidance, Stock Jumps 15%
Viavi Solutions reported Q3 fiscal 2026 revenue of $406.8 million, surpassing analyst expectations and delivering EPS of $0.27. The company also lifted its Q4 revenue guidance to $427‑$437 million and adjusted‑EPS outlook to $0.29‑$0.31, prompting the stock to rally more than 15%...

ARK Invest Pours $18 M Into CoreWeave as AI Stock Slides
ARK Investment Management, led by Cathie Wood, purchased 162,306 shares of CoreWeave for roughly $18.2 million on April 28, as the stock fell 5.8% after OpenAI missed internal targets. The move adds to a year‑to‑date ARK investment of at least $80 million, underscoring...

Apple Results Mulled as Earnings Parade Continues
The Schwab Market Update highlighted the aftermath of a blockbuster earnings week featuring Apple, Alphabet, Amazon, Meta, and Microsoft, noting that Apple beat forecasts with 16% revenue growth and a strong services segment, while Meta’s stock fell despite revenue gains...

US Stocks Close Higher Amid Strong Corporate Earnings
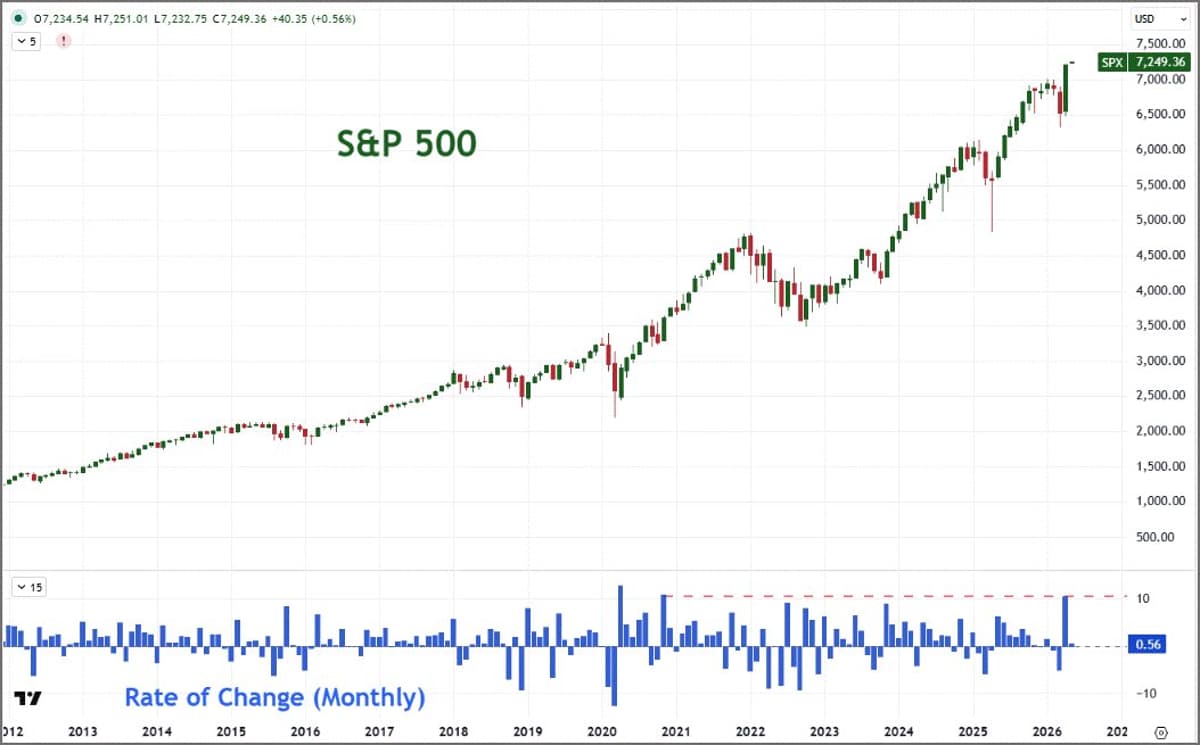
U.S. equities closed higher on Thursday as strong corporate earnings outweighed weaker‑than‑expected first‑quarter GDP growth. The Dow jumped 1.6% to 49,652, the S&P 500 rose 1.0% to 7,209, and the Nasdaq added 0.9% to 24,892. Ten of the eleven S&P...

The Roaring 2020s Express Train
U.S. equities are climbing to fresh highs as corporate earnings keep pace with a surprisingly resilient economy. In Q1, real GDP expanded at a 2.0% annualized rate, with private sales up 2.5% and business investment surging on AI‑related equipment spending....
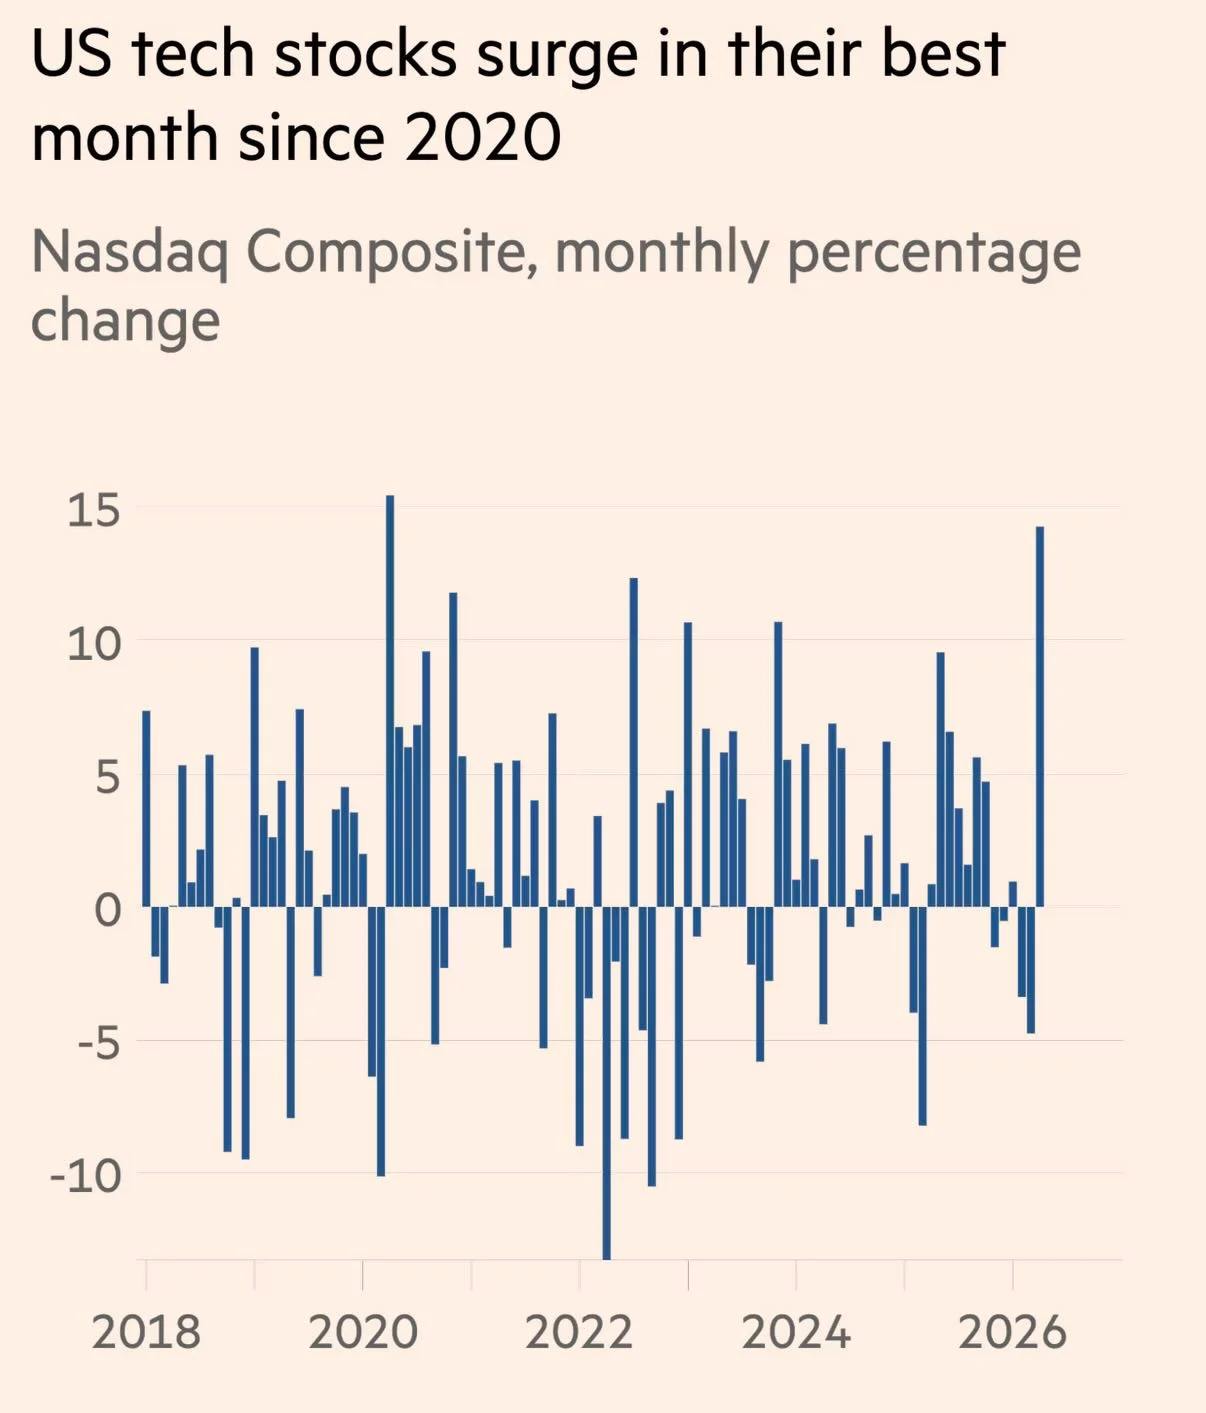
US Stocks Surge to Best Month Since 2020
From the FT article, “US stocks hit record highs in Wall Street’s best month since 2020.” #economy #markets #stocks #investing #investors
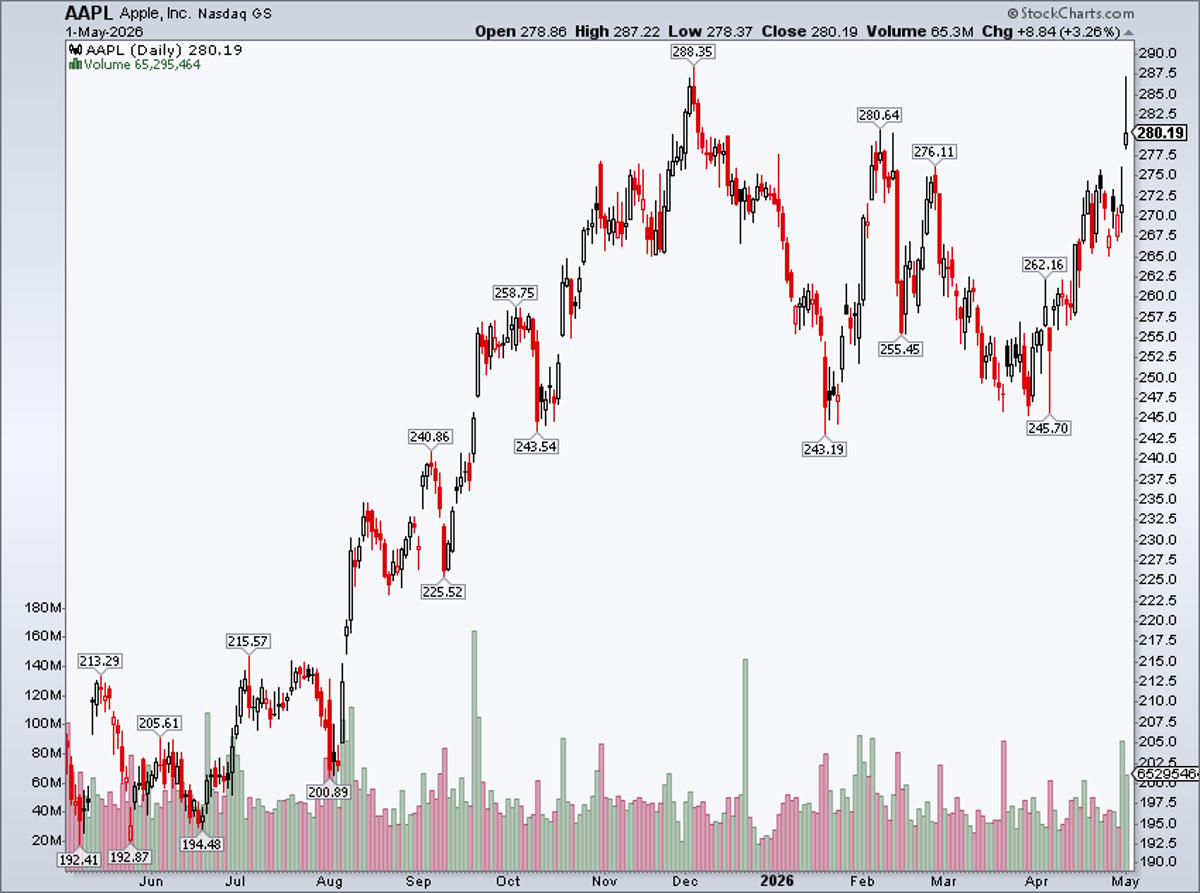
Apple Hits YTD High, Shows Bearish Shadow Pre‑Berkshire
$AAPL YTD high, but a long upper shadow there... all ahead of the Berkshire meeting tomorrow https://t.co/YhMnG1IOcu

10 Stocks Delivering Eye-Popping Gains
A dozen large‑cap stocks posted double‑digit gains on Thursday, echoing a broader Wall Street rally driven by robust earnings reports. The Dow and S&P 500 each rose over 1%, while the Nasdaq added 0.89%. Companies such as Magnum Ice Cream...

Predicting the Next Dow Jones Add and Drop
Which stock gets removed from the Dow Jones Industrial Average next, and which one gets added next?
Nasdaq Climbs Amid US‑Iran Tensions, Near Record High
My video looking at trading conditions and top themes/event risks over the coming week: Nasdaq Advances Amid US-Iran Uncertainties: 'The Most Hated' Record High? https://t.co/lbmgMBgy9x https://t.co/A83bN9fTZ3

5 Stocks Delivering Eye-Popping Gains
Lightwave Logic Inc. (LWLG) surged 16.67% on Thursday, closing at $13.72 as AI‑driven growth sentiment lifted high‑performance chip makers. The jump mirrored broader market gains, with the Dow and S&P 500 up over 1% and the Nasdaq up 0.89%. Lightwave announced...
Only 8 S&P 500 Stocks Double, None Halve This Year
8 S&P 500 stocks are up 100% or more YTD 0 S&P 500 stocks are down 50% or more YTD https://t.co/ZbrCrmPrha

Large‑cap New Highs Outpace Lows 89 to 13
there are 89 large-cap stocks hitting the 52-week new highs list today... there are 13 large-cap stocks hitting the 52-week new lows list... #HighLowShow #marketUpdate #investing
U.S. Q1 2026 GDP Up 2% as Shutdown Ends, Iran Conflict Raises Risk
The U.S. economy expanded 2% in the January‑March 2026 quarter, rebounding from a recent federal shutdown. Analysts note that the same data release highlighted heightened geopolitical risk from the ongoing Iran conflict, a factor that could temper investor enthusiasm for...
Dealers Short Gamma as SPX Rises 2.3%
What did I write Wed AM to warn clients: "Dealers enter aggressive short gamma should the index move 2-4% higher. via GS" And what has SPX moved since Wed low? +2.3%. Careful late bulls...
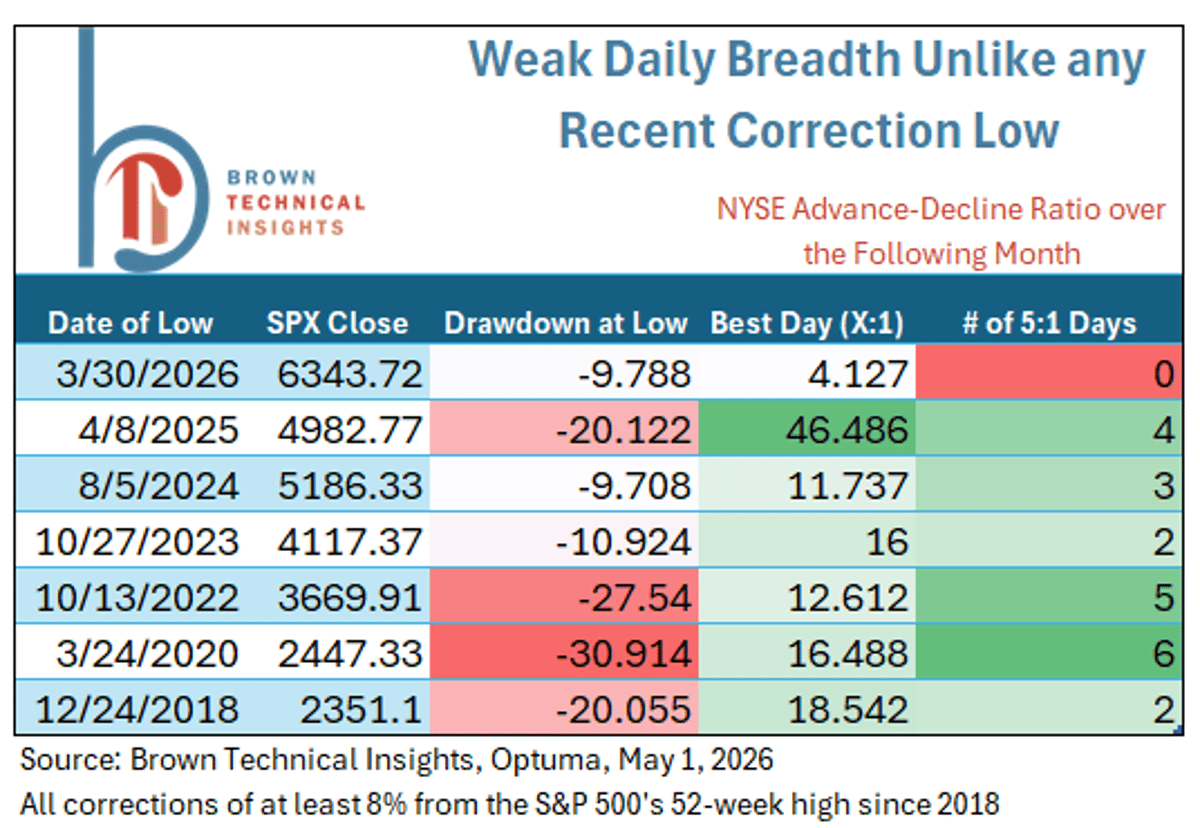
Recovery Lacks Breadth, 4:1 Ratio Signals Weakness
Officially one month off the low, and this recovery has been unlike any in recent history. Best day of NYSE breadth has been just 4:1 advancers to decliners. All recent recoveries had at least two days of better than 5:1, and...

Wall Street Sees BMY Lift, BIIB Rise, REGN Uncertainty
Latest snapshot of Wall Street's take on a trio of earnings reports, from @ByJonGardner and @realJacobBell Bristol Myers’ legacy lift, Biogen’s blue skies and Regeneron’s murky outlook https://t.co/PnGb0o93WL $BIIB $BMY $REGN
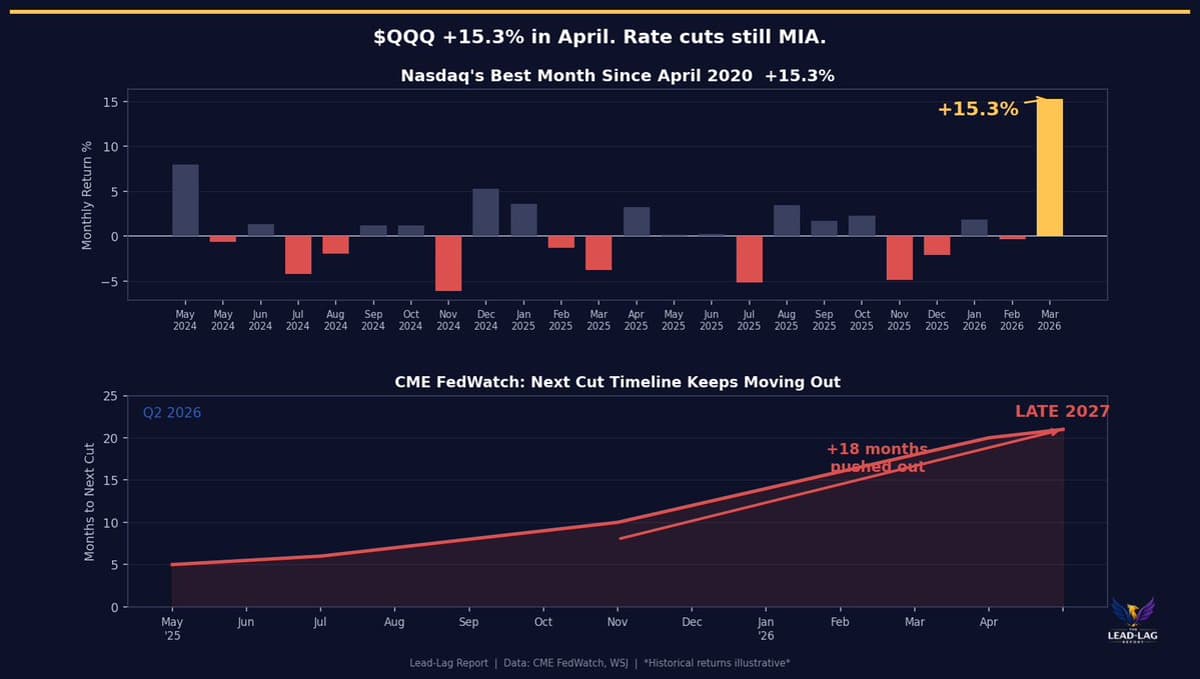
Nasdaq up 15% in April, HY Spreads Stay High
April +15.3% on Nasdaq… and HY OAS is ~282 bps. That’s not “risk-off.” $QQQ https://t.co/NMz38kcNP3
S&P 500's Biggest Rally Since 2020 Fueled by Dip
The $SPX posted its biggest monthly rally since November 2020 - and it only took the largest monthly dip in 12 months to charge it and the word 'ceasefire' to trigger the reversal. Risk appetite is just ambivalent, it feels...
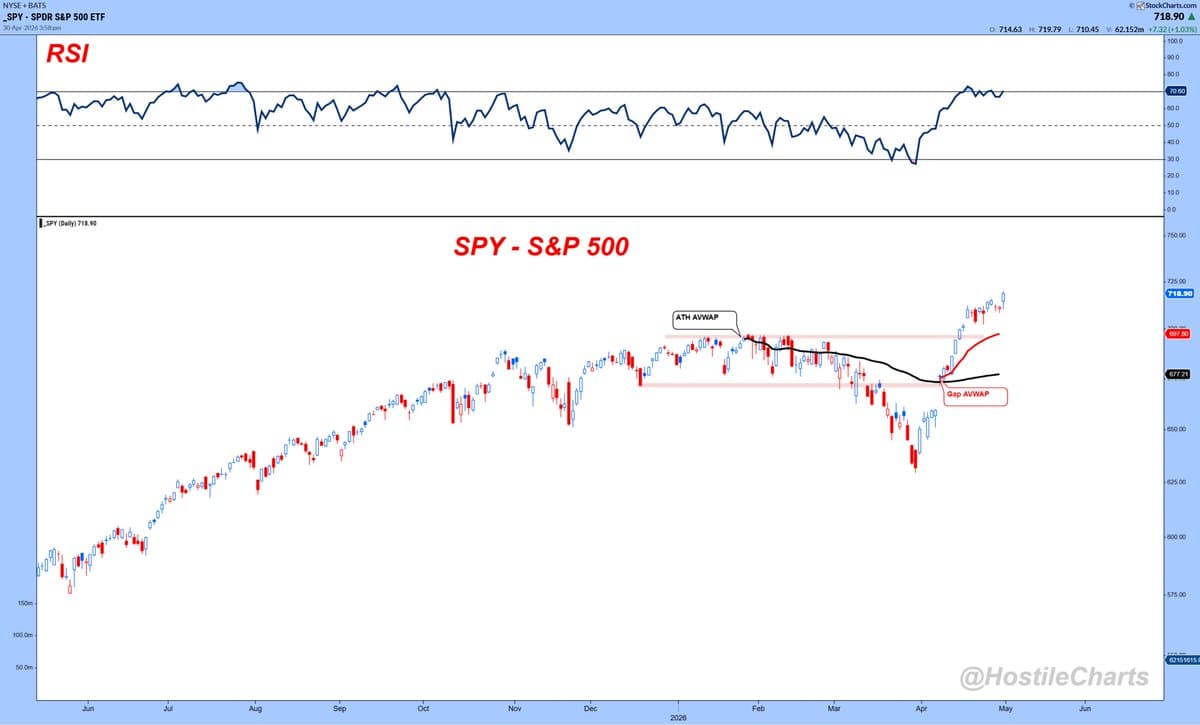
S&P Breaks Out After 6‑8‑Month Stagnation
$SPY - Sure...the S&P moved fast off the lows...but it's also just now resolving a 6-8 month range of nothingness. https://t.co/Ve4gwxbkrC
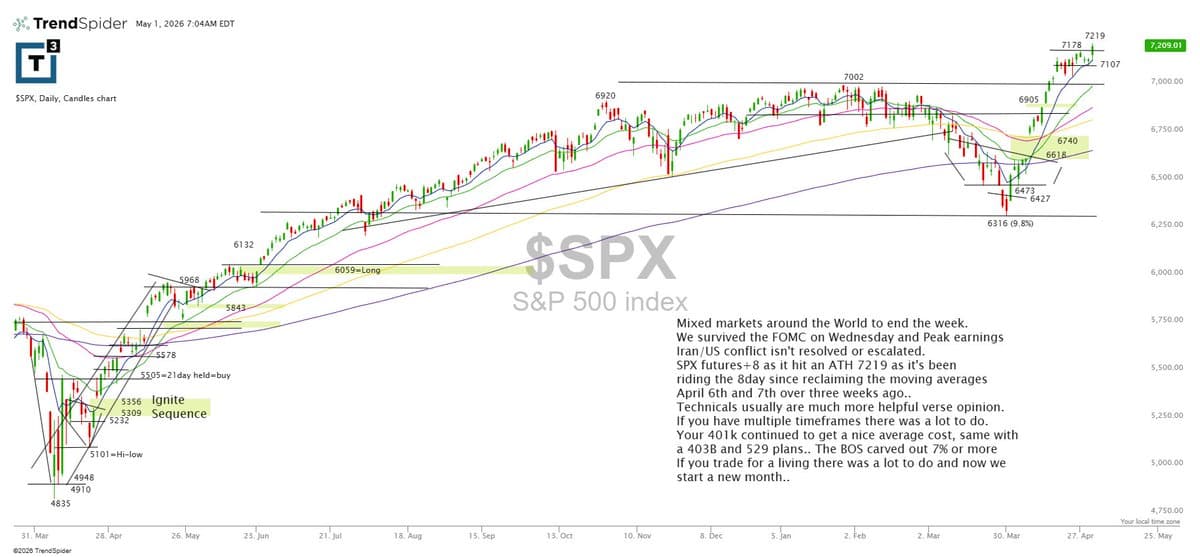
SPX Futures Surge 8 Points After New ATH
$SPX futures +8 after tagging a new ATH at 7219, as it’s been riding the 8-day since reclaiming the moving averages in early April. There was a lot to do across timeframes, and now we start a new month. https://t.co/tGRY36Jv0v
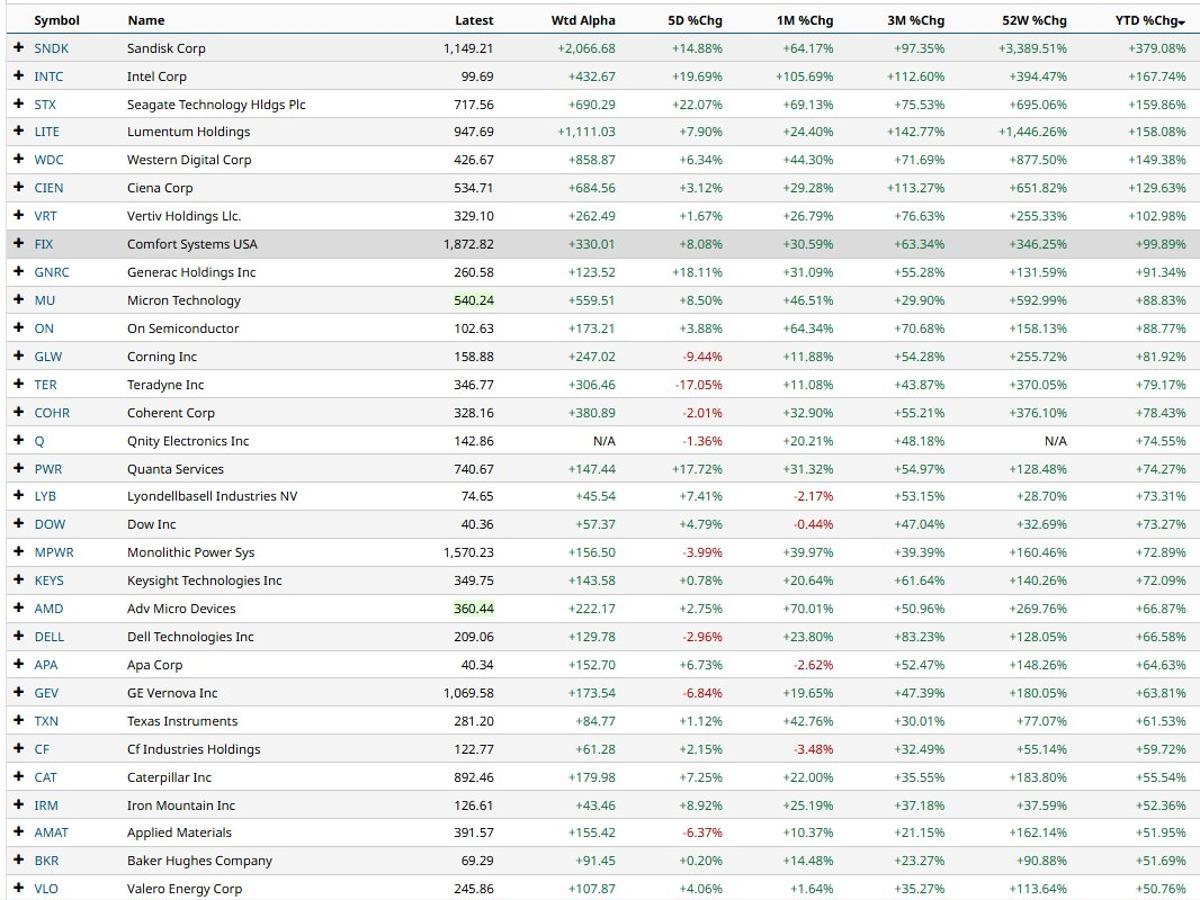
Tech Leads S&P to Record Amid Broad Sector Weakness
Five of eleven sectors are red on the year. The S&P just printed its tenth record of 2026 anyway. Intel +24% in a session. Tech now leads on every lookback for the first time this cycle. The whole rally is one sector deep. https://t.co/GoP96luvwI

US Wealth Overleveraged as S&P Pushes Faster Mega IPOs
Smoking in the Dynamite Shed The US economy and household wealth are way, way, I mean WAY dangerously levered to the stock market, and now this? *S&P MULLS INDEX RULE CHANGES TO SPEED UP ADDITION OF MEGA IPOS.