Today's American Stocks Pulse
Goldman Sachs lifts S&P 500 year‑end target, dismisses bubble fears
Goldman Sachs raised its forecast for the S&P 500’s year‑end level, citing continued earnings strength, and said the market is not in a bubble. Analysts also note a potential melt‑up could push the index toward 8,000 if momentum holds.

Archer Aviation Shares Rally as Investor Appetite Grows Amid eVTOL Funding Crunch
Archer Aviation’s shares rose sharply after analysts highlighted renewed investor interest despite a 26% plunge this year. The surge reflects optimism over a $1 trillion urban air‑mobility market, United Airlines’ $25 million stake and looming certification hurdles that pit Archer against rivals like Joby.
April 2026 S&P Gains 10% Amid War, Optimism Returns
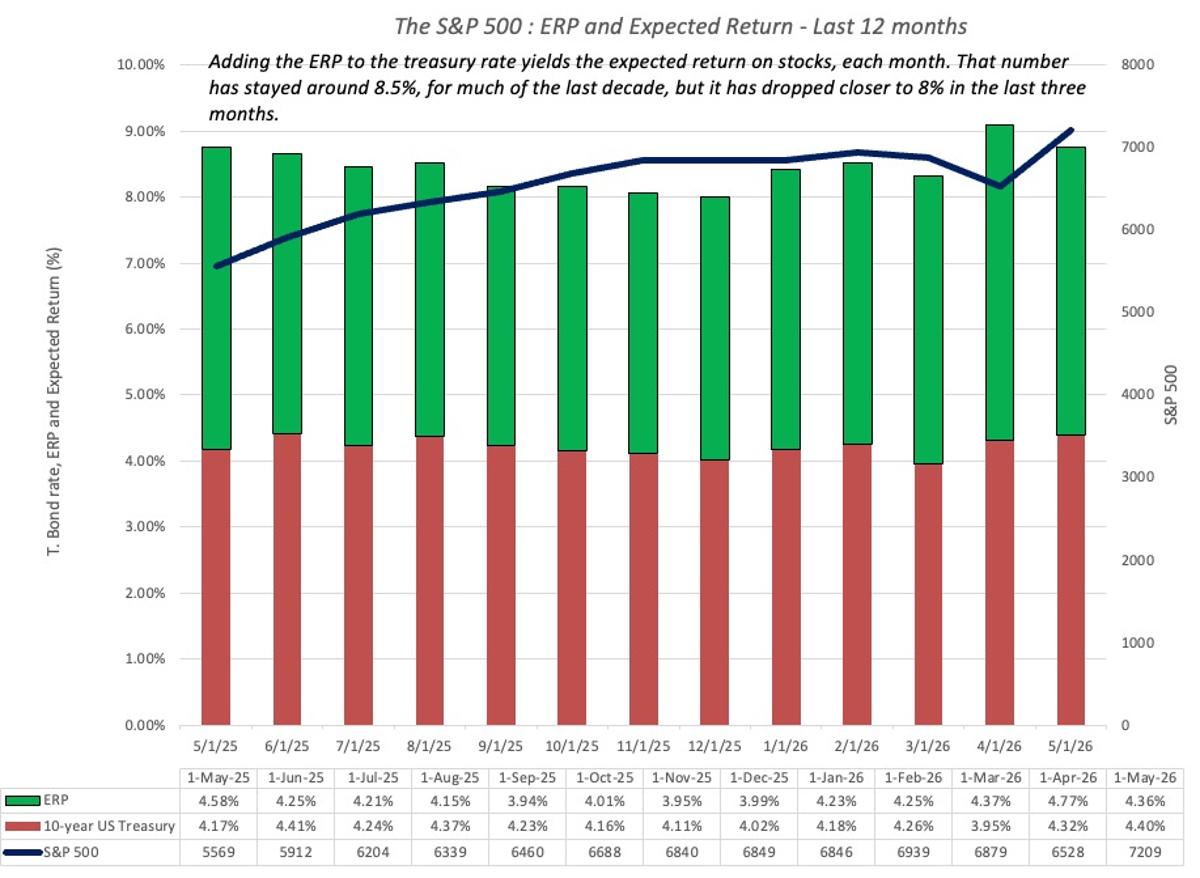
In April 2026, US equities saw light in the midst of war and chaos. The S&P 500 rose 10.43%, its best month since April 2020, coming of COVID lows, and the ERP for the index dropped to 4.37%. The market...

The S&P 500 and Nasdaq Kept Their Record Rallies Going. Here Are 3 Key Takeaways
The S&P 500 and Nasdaq posted a fifth straight week of gains, each closing at record levels three times during the week. A surge in oil prices tied to Middle‑East tensions did not deter investors, while first‑quarter earnings from mega‑caps drove...

From AMD To Disney, The Wall Street Week Ahead Is Packed
Wall Street ended the week on a high note as Apple posted its strongest March quarter, lifting the stock nearly 4%, while Alphabet delivered $109.9 billion in Q1 revenue and saw Google Cloud exceed $20 billion for the first time. Oil prices...
High EPS Growth Forecasts Often Precede Weak SPX Returns
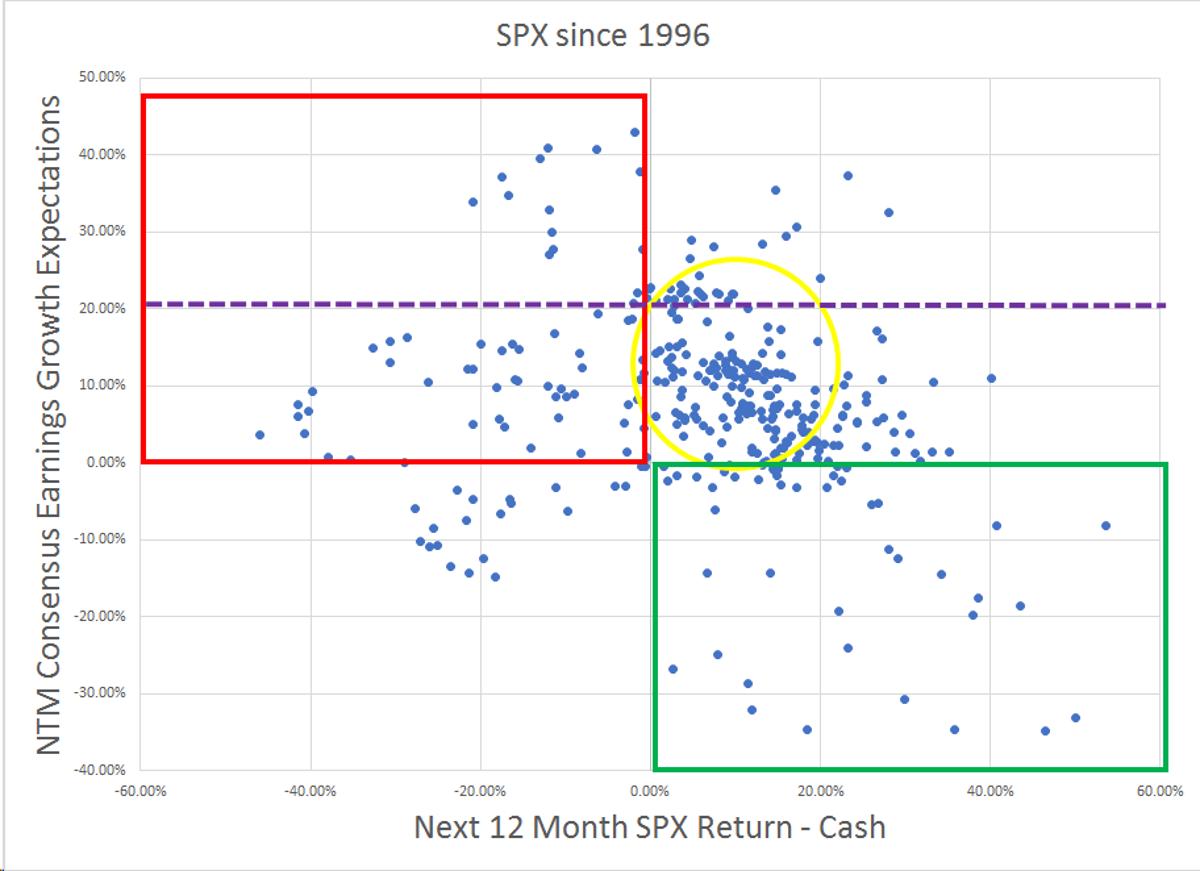
These charts use consensus NTM Growth Rates and subsequent SPX Returns monthly going back to 1996 Current SPX EPS Growth Rate is 20% Purple Line Sample correlation is -21% Intuition to me makes sense that most of the time when growth rate expectations...
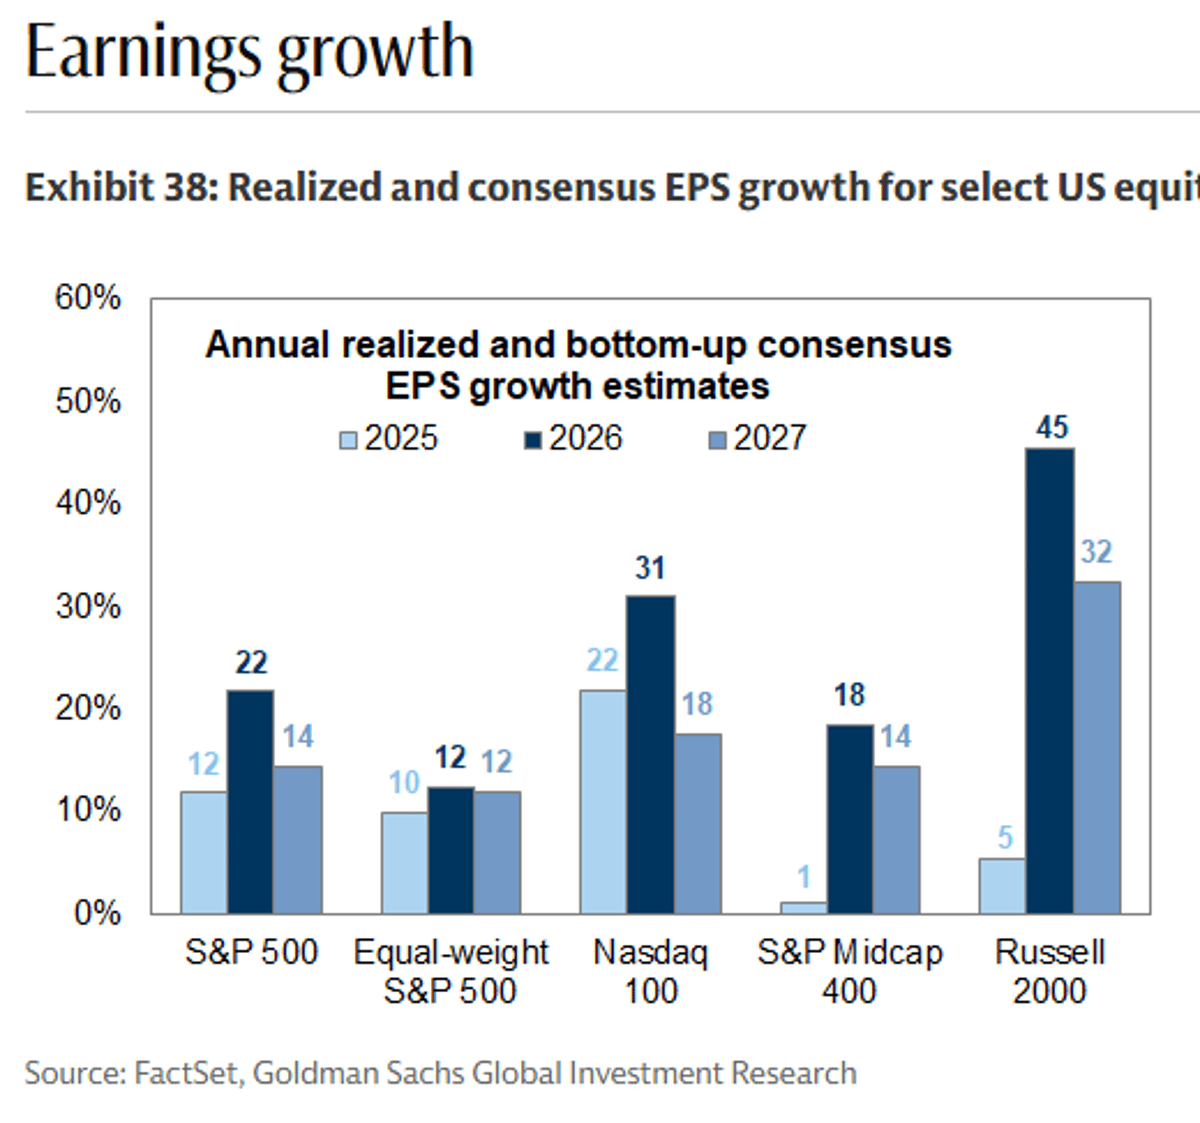
S&P 500 EPS Projected to Rise 22% This Year
22% S&P 500 EPS growth expected this year... and it has been trending higher GS https://t.co/MIGNciysdn

Citi Resets Outlook on General Motors' Stock Price Target
Citi raised its price target for General Motors to $108 from $105 after the automaker’s Q1 2026 results beat expectations, highlighting strong margin expansion and a $500 million tariff refund. GM posted adjusted EPS of $3.70 versus the $2.62 consensus and EBIT‑adjusted...
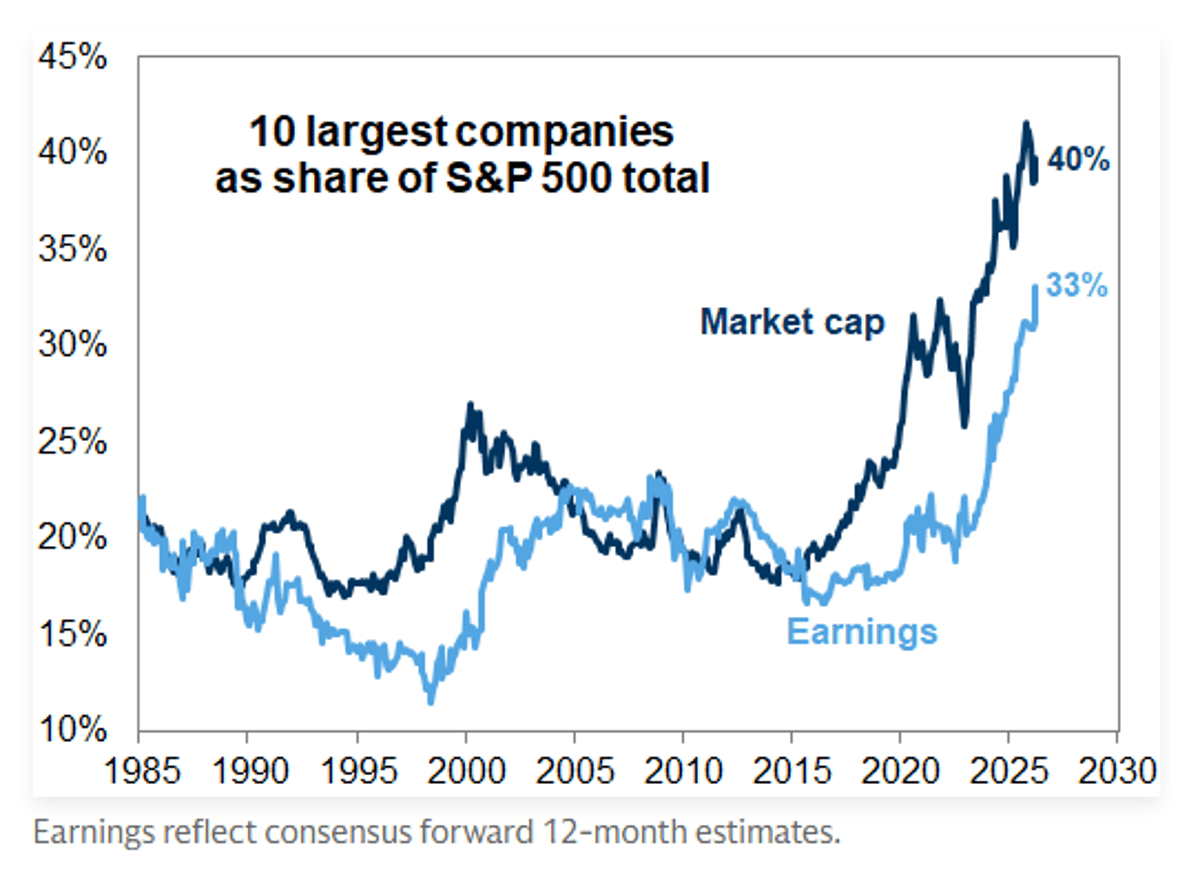
Top 10 Stocks Now Contribute 33% of Earnings
A major uptick in the earnings contribution from the 10 largest stocks.. now 33% GS https://t.co/XJI0aB2hzH

Corporate America Earnings Beat Back Wall Street’s Wall of Worry
First‑quarter earnings season has outperformed expectations, pushing US equities to new records. The proportion of S&P 500 companies missing analysts’ forecasts fell to its lowest level since 2021, driven largely by non‑tech firms posting the strongest surprise since Q4 2024. Small‑cap stocks...

Economist Gary Shilling Warns of U.S. Recession and 30% S&P 500 Drop by Year‑End
Gary Shilling, the Merrill‑Lynch‑trained economist, told Business Insider that a U.S. recession is almost unavoidable this year and the S&P 500 could tumble 20‑30% by December. He cites stagnant consumer income, frozen housing activity and record‑high valuation multiples as the...
Buffett‑Backed S&P 500 ETFs Flagged as Must‑Holds for Long‑Term Investors
Warren Buffett reiterated that most investors should anchor their portfolios with a single S&P 500 index ETF, such as SPDR's SPY or Vanguard's VOO. The Oracle of Omaha’s endorsement comes amid data showing that nearly 90% of large‑cap funds have lagged...

Chevron Posts $2.8 B Adjusted Q1 Profit, CFO Bonner Outlines $4 B Capex Plan
Chevron delivered $2.8 billion in adjusted earnings for Q1 2026, driven by higher oil prices and Hess asset integration. CFO Eimear P. Bonner confirmed $3.9 billion of organic capital spending and a $4.1 billion adjusted free‑cash‑flow figure, while reiterating 2026 production and cost‑reduction targets.

ExxonMobil Q1 Upstream Production Rises 8% Amid Middle East Disruptions, Earnings Drop 46%
ExxonMobil posted Q1 2026 earnings of $4.18 billion, down 46% from a year earlier, but its upstream segment grew 8% year‑over‑year despite external disruptions in the Middle East, Kazakhstan and a Permian winter storm. Management highlighted record Guyana output, a new...

Brookfield Renewable Posts 19% Q1 FFO Jump, Shares Climb 3.2% to $34.19
Brookfield Renewable Partners posted a record first‑quarter Funds From Operations of $375 million, up 19% year‑over‑year, and its shares jumped 3.2% to $34.19. The surge reflects strong hydro, wind‑solar performance, a $6.5 billion Boralex acquisition and nearly $3 billion of asset‑recycling proceeds.

Spotify Shares Tumble 44% as Earnings Miss Fuels Valuation Debate
Spotify's shares dropped 44% after the music streaming giant posted modest revenue growth and a sharp profit surge, prompting analysts to question the sustainability of its user growth and whether the current valuation is justified.
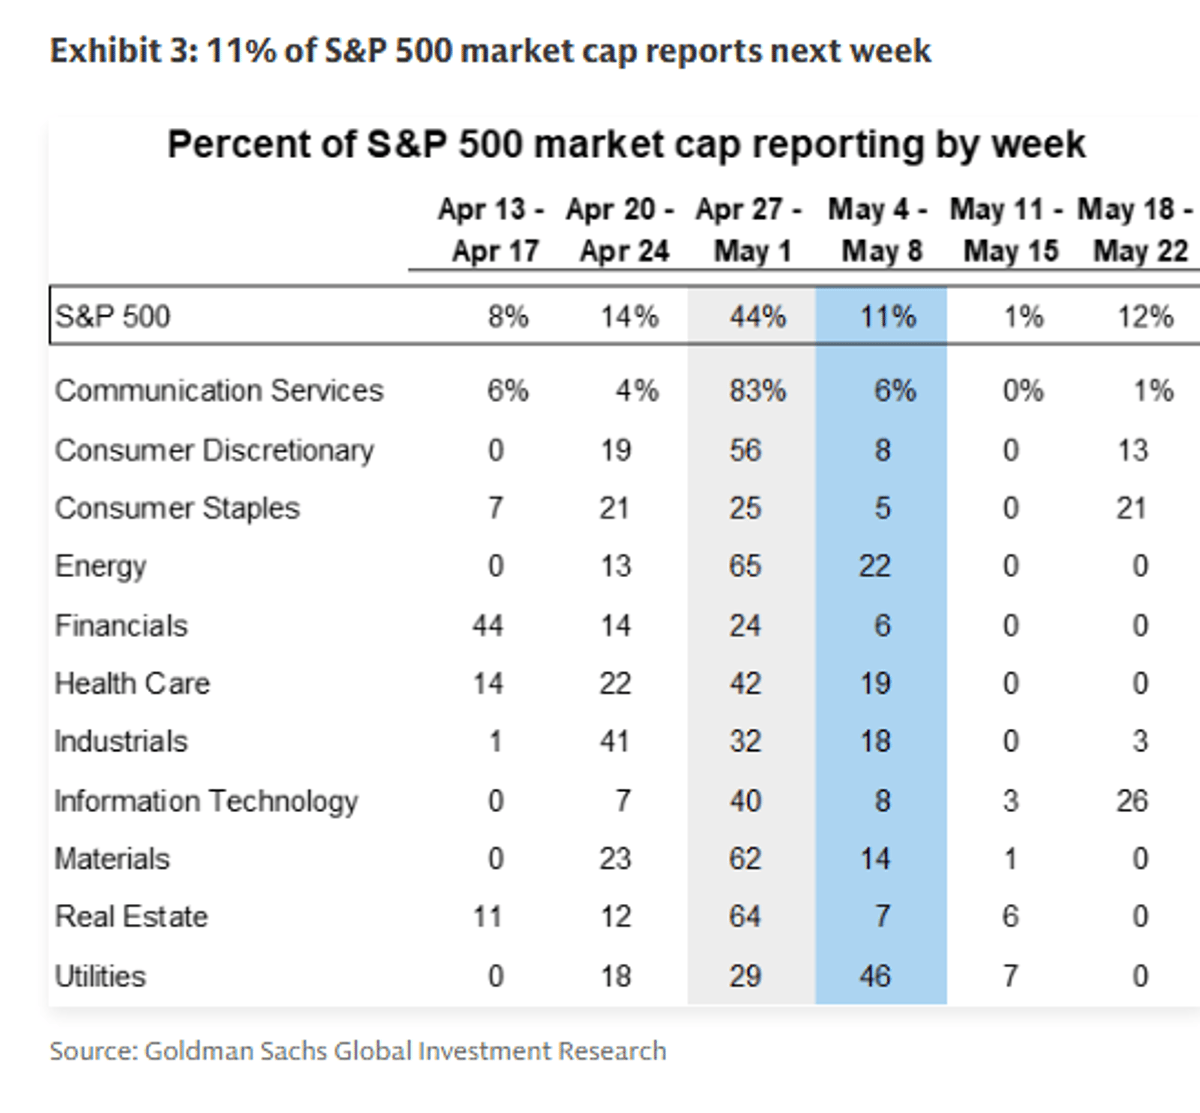
Over Half of S&P 500 Post Q1 Results
GS: With the busiest week of the earnings season behind us, 63% of S&P 500 companies have now reported Q1 2026 results. https://t.co/KNUoyd1Kk6

GameStop Targets $45 Billion eBay Deal, Stocks Surge on M&A Rumor
GameStop (GME) is reportedly preparing an offer to buy eBay, a company valued at about $45 billion—over three times GameStop’s market cap. The news sent eBay shares up roughly 10% and GameStop up 7% in after‑hours trading, igniting speculation about leverage,...
Only a Handful of Stocks Drove This Week’s Market Highs
Hey @grok How many stocks really pushed the NASDAQ and S&P 500 to new highs this week? List the only stocks that were the alpha this week.

Lemonade Stock Plummets 13.8% as Q1 Earnings Miss Profitability Targets
Lemonade Inc. saw its stock tumble 13.8% after reporting a $36 million net loss despite a 32% jump in in‑force premiums and 71% revenue growth. The miss on profitability targets reignited concerns about the insurtech’s path to sustainable earnings.

US Futures Rise as Oil Slides on Iran Cease‑Fire Optimism, Apple Leads Tech Rally
U.S. equity futures edged higher, with the S&P up 0.3% and Apple surging 3.8%, after Iran submitted a response to U.S. cease‑fire amendments, sparking optimism that the Gulf conflict may de‑escalate. At the same time, Brent crude fell about $1...

Roblox Shares Plunge ~20% as Age‑verification Rollout Curtails User Growth
Roblox Corp. saw its shares drop roughly 20% after reporting first‑quarter daily active users that fell short of estimates and announcing a lower full‑year bookings outlook. The company blamed the decline on a newly‑implemented age‑verification system that slowed new user...

Top Economist Gary Shilling Says a Recession and a Deep Stock-Market Plunge Are Likely by Year-End
Top economist Gary Shilling warned that a U.S. recession is almost inevitable this year, citing weakening consumer spending, stagnant capital expenditures, and a frozen housing market. He predicts the S&P 500 could plunge up to 30% by year‑end as inflated valuations...

S&P 500, Nasdaq End at Fresh Records on Tech Earnings Strength
The Nasdaq and S&P 500 closed at fresh all‑time highs on Friday, propelled by robust earnings from technology leaders such as Apple, which rose 3.2% after beating expectations. FactSet data shows S&P 500 companies are on track for 27.1% earnings growth, the...

U.S. Stocks Climb as Apple Beats, Oil Slides and ISM PMI Misses Expectations
U.S. equity indexes closed higher on Friday after Apple posted a surprise earnings beat that lifted the S&P 500, while crude oil prices dropped more than 2% and the ISM Manufacturing PMI fell to 52.7, below forecasts. The divergent moves...

Nasdaq's New Rule Lets IPOs Join Passive Index Funds in 15 Days
Nasdaq implemented a methodology on Friday that permits newly listed companies to be added to major passive index funds after just 15 days, bypassing the traditional one‑year waiting period. The change is aimed at attracting high‑profile tech IPOs such as...
US Equity Futures Rise, Oil Futures Fall on Iran Ceasefire Optimism
U.S. equity futures jumped 0.3% after reports that Iran submitted a response to a U.S. cease‑fire amendment, while oil futures slipped, with Brent down $1 to $110 and WTI to $103. The move pushed the S&P futures toward an all‑time...

Opay Taps Citi, Deutsche Bank, JPMorgan for $4 B US IPO
SoftBank‑backed Opay Digital Services Ltd. has engaged Citigroup, Deutsche Bank and JPMorgan Chase as lead advisers for a planned US initial public offering. The fintech is aiming for a valuation of roughly $4 billion and could sell shares later this year,...

Apple Posts Record Q1 Revenue, Shares Rise 3% on iPhone and MacBook Demand
Apple announced a record $111.2 billion first‑quarter revenue, up 17% year‑over‑year, as iPhone sales surged 22% and MacBook demand lifted Mac revenue 6%. The earnings beat sent the shares up roughly 3% in early trading and reinforced a $100 billion share‑buyback authorization.

Vanguard S&P 500 ETF Narrows Gap with Gold as Market Rally Gains Momentum
Vanguard’s S&P 500 ETF (VOO) posted a 0.97% gain as the equity market rallied, while the SPDR Gold Shares ETF (GLD) rose 1.5%. The move revives the classic equity‑vs‑gold debate, with short‑term equity strength contrasting with gold’s longer‑term outperformance.

Insperity Q1 2026 Earnings Show EPS Drop but EBITDA Gains as Payroll Demand Softens
Insperity (NSP) reported first‑quarter 2026 adjusted earnings per share of $1.31, a 17% decline year‑over‑year, but adjusted EBITDA rose 1% to $103 million. The results reflect a modest margin recovery that offset a 1% drop in average paid worksite employees and...

Nasdaq Surpasses 25,000 Mark on May 1 as U.S. Markets Rally
On May 1, the Nasdaq Composite closed above 25,000 for the first time, rising 0.8% in early trade. The move came alongside a 0.6% gain in the S&P 500 and a 0.4% rise in the Dow Jones, driven by robust earnings from...
Semiconductor Stocks Surge 35% in April as AI Demand Revives
The Nasdaq PHLX Semiconductor Sector Index jumped 35.2% in April, marking the strongest monthly gain in decades. The rally was powered by AI‑related earnings beats at Intel, Nvidia and Apple, and a broader shift in investor sentiment toward AI infrastructure...

S&P 500 Hits 7,209 as AI Earnings Drive Record April Gains
The S&P 500 closed April at a fresh all‑time high of 7,209, the Dow Jones rose 790 points, and the Nasdaq hit record levels, marking the strongest monthly rally since November 2020. The surge was powered by blockbuster earnings from AI‑centric...
IonQ Soars 56.5% on DARPA Deal as D‑Wave Shows Mixed Gains
IonQ's stock leapt 56.5% in April after winning a DARPA research contract, propelling the pure‑play quantum firm toward a $17 billion market value. D‑Wave Quantum posted a 25% gain since the start of the month but stays volatile, with a 10.4%...

10 Stocks With Remarkable Gains
Ten mid‑cap stocks posted double‑digit gains on Friday, outpacing a modestly positive Nasdaq (+0.89%) and S&P 500 (+0.29%) while the Dow slipped. The rally was driven by strong earnings and forward‑looking guidance from companies such as nVent Electric, Newell Brands, Applied...

Hundred-Year-Old Modine Now At Forefront Of AI Megatrend; Leads 18 To Best Stock Screens
The Nasdaq and S&P 500 closed the week at fresh highs, driven in part by AI‑related stocks. Analog Devices (ADI) earned a spot on IBD’s 50‑stock growth screen, while century‑old HVAC firm Modine Manufacturing (MOD) surged 5% to a record $268.51...

Jim Cramer Says the Market Powered Through a Tough Earnings Week but 'that Doesn't Mean We're Out of the Woods...
Jim Cramer said the market breezed through a tough earnings week, driven primarily by AI‑related and data‑center stocks. He praised strong performances from big tech and semiconductor names but warned that next week could be more uneven, with earnings and...

Tech Indexes Soar as Dow Lags Behind
Friday May 1 close. Nasdaq Composite cracked 25,000 for the first time ever. S&P 500 logged its 5th straight weekly record at $720.65. The Dow slipped. Read that again — major indexes hit fresh highs while the Dow was the...
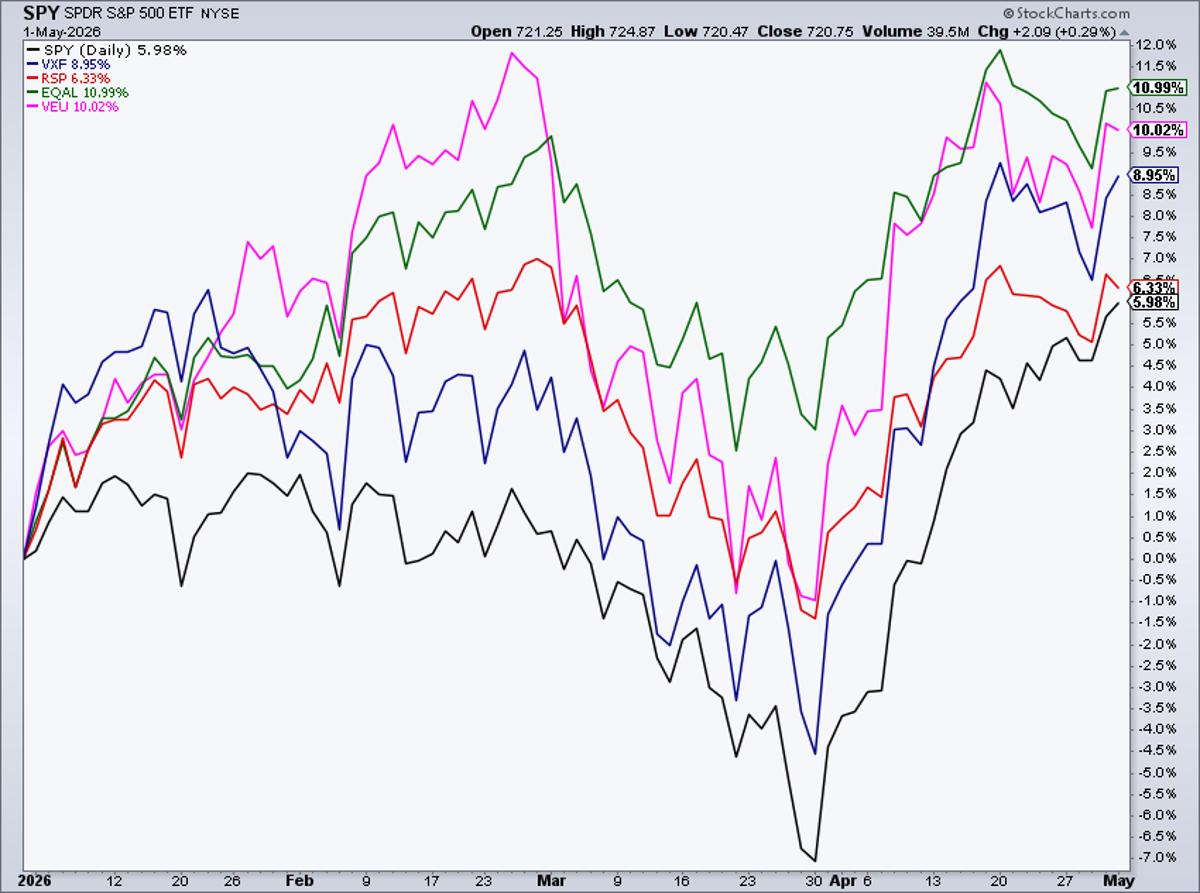
Broad US ETFs Beat S&P 500 This Year
The average US stock ETF $EQAL +11% YTD International stocks $VEU +10% All US stocks ex SPX $VXF +9% S&P 500 EW $RSP +6% S&P 500 $SPY +6% https://t.co/rkwAjVmCtE

S&P 500 Closes at a New Record to Usher in May as Oil Prices Cool and Apple Rises: Live Updates
The S&P 500 closed at a fresh all‑time high of 7,230.12, up 0.29%, while the Nasdaq rose 0.89% and the Dow slipped 0.31%. The rally was buoyed by Apple’s 3.5% jump after beating Q2 earnings expectations and a cooling of oil...

Five‑Week Rally Continues, Yet Hidden Risks Prompt Adjustments
Stocks just closed higher for their fifth consecutive week, but a few warning signs under the surface have my attention. Not bearish, but I did adjust some exposure. Full coverage in this week's video👇 📺 Watch here: https://t.co/PC10356V4z $SPY $QQQ $SMH $XLE $USO...

Dow Drops 153, Nasdaq Climbs 222, S&P 500 Adds 21
U.S. equities mixed Friday as the S&P 500 climbed 0.3% to a fresh all‑time high while the Dow slipped 0.3% and the Nasdaq added 0.9% to a new record. Strong earnings from Apple, Estée Lauder and SanDisk powered the rally,...

The Close: US Stocks Gain for the Sixth Consecutive Week
U.S. equities posted a sixth straight week of gains, marking the longest winning streak since October 2024. The S&P 500 rose 0.3% on the day and 0.9% for the week, while the Nasdaq added 0.9% and 1.1% respectively. The Dow...

War‑Fueled Oil Surge Boosts Exxon, Chevron Profits
Exxon, Chevron Beat Profit Estimates on War-Driven Oil Rally. Americans paying higher gas prices to feed corporate greed? https://t.co/tsjWhL6DSr

THE MOST CONCENTRATED MARKET IN HISTORY: A.I. at 45% of the S&P 500, the $1.4T Debt Trap & Why Gold...
Goldman Sachs data shows AI‑related equities now represent 45% of the S&P 500’s market capitalization, a 20‑point jump since ChatGPT’s launch and surpassing the tech sector’s 35% peak during the dot‑com bubble. Simultaneously, AI‑linked investment‑grade debt has ballooned to $1.4 trillion, accounting...

Meta Shares Plunge Over 10% as AI Capex Outlook Sparks Buying Debate
Meta Platforms Inc. saw its stock tumble up to 10% on Thursday, the steepest decline in six months, after announcing a $125‑$145 billion AI‑focused capital‑expenditure plan. Analysts are split on whether the dip creates a short‑term buying chance or signals deeper...
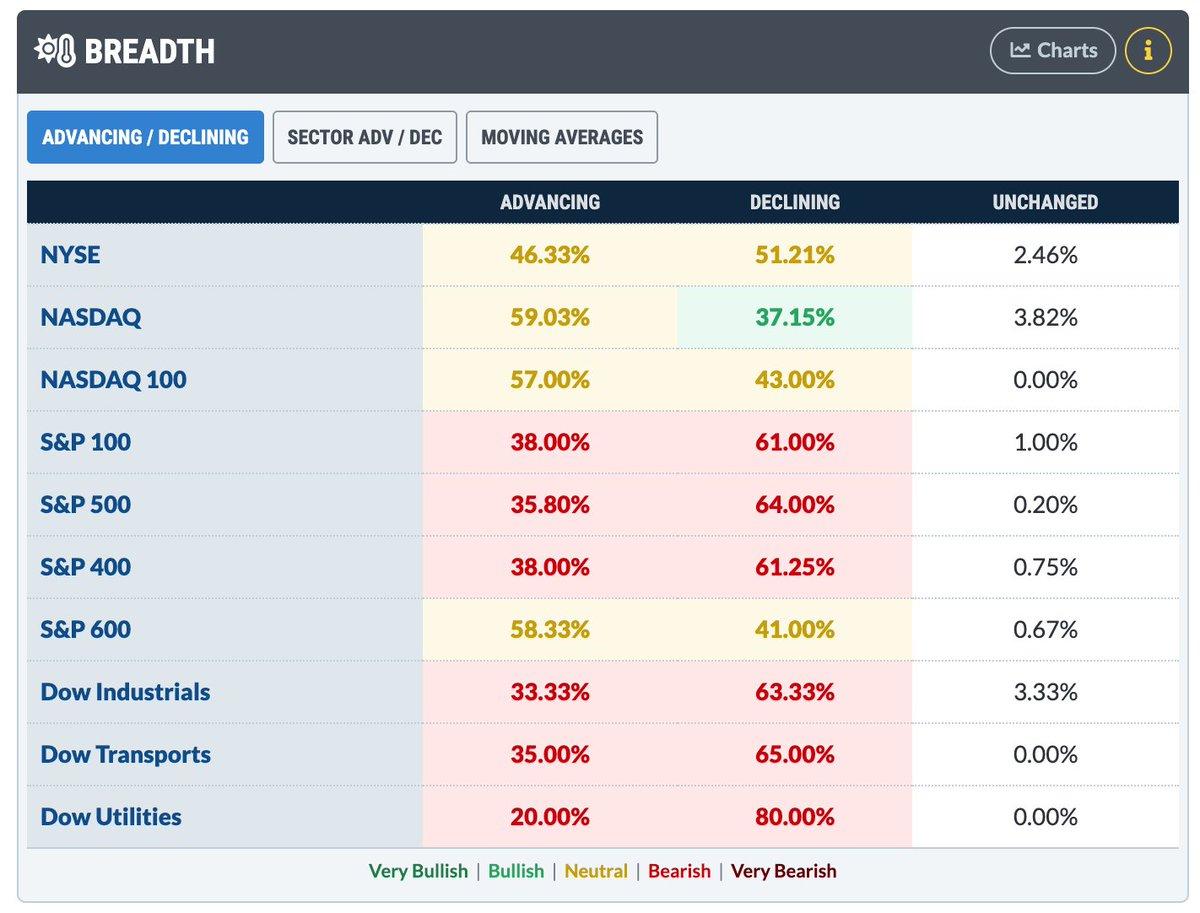
S&P Hits New High with Under 40% Stocks Advancing
The S&P 500 $SPY rallied at least 0.25% to a new high. Not even 40% of its stocks rose on the day. This has happened two other times since 1962. LOL, make of it what you will. https://t.co/2WJkbcn7CA

ProPetro COO Adam Muñoz Tackles Cost Cuts as Q1 Revenue Falls 7%
ProPetro (PUMP) posted first‑quarter 2026 revenue of $271 million, a 7% sequential decline, and a net loss of $4 million. COO Adam Muñoz detailed a multi‑pronged effort to tighten the cost structure, accelerate fleet utilization and fund a $540‑$610 million capital program, especially...

Vanguard Total Stock Market ETF Tops Picks Under $500 Amid Earnings Surge
Analysts recommend Vanguard Total Stock Market ETF (VTI) as the best sub‑$500 ETF, citing 15% Q1 earnings growth for the S&P 500, forward P/E near historical norms, and a 0.03% expense ratio. The pick balances geopolitical headwinds and rising oil...
S&P 500 Hits New High on Apple Earnings: Stock Market Today
Apple’s fiscal Q2 beat expectations, driving the S&P 500 to a fresh 7,230 record and lifting the Nasdaq 0.9% to 25,114. The iPhone segment posted a 22% YoY revenue jump, with China sales up 28%, prompting a 3.3% stock surge and...