Today's American Stocks Pulse

Dow climbs nearly 200 points to record close as oil eases on Iran truce hopes
The Dow Jones Industrial Average jumped about 200 points, closing at a fresh all‑time high. The rally was driven by a pullback in oil prices after optimism surrounding a potential Iran truce. Markets remained cautious amid mixed political signals.

Trump Threatens Iran Over Hormuz, Sparking Immediate Market Volatility
Donald Trump warned Iran that the United States would strike its power plant unless Tehran ends its threats to shut the Strait of Hormuz. Iran replied it could close the waterway indefinitely, sending oil prices higher and igniting sharp moves in U.S. stocks.

QQQ Seeks Pivot Low Amid Red Sea
$qqq lost so many levels while names broke down prior to last weeks move. We’ll see if if in a sea of red some names can go green. Perhaps the $qqq give a pivot low to use in the first...

Magnificent Seven Lose Correlation with S&P 500 Again
🇺🇸 The positive correlation between the “Magnificent Seven” stocks and the S&P 500 index has disappeared again. https://t.co/Aq6mZl2Tcn

Nasdaq Tumbles 2% Amid Rate-Hike Fears: Fear & Greed Index Remains In 'Extreme Fear' Zone
The Nasdaq Composite slid 2% to 21,647 points on Friday, driven by heightened market anxiety. The CNN Money Fear & Greed Index dropped to 14.6, keeping the reading in the “Extreme Fear” zone. Investors are pricing roughly a 50% chance...

SPY Slides, Eyes 644‑645 Support Amid Red Momentum
Mostly red arrows around the World Lots of spots to switch gears as the $spy lost the 8/21/50/100/200 day. $spx futures-42. Simplify today like last week. Does the $spy reclaim $644-$645 area to relieve pressure. Or Do we do...

US Stocks Barely Reflect War Risks, S&P Down 6%
The notion US stocks have yet to price in a dramatic war escalation makes sense. The S&P 500’s down just 6% from the peak. We’ve seen mediocre earnings, eco reports trigger deeper declines than the one we have currently https://t.co/esTq56VbOq

MOVE Index Jumps 28% as Iran Conflict Fuels Bond Volatility, Threatening Stocks
The Bank of America MOVE Index leapt 28% to close at 108.84 on March 20, its highest level since April 2025, as the Iran‑Israel war pushes oil prices higher and stokes bond‑market turbulence. Analysts warn the spike could force the...
Weekly Market Pulse: Questions
The S&P 500 and Nasdaq closed below their 200‑day moving averages, sparking debate over whether the recent pullback signals a new bear market. While the EAFE index outperformed the U.S. last year, it is now lagging as energy‑related geopolitical risks weigh...

Algorithm Signals 94% Chance of Market Bottom
The stock market is very oversold $NDX $SPX SPX-BIGBOT algorithm we monitor (see bottom panel on chart) is flashing 94.4% probability of a large market bottom. On watch for a final flush (capitulation) followed by an intra-day reversal. https://t.co/BrhHwoD6Ls

S&P500 Key Levels
The S&P 500 closed at the lower edge of its multi‑month trading range, prompting debate over whether the move signals a genuine breakdown or a routine shake‑out. Positioning data shows crowded short interest, yet traders remain defensive rather than panicked. Futures...

U.S. Stocks Fall to 6-Month Low Over War and Oil Concerns
U.S. equity benchmarks slipped to six‑month lows as concerns over a protracted Middle East war and rising oil prices intensified. The S&P 500 fell 1.5% and the Nasdaq 100 dropped 1.9%, while the Russell 2000 entered correction territory with a 2% decline. Brent...

Key S&P Level Threatens 2008‑Style Crash
It's good to have eyes wide open...just in case Crash Risk: 2008-Type Waterfall Level Is Here Rising oil, yields & dollar are increasing market stress. VIX has a persistent bid. A key $SPX level could trigger either a bounce OR a sharp "2008-style"...

Tech Forward P/E Near Long‑Term Median Since 1995
S&P 500 Expanded Tech Forward P/E Ratio.. right near its long-term median since 1995 @wisdomtreefunds https://t.co/gRuj8dp3hU
Indicator of the Day (Video): DOW Advances Index
The Indicator of the Day spotlights the Dow Advances Index, a breadth metric that counts how many Dow Jones Industrial Average component stocks close higher each trading session. The chart covering March 2024 to March 2026 reveals a surge in advancing stocks...

Rising Gas Prices Drag Down Discretionary Spending
Energy sector $XLE: +33% YTD Consumer Discretionary sector $XLY: -10% YTD Higher gas prices are expected to reduce discretionary spending. The more you spend at the pump, the less you have to spend elsewhere (travel, restaurants, clothing, etc.). Video: https://t.co/kTI1Olplo7

Defensive Sectors Lag as Risk‑on Stocks Surge
Last week saw the defensive stuff lag (utilities, staples, and healthcare). While financials, industrials, and tech lead. Not exactly what you'd expect to see if this was a pure risk off environment. https://t.co/Fj8UAuTQM0

Will The Middle East Crisis Upend The Bull Market In Stocks?
Equity markets are underestimating the risk of a major energy shock from a potential closure of the Strait of Hormuz, which could choke global oil and LNG supplies. While U.S. economic growth remains solid, driven by fiscal stimulus and a manufacturing...

SPY Breaks 200‑day MA, Signaling Regime Shift
$SPY broke the 200-day moving average. First time since May 2025. That's not a dip. That's a regime change. JPMorgan just cut their year-end target. Next support: 6,000–6,200. The market is telling you exactly what it's pricing. https://t.co/rl7QY5Hj3L

Weekly Outlook
S&P 500, Nasdaq, Dow Forecast for the Week Ahead https://t.co/OcHNiybaDE #SPX500 #Nasdaq #Dow Weekly Charts https://t.co/CFWjG0EJik
S&P 500 Snapshot: Index Falls To 6-Month Low
The S&P 500 closed the week at a six‑month low, slipping 1.9% for a fourth consecutive week in the red. The index is now 6.77% below its all‑time high set on Jan 27 2026. Technical analysis shows SPX trading beneath both its 50‑day...
Earnings Rise, Prices Fall: Energy Costs Lag Impact
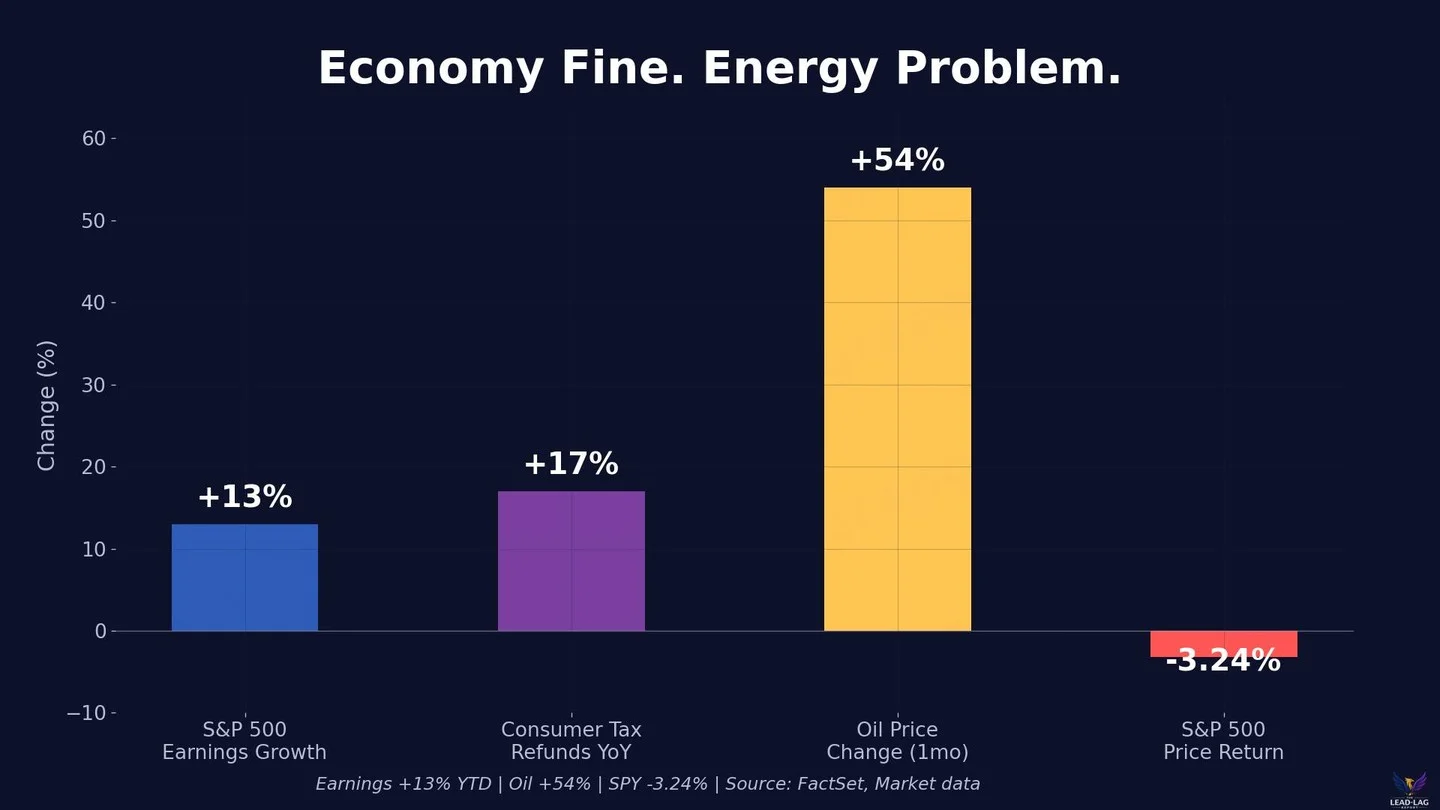
S&P 500 earnings growth: +13% year-to-date. S&P 500 price return: -3.24%. Strong fundamentals. Falling prices. What's actually happening? The economy doesn't have a fundamental problem. It has an energy problem. Oil at $110 is a forward tax on margins and consumption that...
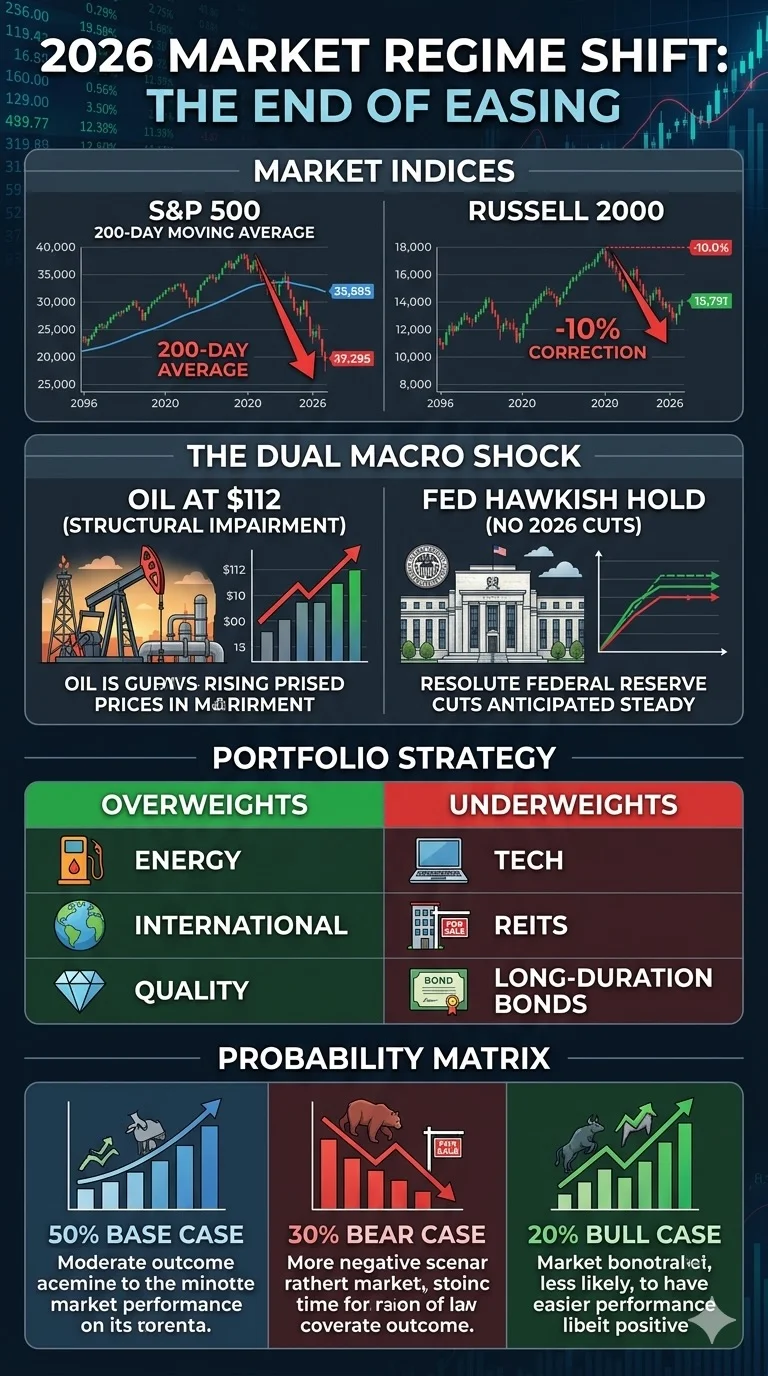
Market Regime Shift: Oil $112, Gold Crash, S&P Below 200‑Day
I just dropped my US Equity Market Weekly Intelligence Report on Substack - Oil at $112. - Gold’s historic crash. - S&P just broke below the 200-day MA. This week just triggered a full market regime shift heading into 2026. Read the full breakdown on...
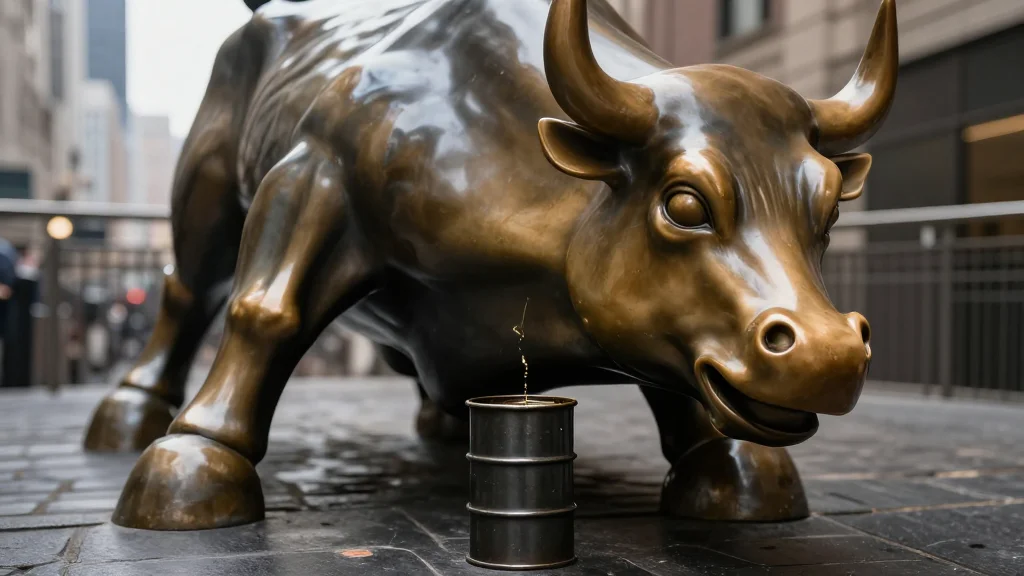
U.S. Stocks Slip as Oil Volatility and Iran Tensions Drag Sentiment
S&P 500 futures slipped 0.4% and Nasdaq futures 0.6% as Brent crude spiked to $111 per barrel before pulling back nearly 2%. The slide follows renewed Iranian attacks on Gulf energy assets and U.S. talk of seizing Iran’s Kharg Island,...
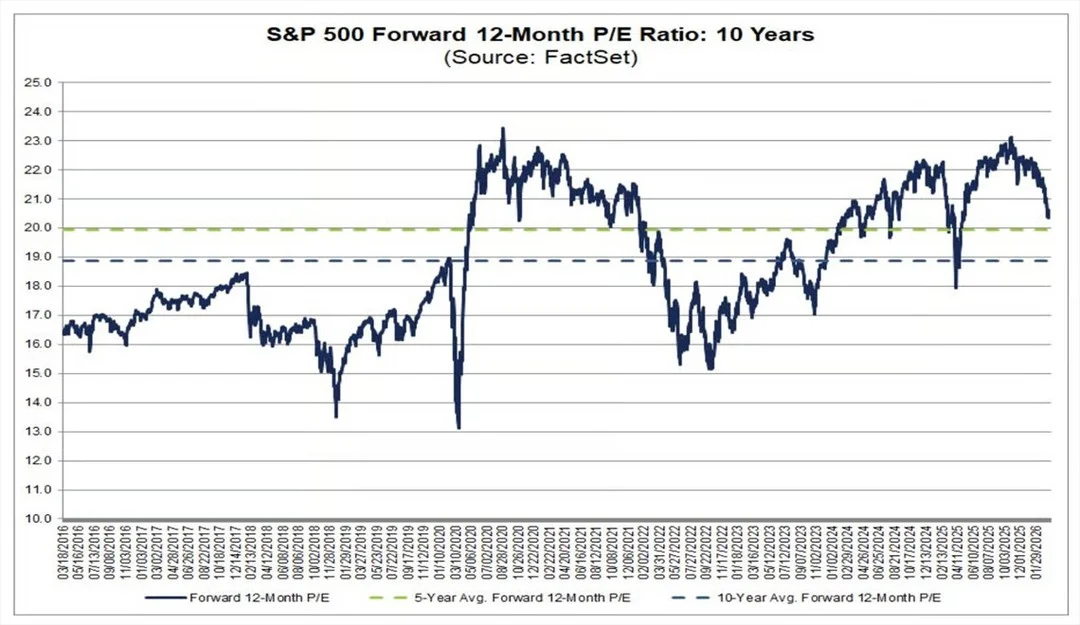
S&P 500 Forward P/E Falls to 20.3
"The forward 12-month P/E ratio for the S&P 500 is 20.3. (down 2.8pts from the high... the market multiple hits correction territory)" -Mike Zaccardi

Four Weeks of Slow Market Bleed Erodes Wealth
$SPY at 6,506. Four straight weeks of declines. Not a crash. Not a correction yet. Just a slow, grinding bleed that feels worse than a crash. The market doesn't need to collapse to destroy wealth. It just needs to stay down long...

Explaining the Resilient S&P 500
The S&P 500 has shown unexpected resilience, slipping only about 7% from its peak despite Brent crude breaching $100 per barrel. Analysts attribute this stability to robust corporate earnings, a sector tilt toward defensive stocks, and continued monetary support. While...

Reduced Longs, Market Rose; Dips Now Look Promising
I kind of knew the market would go lower when we posted that we reduced our longs by 30% when SPX was like 6800 and the next session when it went to 6830 we already had like ten people on...

Chunghwa Telecom (NYSE:CHT) Stock Price Crosses Above 200 Day Moving Average – Here’s Why
Chunghwa Telecom (NYSE:CHT) shares rose above their 200‑day moving average, reaching $42.94 after the average of $42.63. The stock traded at $41.79 with modest volume, while analysts from Zacks and Weiss kept a Hold rating, leaving the consensus unchanged. The...
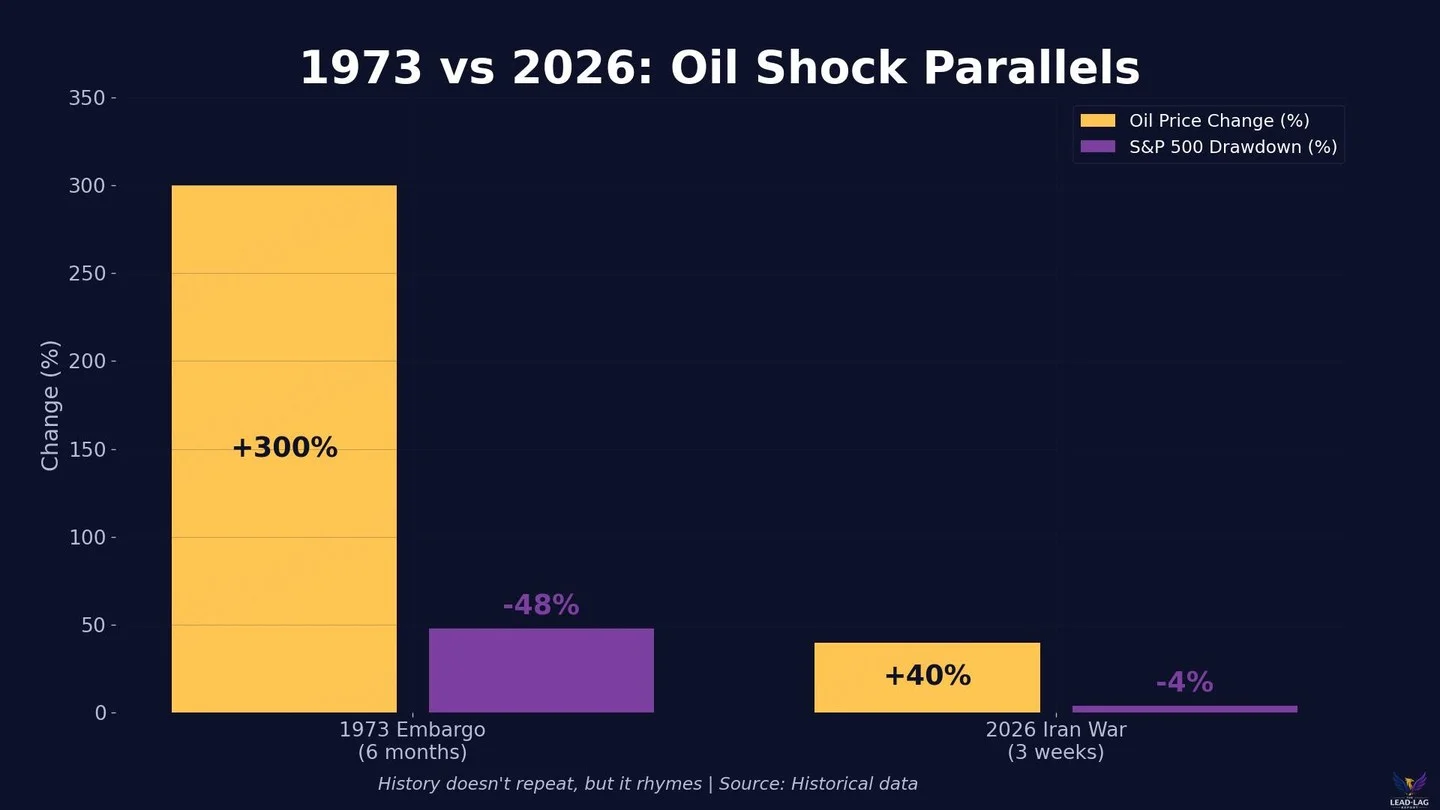
Oil Shocks Trap Fed, Spark Volatility and Equity Losses
The 1973 oil embargo lasted six months and triggered a 48% drawdown in the S&P 500. This conflict is three weeks old. Oil already up 40%. Supply-driven oil shocks create the same policy trap every time. The Fed can't ease because...

US-Iran War Effect: S&P 500 Lost over $1 Trillion Market Cap Last Week, Crashes 5.83% in One Month
The S&P 500 slipped more than 2.5% last week, erasing over $1 trillion in market capitalisation as fears of a US‑Iran war intensified. In the past month the index has fallen 5.83%, wiping out roughly $3 trillion. The benchmark also broke below its...
Markets Lose Buyers as S&P Slides Below 200‑Day
The S&P 500 just closed below its 200-day moving average for the second straight session — lowest since November. Iraq declared force majeure on all foreign-operated oilfields Friday, sending oil back toward $100 and triggering the fourth consecutive losing week...
Economic Landscape Shifting Dramatically Amid Inflation, Rates, and Markets
Current situation: 1. US inflation expectations have surged to 5.2%, 3-year high 2. The Russell 2000 is officially in a technical correction 3. US gas prices have risen nearly +45% in four months 4. Interest rate futures are now pricing-in potential rate HIKES 5. Gold...

Jim Cramer Says to Prepare for Further Stock Declines but Be Open to Opportunities
Jim Cramer warned that the recent market slump is likely to continue as oil prices surge amid escalating Middle‑East tensions. The Dow and Nasdaq slipped into correction territory while the S&P 500 remains down about 7% from recent highs. Cramer highlighted...
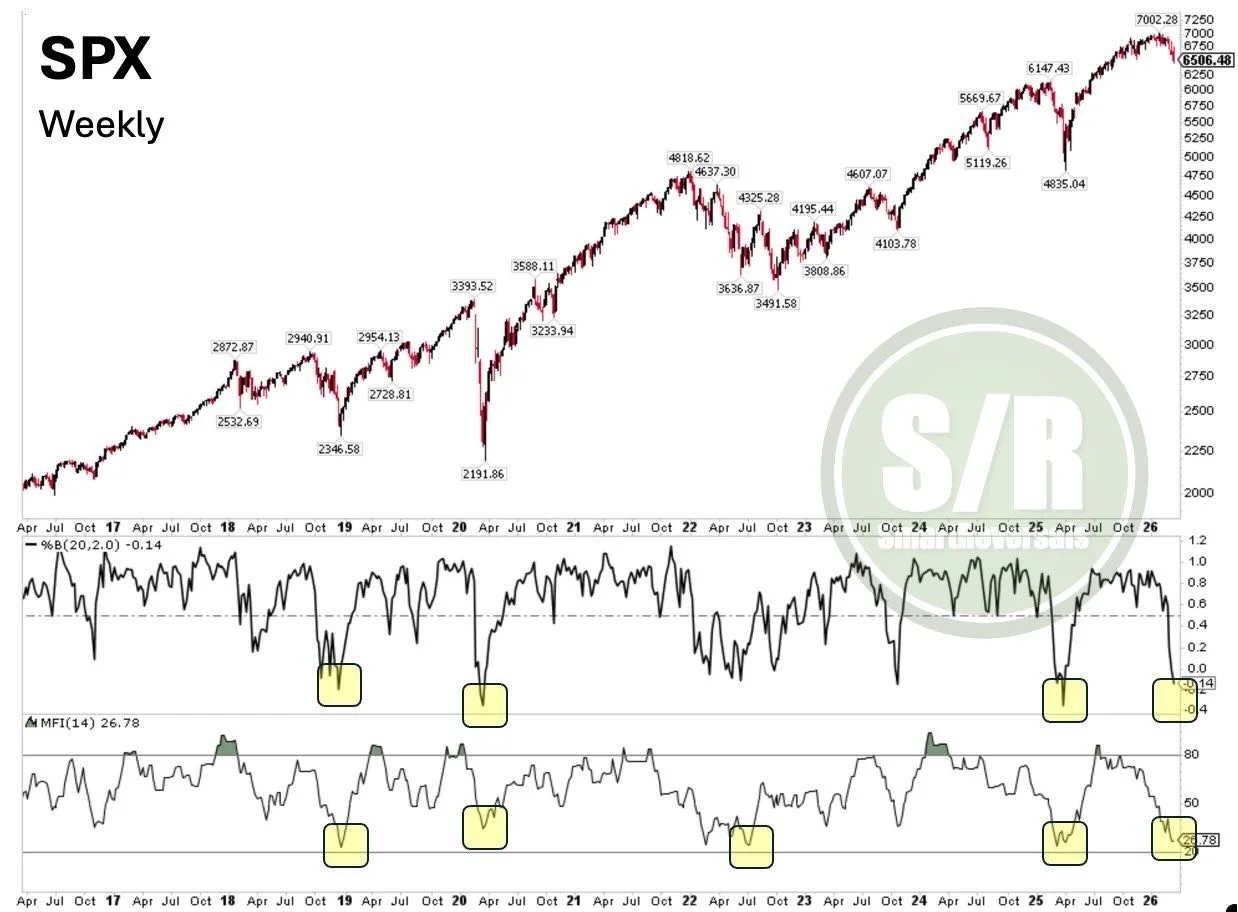
Time‑Based S&P Bottom Near; Money Flow Signals Reversal
#SPX: A bottom is near in terms of Time, not necessarily in terms of Price. Money Flow is nearing the 2018, 2022, and 2025 lows and has already dropped below the 2020 levels. While the %B is also oversold. After...

Heatwave’s Record Area Equals Size of Greenland
It's not just a swath of all-time March record highs... it's the size of greenland https://t.co/oliOqKe7PB

Market Faces Critical Crash Support, Selling Pressure Rises
Selling Into Critical Crash Level Support Poor breadth, rising yields, fragile support levels. Selling pressure builds as crash support zones come into focus. A technical review & why $SPX $6508 & $QQQ $578 matter. https://t.co/clgEWxEHum

S&P 500's Top Ten Dominate
GS: Concentration of S&P 500 market cap and earnings in the 10 largest index constituents... jaws are clamping down a bit https://t.co/UX5qVWlYho

S&P 500 and June E‑Mini Breach Key Support, Risk Downside
Both S&P500 and S&P June E-Mini Futures looked to have violated levels that could lead to additional downside. https://t.co/lo2FDEAZl2

Bear Pressure Builds, Yet Market Still Holds Firm
Technical damage and bear sentiment is piling up. But we still haven't seen the kind of washout or capitulation that usually marks a cleaner turning point. We discuss what we're looking for in this week's video. 📺Watch: https://t.co/ieSqgIPzbx $SPY...

Chart Not Yet Bearish, Trend Still Unclear
This is hardly the chart one could look at and say: "Wow, we are really in a bear trend" It may become a bear trend -- but it is NOT there yet $NQ_F

Oversold NDX/QQQ Bounce Signals Potential Reversal
$NDX $QQQ remains in a DOWNTREND Our portfolio hedge triggered in early February (when price closed < red line). Yesterday, $NDX $QQQ bounced off November low. The market is very oversold and any good news will likely...

Trump's Iran Move Could Lift November Market Lows
The stock market reaches its November low and President Trump considers ending the Iran conflict. Hopefully this war will end soon, enough lives lost already. Any good news and the stock market will be off to the races. $NDX $SPX...

Small‑cap Stocks Outpace Mega‑cap Tech Amid Oil Shock
$IWM is up 0.12% YTD while $QQQ is down 3.16%. Small caps quietly outperforming mega-cap tech during an oil shock. Nobody's talking about it. That's exactly why it matters. https://t.co/uJRKl9XT9N

All Markets Plunge, Crypto Crashes Below All‑Time Highs
% Below All-Time High ExxonMobil: 0% S&P 500: -7% Google: -14% Apple: -14% Nvidia: -19% Gold: -20% Amazon: -21% Meta: -25% Tesla: -26% Palantir: -28% Microsoft: -31% Bitcoin: -44% Silver: -45% Ethereum: -57% MicroStrategy: -75% Fartcoin: -92% Trump Coin: -96% Melania Coin: -99%

Economy Strong, Energy Crisis Holds Back Growth
S&P 500 earnings growing +13%. Tax refunds running 17% higher YoY. Oil up 40% since the war started. The economy is fine. Energy is the problem. And the Fed can't drill its way out of this. https://t.co/q0FLlog6k2

SPX Downtrend Likely Extends to August Low
$SPX - Time wise we're still in the timeframe for an 80 trading day low, but in my opinion the weekly close below the 200 day MA and breakdown of the November low has invalidated this cycle. The downtrend is...

Tech Giants Face 20‑57% Pullbacks From 52‑Week Peaks
Current Mag 7+ drawdowns from 52wk highs... $NVDA -19% $GOOGL -14% $MSFT -31% $AAPL -14% $AMZN -21% $META -25% $TSLA -26% $AVGO -25% $ORCL -57% $NFLX -32% $AMD -25% $PLTR -27% @finviz_com https://t.co/5XhlWNrFKR

S&P Below 200‑Day MA Signals Historically Negative Returns
After 214 trading days, the S&P 500 closed beneath it's 200-day MA this week. Since 1950, when the S&P 500 closes above this trendline the annualized return is 21.1%. When it closes beneath? -22.2%. Proving once again that bad things tend to...

Broad After-Hours Rally Lifts Major ETFs
After-hours: $SPY +1.0% $QQQ +0.9% $RSP +0.9% $IWM +1.7% $EFA +1.3% $EEM +1.8% $TLT +0.5% $IBIT +1.0% @finviz_com https://t.co/H1dLfRam9i

S&P up 35% From April Low; ETFs Post Strong Gains
The S&P 500 remains +35% from its April low... the Gain from 52wk low heat map... In the last year: $SPY +16.4% $QQQ +22.1% $RSP +11.0% $IWM +19.4% $VEU +20.6% https://t.co/tSe8pBORDA