Today's American Stocks Pulse

Dow climbs nearly 200 points to record close as oil eases on Iran truce hopes
The Dow Jones Industrial Average jumped about 200 points, closing at a fresh all‑time high. The rally was driven by a pullback in oil prices after optimism surrounding a potential Iran truce. Markets remained cautious amid mixed political signals.

TMTB EOD Wrap
The QQQ index climbed 1.1% as investors cheered President Trump’s remarks about an international naval coalition that could reopen the Strait of Hormuz, sending oil prices down 5% and trimming Treasury yields by 3‑5 basis points. Nvidia’s GPU Technology Conference delivered a modest message, with Jensen Huang reaffirming strong AI demand and projecting a $1 trillion‑plus market valuation for the company through 2025‑27. Street Data Center reported $968 billion in revenue, while the broader buyside valuation now exceeds $1 trillion. Nvidia also indicated it will scale both optical and copper interconnect technologies.
Fed Meeting’s Dot Plot Will Steer Markets This Summer
The Fed starts its most consequential meeting of the year today. Oil is above $100. The S&P 500 clings to its 200-day moving average. Wednesday's dot plot will reveal whether any rate cuts survive in 2026. The answer could set...

SPY Turns Constructive, Hits Target Above 200‑MA
$SPY getting a bit more constructive this week Sentiment washed out a bit Hit my 660 target nicely and basing type price-action above a rising 200-MA as NYMO hit extreme oversold Warned of the bearish RSI divergence into highs earlier this year, that...

Your Hedges Are Bleeding
The piece highlights a widening gap between realized equity volatility and the higher implied volatility priced into options, suggesting market complacency. It warns that clearing existing puts and VIX call positions ahead of the upcoming FOMC meeting and QOPEX could...

Traders Bet Fed Dovish; Stocks Rise, Dollar Falls
🚨 TRADERS JUST TIPPED THEIR HAND BEFORE FED The market is already telling us what to expect from the Fed - and smart traders are paying attention. Stocks are rallying and the dollar is pulling back ahead of Wednesday's Fed decision. That's...

Nvidia's AI Boom Keeps Stock Range‑Bound; Avoid MU Earnings Risks
📺 RANGE COMPRESSION IN $NVDA, EARNINGS RISK IN $MU $NVDA raised its AI outlook to roughly $1 trillion in demand/revenue visibility through 2027, effectively doubling prior expectations and reinforcing the long-term AI bull case. Despite that, Nvidia is still range-bound and struggling...

LABJ Stock Index: March 16
A $10 jump in oil prices, driven by geopolitical risk, has jolted global equities but left U.S. stocks surprisingly resilient. The United States, now a net oil exporter with most imports from Canada and Mexico, experiences a lagged impact on...
TraderTVLIVE Returns; Nvidia Keynote Triggers Sell‑off, Oil Drags Market
After a little bit of a scare, @traderTVLIVE will be back on Youtube at 8am ready to Air. The $NVDA GTC keynote turned into sell the news while oil prices threaten to continue to give the market the blues....

Market Misprices Fed Cuts Amid Strong Data
PCE at 2.9%. Oil above $100. Fed rate at 3.50-3.75%. Goldman just pushed the first cut to September. The market is pricing in cuts that aren't coming. That's mispricing, not hope. $TLT https://t.co/xYBdA2JDGM

The Market Brief
US equity futures nudged higher on Monday, led by Meta’s rally after the company disclosed sweeping AI‑driven workforce cuts. Meanwhile, crude oil lingered near the $100‑a‑barrel mark as Strait of Hormuz shipments remained disrupted, keeping risk appetite muted. Elevated energy...

Oversold Market Signals Nearing S&P 200
Historically oversold market based on the McClellan Oscillator, right as the S&P 500 hits the upward sloping 200-day MA. https://t.co/TqybXrzkXG

Key Indices Breach 5‑SMA, Then Resume Steep Declines
Rus, SP, Naz and DOW: All got look above 5 SMA, but could not hold. SP, Rus and DOW remain on extended runs DOWN. https://t.co/3ZBu6MNk9F
Stock Market Today: Dow Jumps, Brent Crude Pulls Back From $105
U.S. equities rallied on Tuesday, with the Dow Jones Industrial Average climbing 388 points (0.8%) and all 11 S&P 500 sectors posting gains, lifting the broader index 1% and the Nasdaq 1.2%. Oil markets softened as Brent crude slipped back to...

SPX Stabilizes; Watch for Looming Big Short
SPX $6630 hit Friday target & we bounced on cue into a 'stabilizing week' ahead of VIX expiration, MU earnings, FOMC, BOJ & month end OpEx. Even chasing $CAVA, swing long $JD & trend long $AA from live trading room. But be...
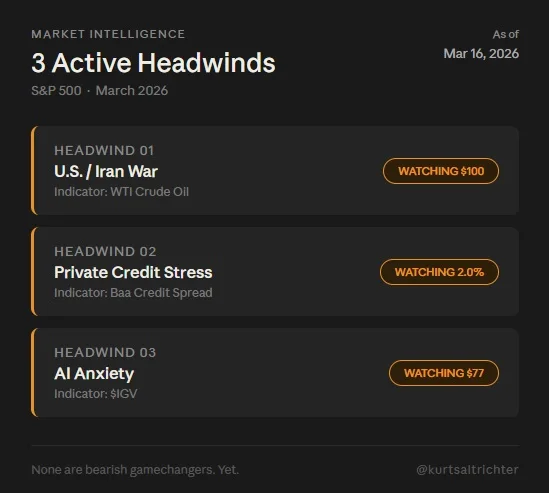
Three S&P 500 Headwinds, One Overlooked Indicator Each
The S&P 500 has 3 headwinds right now. Most investors are only watching one. Here's what all 3 are, and the single indicator for each that tells you if it's getting better or worse 🧵

What’s News in Markets: Campbell’s Snack Problem, Centene Sinks, Petco Optimism
The episode reviews how volatile oil prices, driven by escalating tensions in the Strait of Hormuz and a massive strategic reserve release, pushed major U.S. indexes lower despite a brief inflation lull. Campbell Soup’s disappointing snack sales and Centene’s Medicaid...

S&P 500 Finds Support, Holds Range After Rally
S&P 500 advance/decline line pulling back to trendline support. S&P 500 index still trading in a big ol' range the past few months, as it works off the historic 40% rally after Liberation Day. Yes, the headlines are really bad, but...
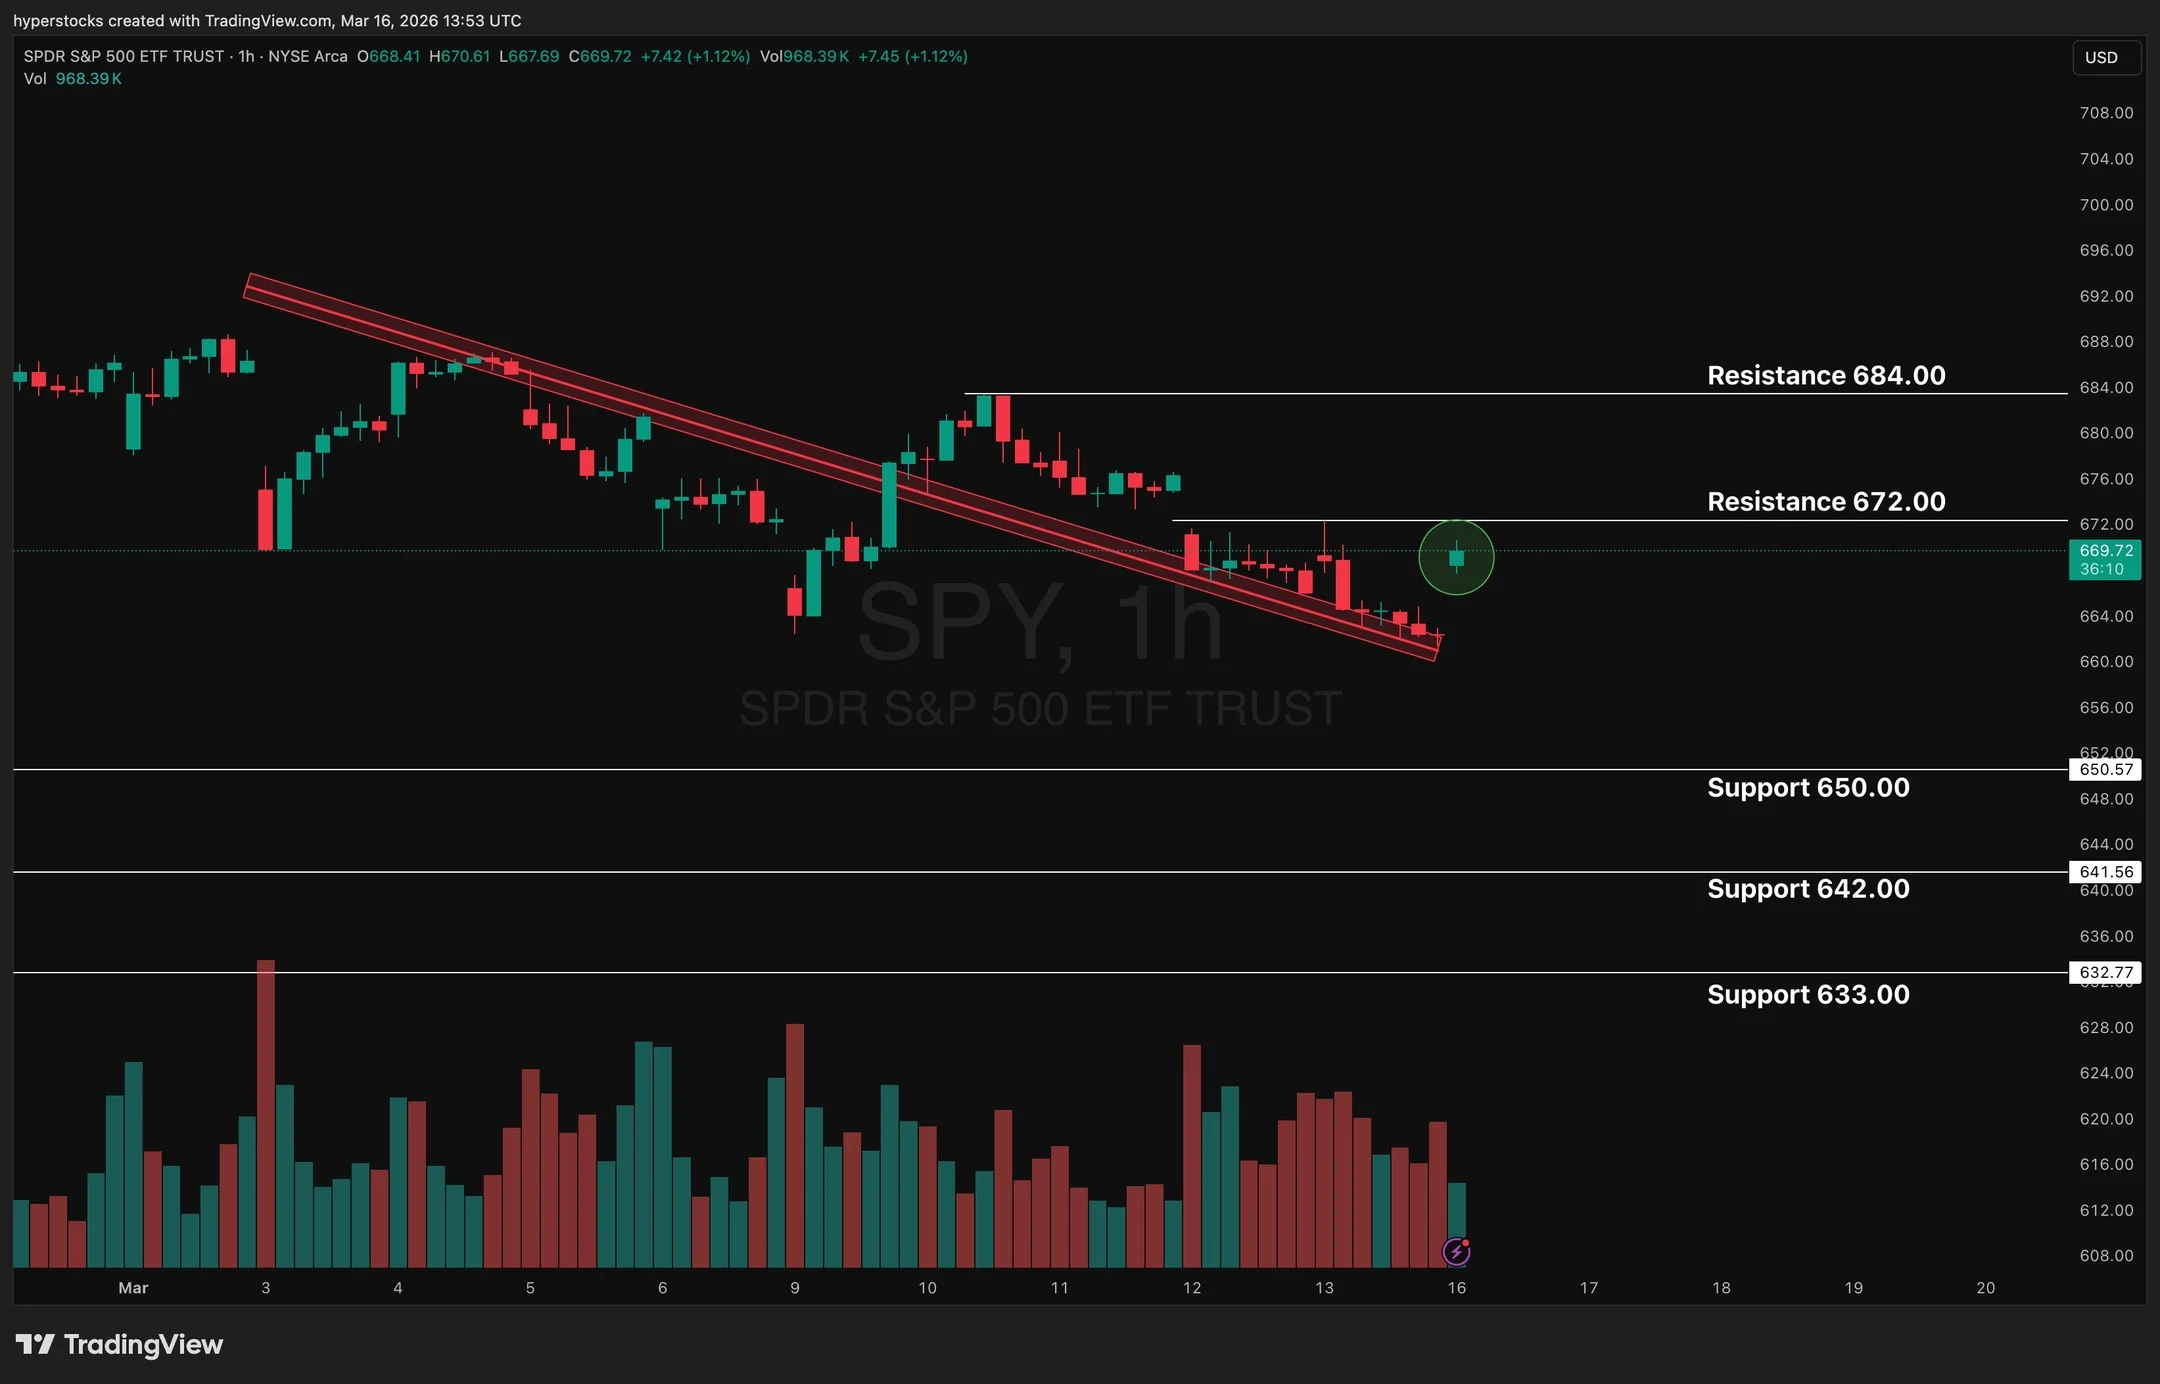
SPY Preps for Inflation Data and Fed Decision
$SPY levels going into the week. On the agenda: - CPI & PPI Inflation Data (Wed) - FOMC / Interest Rate Decision (Wed) - Fed Press Conference (Wed)
Wall Street Drops, Set for Weekly Loss as War on Iran Fuels Inflation Worries
Wall Street closed lower on Friday, with the Dow, S&P 500 and Nasdaq all in the red, putting the week on a negative trajectory. The decline was driven by heightened tensions in the war on Iran, which pushed crude oil above...

Avoid Shorting Open; Market Still Above Bottom
📺 DON’T RUSH TO SHORT TODAY’S MARKET OPEN — BUT THIS ISN’T THE MARKET BOTTOM YET Many traders expected a sharp selloff after Friday’s weak close to start this week. Instead, the market points to opening stronger, creating a situation where...

Oversold Markets Signal Rebound Amid Bearish Technicals
Learnings and conclusions from this week’s charts: 1. Technically things look fairly bearish overall. 2. But recent history shows the tendency for rebounds (even during bear markets). 3. And conditions are currently looking notably oversold. 4. Yet there are some vulnerabilities being exposed in...
Is Stagflation Creeping Into the Picture?
In this episode of Motley Fool Money, hosts Travis Hoyam, Jason Moser, and Lou Whiteman dissect the risk of stagflation in 2026, highlighting the recent dip in Q4 GDP growth to 0.7% and persistent inflation above 3%. They explore how...

NVDA Beats Forecasts, Stock Barely Reacts, Investors Confident
The fact that Jensen guided CY27 revenue about 7% ahead of the Street, yet the stock only moved about 1% higher on the news, speaks to investors' willingness to believe. $NVDA
Gas Hits 2023 High, Stocks Surge Anyway
Gas prices reach highest level since October 2023 as oil holds above $100 per barrel; US stocks jump https://t.co/voUmM6Kcb0

Stocks at 3-Month Lows Awaiting PCE, Job Openings
The Schwab Market Update highlighted that U.S. equities slipped to three‑month lows ahead of key economic data, notably the January PCE price index and the JOLTS report, which will shape expectations for the Fed’s upcoming meeting. Rising crude oil prices,...

S&P's 3‑Week Drop Smallest Since 2019
S&P 500 down the past 3 weeks in a row, but down 'only' 4.01%. This is the smallest 3 week decline since October '19 (N=15). Pretty incredible if all you looked at was the headlines. https://t.co/Tzkqd8oLsv

Small Caps Crack First; Large Caps Soon Follow
$IWM down 9% from highs. $SPY down 5%. 400 basis points of divergence. Small caps always crack first. The question is whether large caps follow. History says yes. https://t.co/sp96ah5BoF

BDCs Lag While S&P Holds Near January Peak
The last 2 times BDCs were in a bear market (2020 & 2022), the S&P 500 was in one as well. Interesting divergence today with the S&P 500 down only 5% off its January high... Video: https://t.co/P29a0c5vMR

Energy Surges While Financials Tumble YTD
Top 3 S&P 500 Sectors YTD... 1) Energy: +29% 2) Utilities: +10% 3) Staples: +9% Bottom 3 S&P 500 Sectors YTD... 1) Financials: -11% 2) Consumer Discretionary: -7% 3) Tech: -5% Video: https://t.co/P29a0c5vMR

Vanna‑driven Rally May Thrust SPX Into the 6,800s.
It *could* be a big week for a vanna driven rally into the 6,800s. Note here how VIX spread to SPX movement (RV) often contracts around VIX exp, which is this Wed. We've unlocked the AM Founder's Note to explain our...

SPY Faces Resistance Near 665, Eyes 669‑671 Range
$spy daily chart as $SPX futures look+27 after the oscillator went out -52. $spy has small resistance $665ish much bigger $669-$671. Fridays pivot low $662ish https://t.co/EdvepYd8dv
SPX Slides Below 3‑Month Range Amid FOMC, Iran Tensions
SPX has broken solidly below its 3-month range. This next week brings expiration dynamics and FOMC, with the backdrop of geopolitical risk from the Iran conflict. Where could this market be headed? View our weekly analysis at: https://t.co/f2As6iRdoD

S&P 500 Logs 32nd 5% Pullback Since 2009
The S&P 500 is down 5.4% from its Jan 28 peak, the 32nd pullback >5% since the March 2009 low. Video: https://t.co/P29a0c5vMR

Magnificent Seven All Down, Lagging S&P 500
All 7 members of the Magnificent Seven are down on the year and underperforming the S&P 500. Video: https://t.co/P29a0c5vMR

Equities Near Bottom, Expect Weakness Then Reversal
Positioning suggests equities likely near a bottom... Weakness early next week followed by a reversal? Chart @SubuTrade https://t.co/u7fpaG36eG
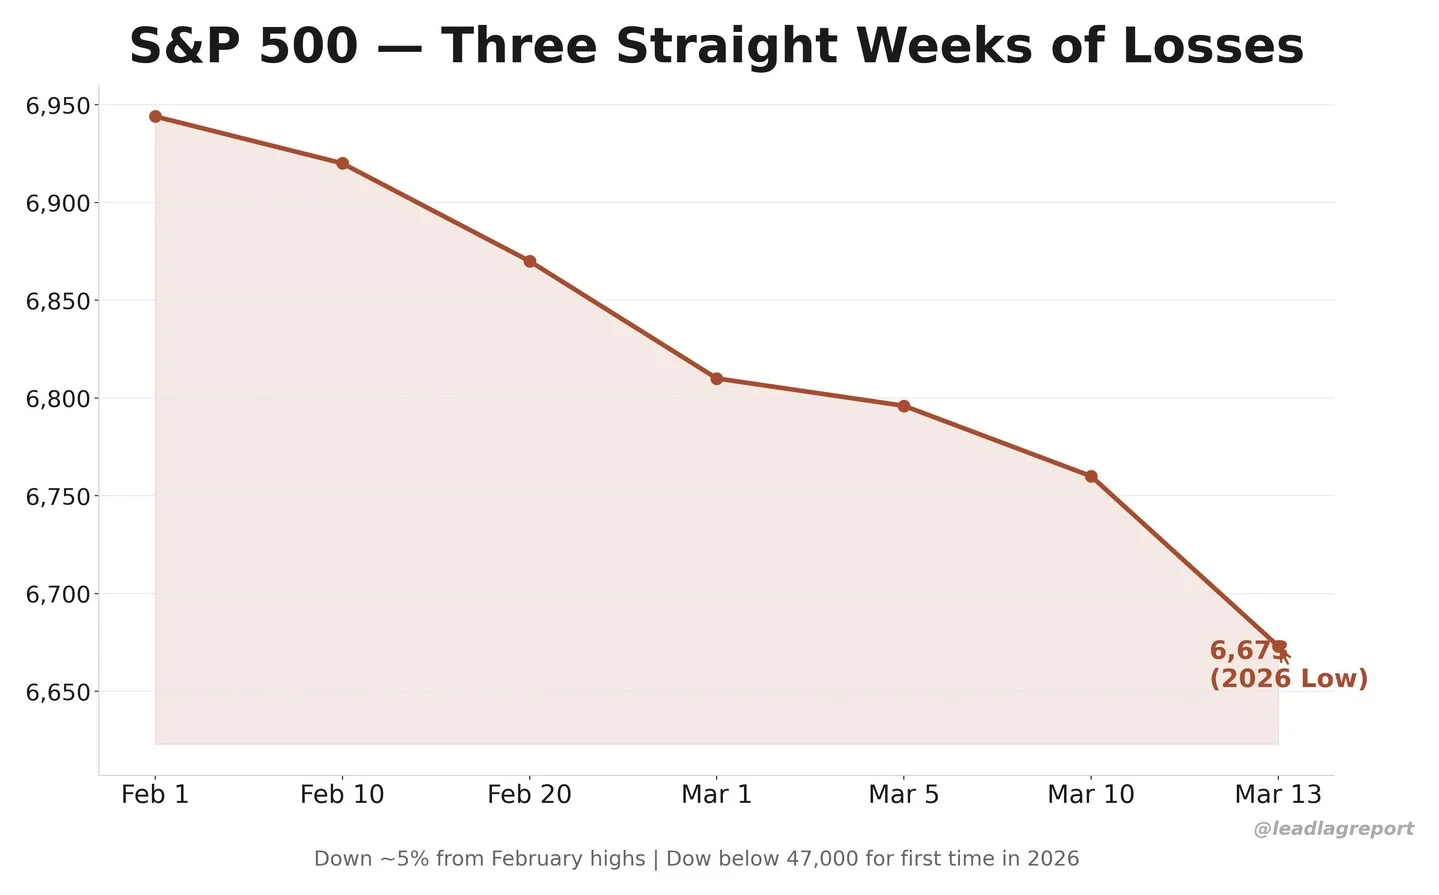
Market's Slow Grind Tests Patience, Not a Crash
Dow below 47K. S&P at 2026 lows. Three straight weekly losses. What concerns me isn't the level — it's the character. This isn't a crash. It's a slow grind lower that constantly tempts you to buy too early. The 2008 decline took...

Berkshire Hathaway Resumes Buyback, Purchases $226M of Shares
Berkshire Hathaway bought back the equivalent of 309 $BRK.A shares (~$226 million worth), on March 4th, the day it resumed it stock buyback program for the first time since May 2024 - CNBC
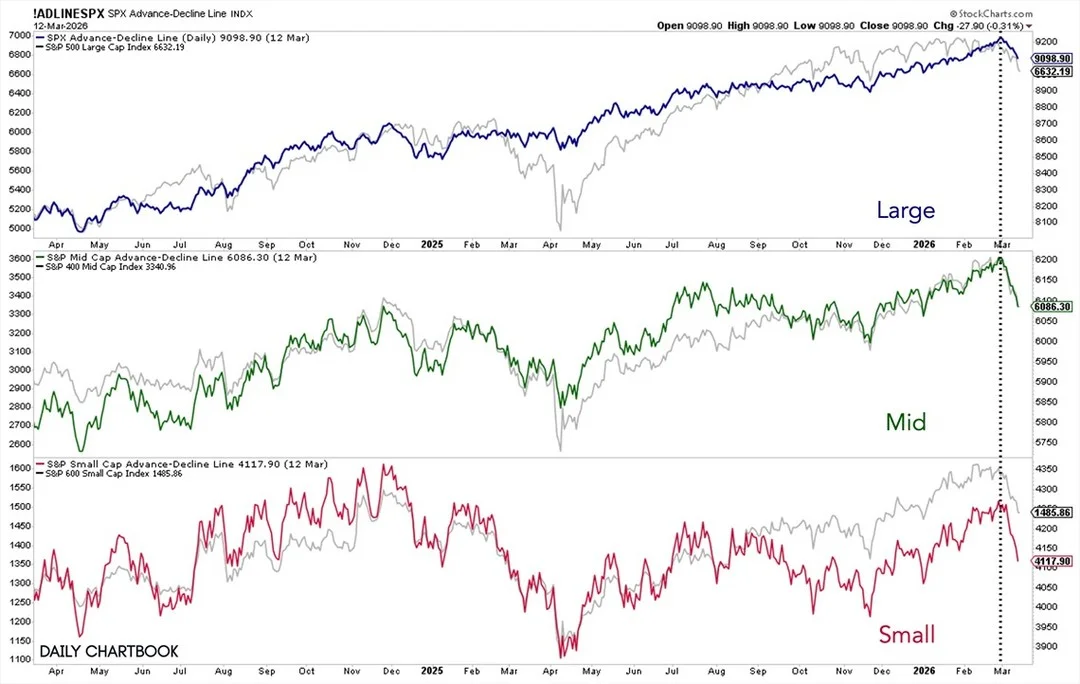
US‑Iran Conflict Slashes Market Breadth Across All Caps
Since the start of the US-Iran war, breadth has deteriorated sharply across large, mid, and small caps.

Oil Shocks Lift Risk Premiums, Weaken Markets, Curb Inflation
Risk premium rising across equities and credit while intraday correlation between oil and equities around -80%. Oil shocks push the tide out and expose underlying weak links. The peak in oil in June 2022 explained the first low in markets...

Markets Grind Lower; Dip‑buyers Run Out of Bargains
Dow below 47K. S&P at 2026 lows. Three straight weeks of losses. The "buy the dip" crowd is running out of dips to buy. This is what repricing looks like. Slow. Grinding. Relentless. $DIA https://t.co/n4HR4uNcCX

Risk‑Off Signals Rise, Yet Core Market Levels Hold
Today felt like a textbook risk-off session. Weak GDP revision. VIX back above 20. Short-term breadth rolling over. Dollar up. Rates pushing toward 4.3%. Oil surging. In CHART THIS I walk through what’s actually changing — and what isn’t. Six viewer questions. Clear levels. No drama. Watch...
Q4 GDP Halved, Inflation Rises: Stagflation Hits Markets
The number Wall Street was dreading arrived today. Q4 GDP was revised down to 0.7% — literally half the initial reading — while core PCE inflation climbed to 3.1%, its highest since early 2024. The S&P 500 responded by hitting...
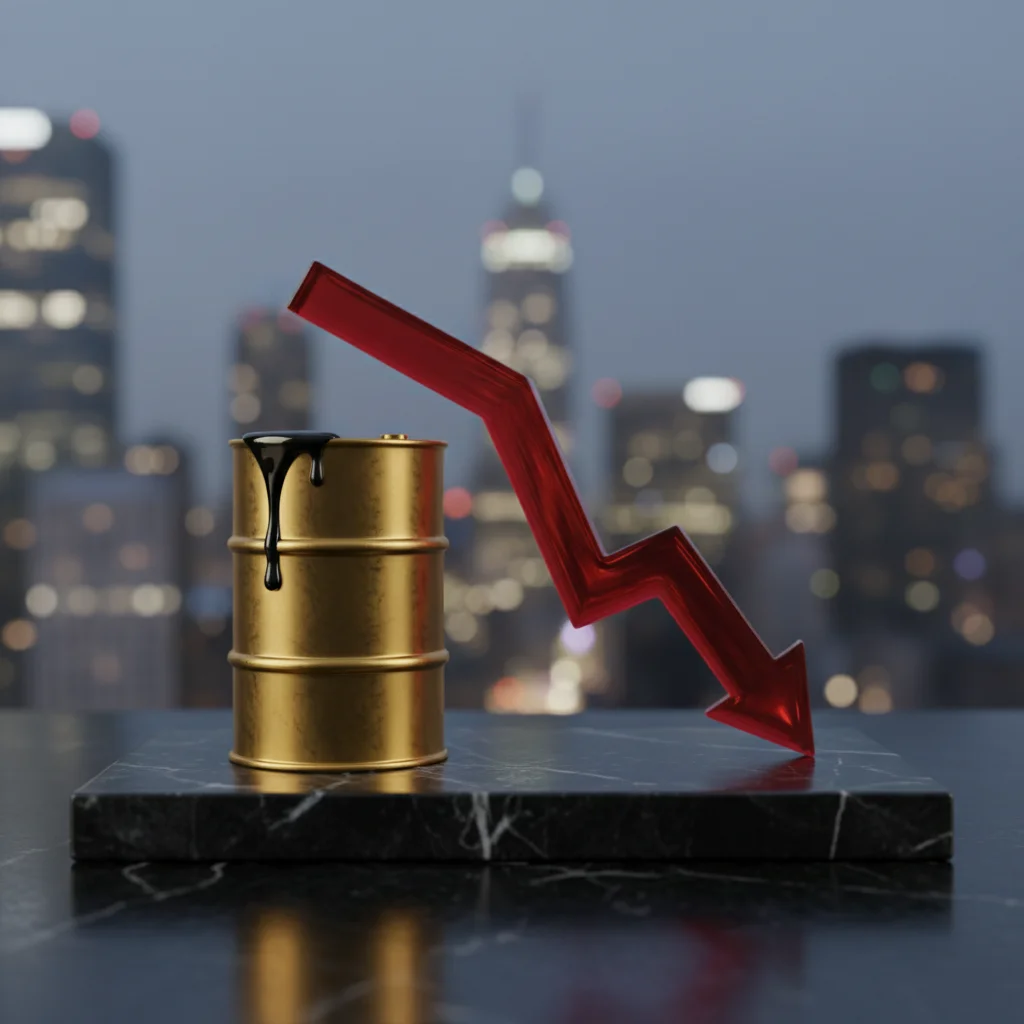
Oil Spike Meets Credit Freeze, Market Stressed
Two different crises hit the market on the same day Thursday. Brent crude closed above $100 for the first time since August 2022. And four of Wall Street's biggest fund managers — Morgan Stanley, BlackRock, Blackstone, and Blue Owl —...

Oil Prices Dictate Yields and SPX Until $
Oil = 10yr = -SPX 1 variable market continued for another week and will likely persist until oil drops back below ~$70 when the Strait is back in business. https://t.co/349BroE6sP

Markets Enter Regime Change, Not Crash, Amid Slow Repricing
$SPY at 2026 lows. Dow below 47K. The "buy the dip" crowd has gone very quiet. This is what a regime change looks like. Not a crash. Just a slow, grinding repricing of risk. https://t.co/p01B1V5aNG

Energy Surge Splits Market as SPY Hits 2026 Lows
Energy stocks at all-time highs. $SPY at 2026 lows. Chevron, Marathon, Valero ripping. Everything else bleeding. This is not a market. It's two separate markets wearing one coat. https://t.co/yJjS0g4dAU

SPX's VIX Sensitivity Drops to Unsettling Low
Beta of SPX to 1pt chg in the VIX has fallen to uncomfortable levels. Opposite in many ways to Volmaggedon where VIX was at depressed levels, but SPX showing almost no response to implied vol changes. https://t.co/zaPe03rueo

Rising Oil, Yields, Dollar Boost Crash Risk Ahead of OpEx
Market Crash Risk Odds Have Increased $SPX $VIX #crudeoil #10Y #USD All eyes on rising oil, yields & dollar... for increased pressure on equities... before or after OpEx is the big question... https://t.co/fgfY8OJ2nm

S&P Rebounds From Low, Eyes 6740 Resistance Amid Hawkish Fed
$SPX hit a 6636 low Monday and bounced to 6670, and now we’ll see if early strength holds or fades with 6740ish as resistance. #FOMC is the next move as the Fed turned more hawkish with inflation and higher...
Markets Stay Resilient Despite Global Turmoil and Rising Yields
War in Iran Oil up nearly 70% YTD Software stocks crashed Private credit imploding Legit chance of no cuts this year Inflation set to surge Yields globally moving higher S&P 500 down only 2.5% this year