Obesity Drug News Sinks Wave, Lifts Kodiak
Wave crashes on obesity drug update; Kodiak’s reboot pays dividends https://t.co/20H9OXVtIB $WVE - 54% $KOD + 58%

Mega‑Cap Weakness Pulls Index Below Long‑Term Range
Last week the Mag 7 broke below its well-defined trading range, which had been in place since last October. As I have often written, in a concentrated market, as go the mega caps, so goes the index. That is now...
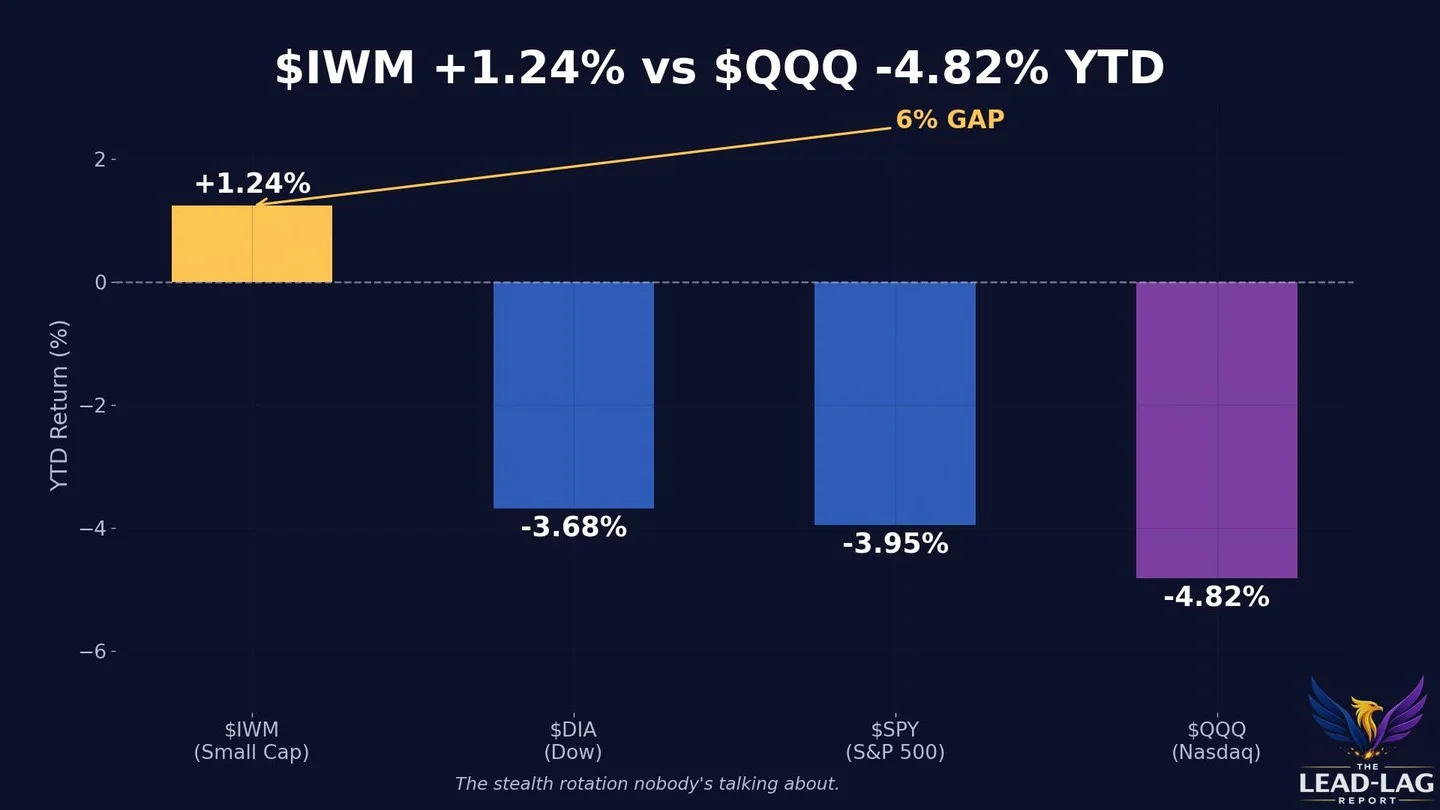
Small‑cap Russell 2000 Outpaces Nasdaq—Real Rotation
Everyone is watching the Nasdaq. Nobody is watching small caps. The Russell 2000 is up over 1% year-to-date. The Nasdaq 100 is down nearly 5%. That's a 6-point gap — and it's barely being discussed. Small caps don't outperform like this by...

Iran-Driven Reversals Signal Growing Pressure in Tight Range
We’re now on the fourth or fifth Iran-driven market reversal this week. Mon: rally on ceasefire talk Tue: selloff after denial Wed: rally on U.S. peace plan Thu: selloff as Iran pushed back Hard to keep up, but put simply, pressure is building inside a...

Lam Research AI Gains Face Potential Head‑Shoulder Decline
$LRCX Daily. Lam Research another AI memory winner in recent quarters, like $MU $SNDK. But latest rally sets up possible bearish head & shoulders, like $SMH ETF https://t.co/VzMDwhwfpM

Earnings Growth Offsets Falling P/E, Signals Healthy Market
If that reset continues, we could get a 2022 “echo,” in which equities correct entirely on the basis of falling P/E’s, while earnings continue to grow. Remember that stock prices are driven not only by earnings and payouts but also...

Broad Indices Fall, Small‑cap ETFs Defy the Trend
$SPX down 4% YTD, $CCMP down 6%, yet $RSP flat, $IWM up 2%. $RLV > $RLG by 11%. Alot going on under the surface in markets.

Markets Shift From Rate Cuts to Tightening Regime
Six months ago: markets pricing 3+ rate cuts. Now: pricing 8bps of TIGHTENING. The Fed didn't pivot. The Fed reversed. 37% chance of ZERO cuts in 2026. This isn't a soft landing. This is a regime change. $SPY $TLT $QQQ https://t.co/UxC4Gdd51F

Join Me Live on Trader TV at 8:30 ET
I'm joining Trader TV Live at 8:30 am ET: https://t.co/dG0wAzdrdi Tune in! Will be talking $SPY $QQQ $GLD $SLV $NVDA $SNDK $MU etc.
SPX Volatility Appears Unusually Bid This Morning
SPX vols look quite oddly bid this morning? @NoelSmith lemme know if I'm just being dumb (please)
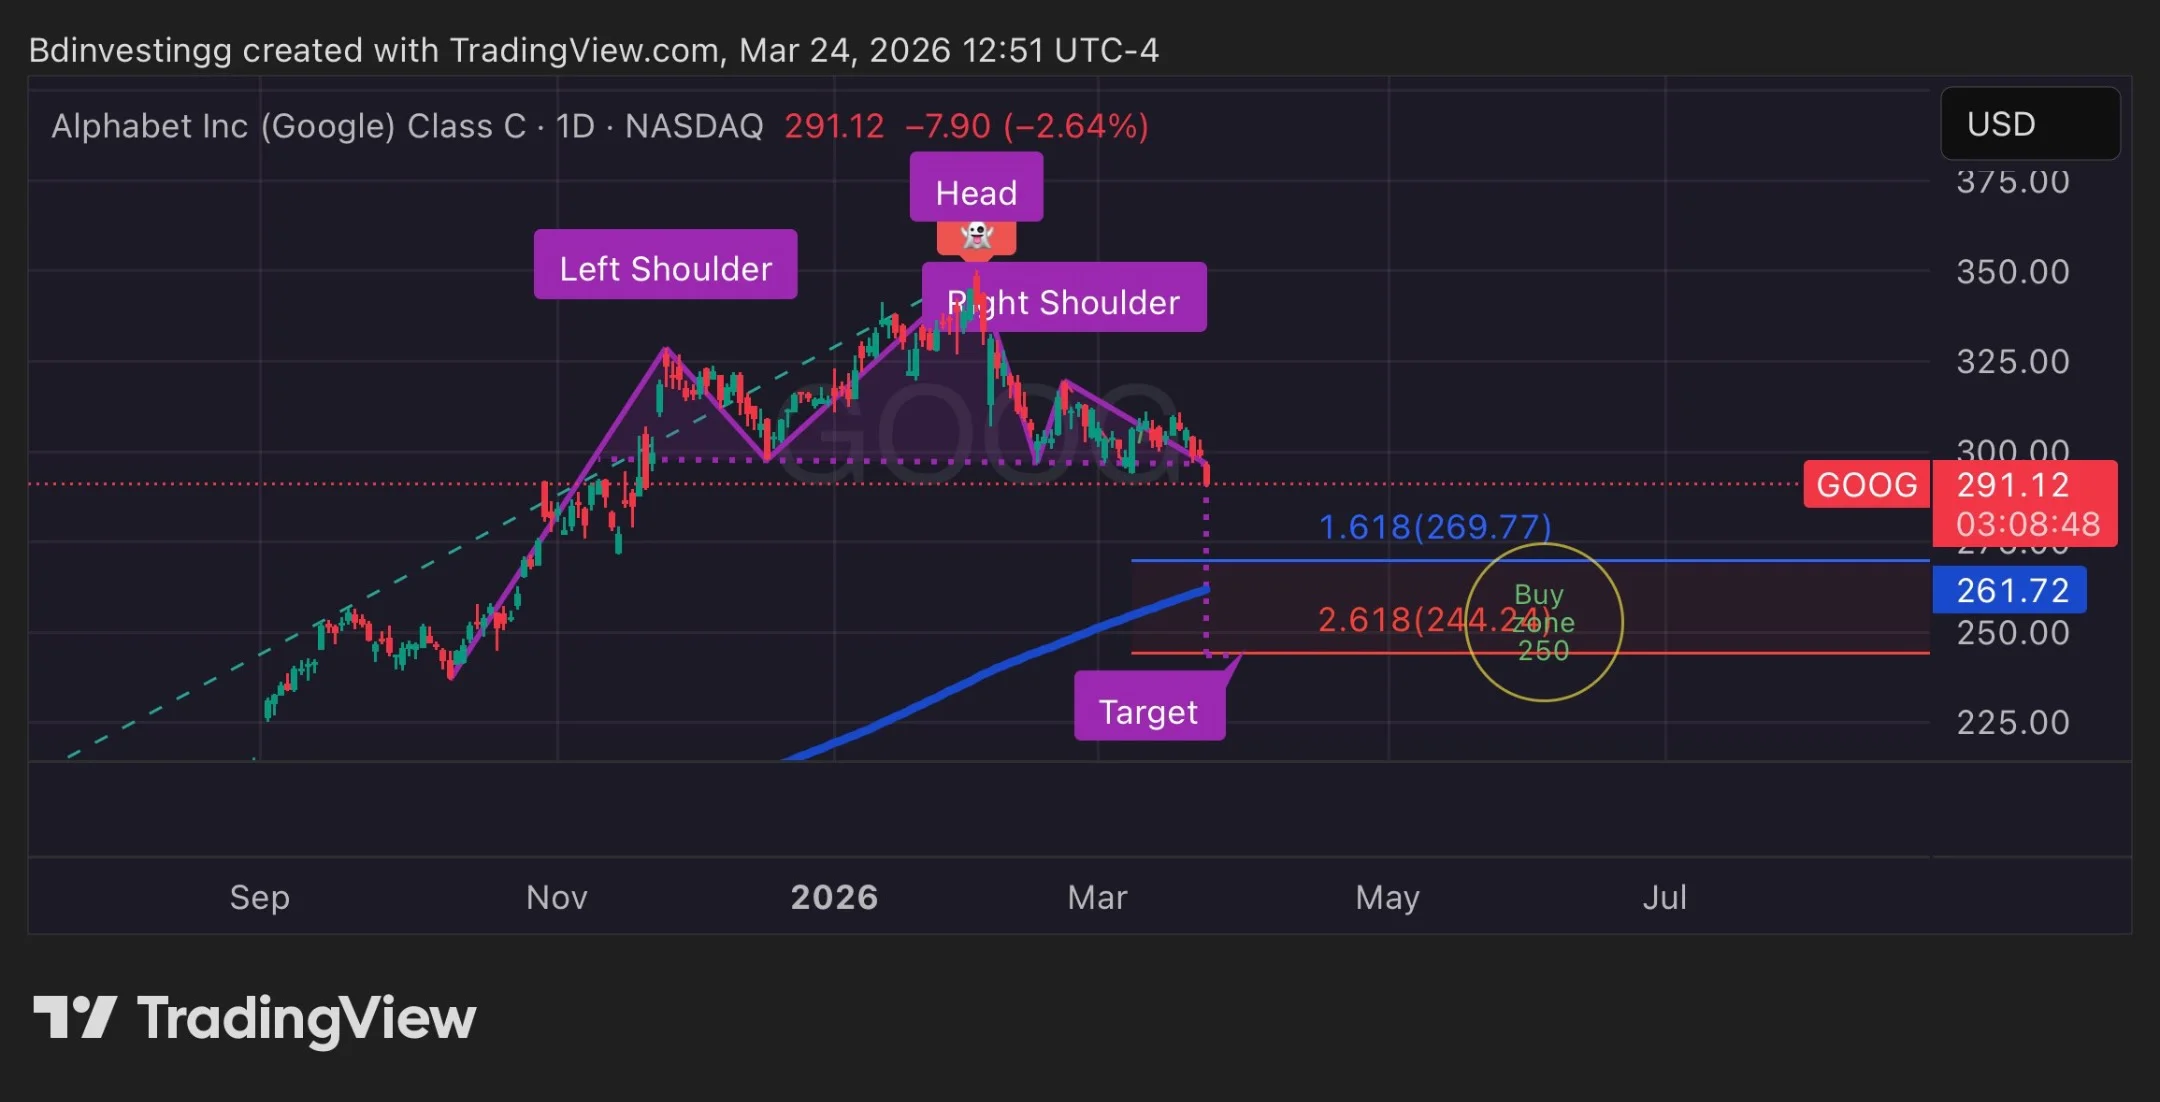
GOOG Breaks 4‑month Pattern, Signals Market Dip
$GOOG bringing this up again just broke a 4-month head & shoulders with rising volume — bearish signal. It’s ~6–8% of S&P 500 Index / QQQ , so bearish for the market Targets: $270 short-term, $250 key

Fed Speakers Set to Drive Market Tone Today
🚨 Morning Market Rundown – March 26, 2026 🚨 Quiet data day but Fed speakers take center stage — markets watching for tone shifts as rate expectations remain in focus 👀 🗓️ Economic Events: 0830 - Initial Jobless Claims: Exp. 210K; Prev. 205K 1600...

Consumer Staples Still Lagging After 16-Year Peak
many told me they were excited with consumer staples stocks while i reminded them it was an $XLP vs. $SPX bounce in a downtrend, as they've underperformed since the peak 16 years ago... it looks like that now, as they've...
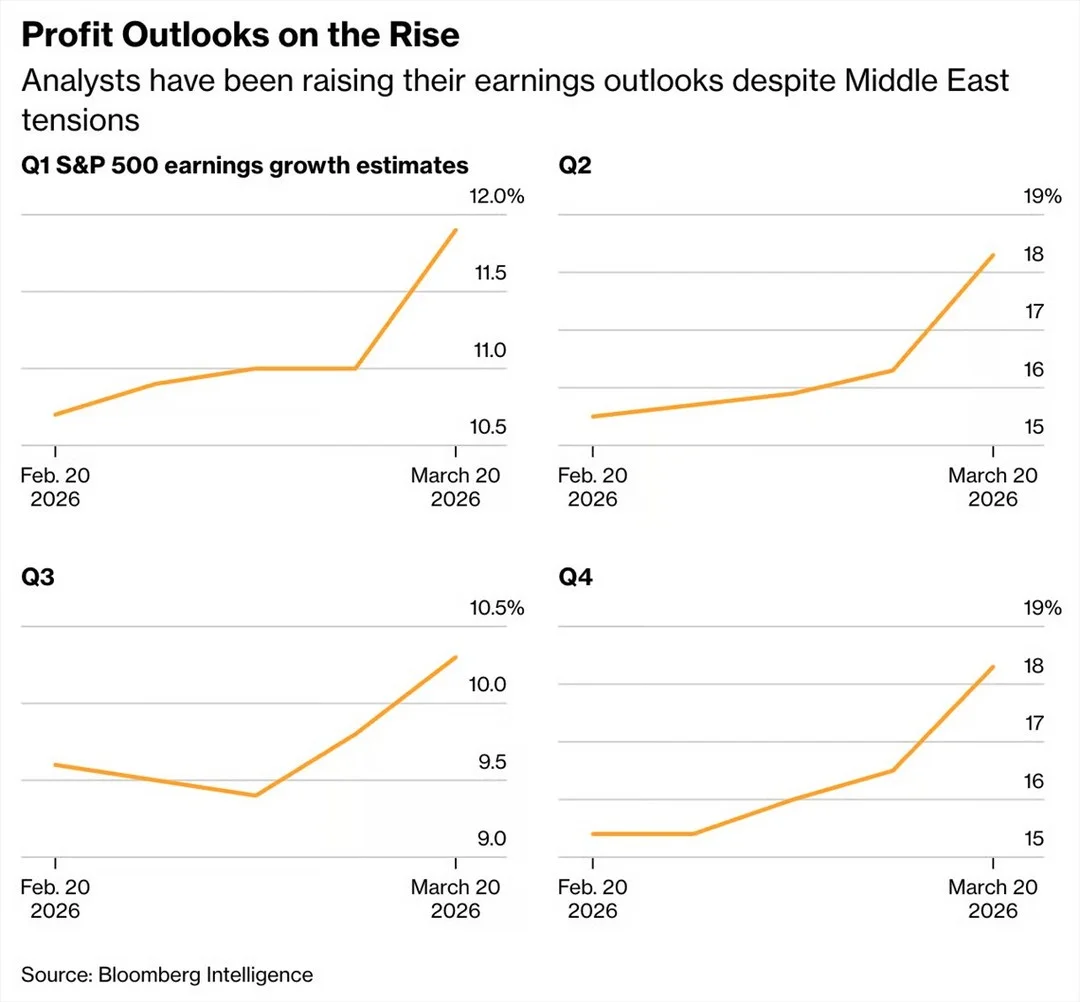
Profits Rise While S&P Prices Drop: Look Past Pain
"The profit outlook for S&P 500 companies has been improving even as share prices have fallen - a dynamic rarely seen during episodes of geopolitical uncertainty ... The setup has historically rewarded investors willing to look through near-term pain." -Bloomberg

SPX Sell‑off Mirrors Post‑war Bottoms, Reversal Looms
The current $SPX sell-off similar to prior post war declines. Historically, the stock market has bottomed around now both in terms of time and % decline. One final flush to capitulation and reversal? Chart DB https://t.co/tR2zluZcbC

Current S&P Dip Is Normal, Not Bearish
The S&P 500 is 5.9% from its 52-week high. The median S&P 500 stock drawdown is 16.6%. And that's very normal. Don't let anyone tell you it's somehow bearish or indicative of extra risk in the market. https://t.co/E1RyD8z4LQ

S&P Slumps While Broader Markets Gain 3% YTD
The S&P 500 is -3.4% YTD But everything else is up... US SMIDs, ex-US.. +2.5% to +3.7% https://t.co/8nTZBWpDKU

S&P 500 Forward EPS Hits Record $332, SMIDs Surge
S&P 500 forward EPS a record high of $332 SMIDs also yodeling higher over the last six months @yardeni https://t.co/BfA01cKlKd

Market Still Bearish; Bottom Uncertain Without Strong Volume
The market's character is still one of a bear market or cyclical correction; strong open, fade into close and major average living below the 200-day line. Before a reliable bottom can be established, we need to see better price and...

Tech‑heavy Indices Slump to Multi‑
Checking in on the previous years' preferred risk asset concentrations. The Mag 7 relative to the broader tech-oriented Nasdaq 100 is at a 9-month low. Nasdaq 100 relative to the Dow has bounced but still well off Oct records. SPX to...

New StockChartsTV Video Breaks Down $SPX Trends
Check out the latest video I recorded for @StockChartsTV @StockCharts yesterday. All about $SPX. This thumbnail also marks one of the last times I put on a tie. 😎
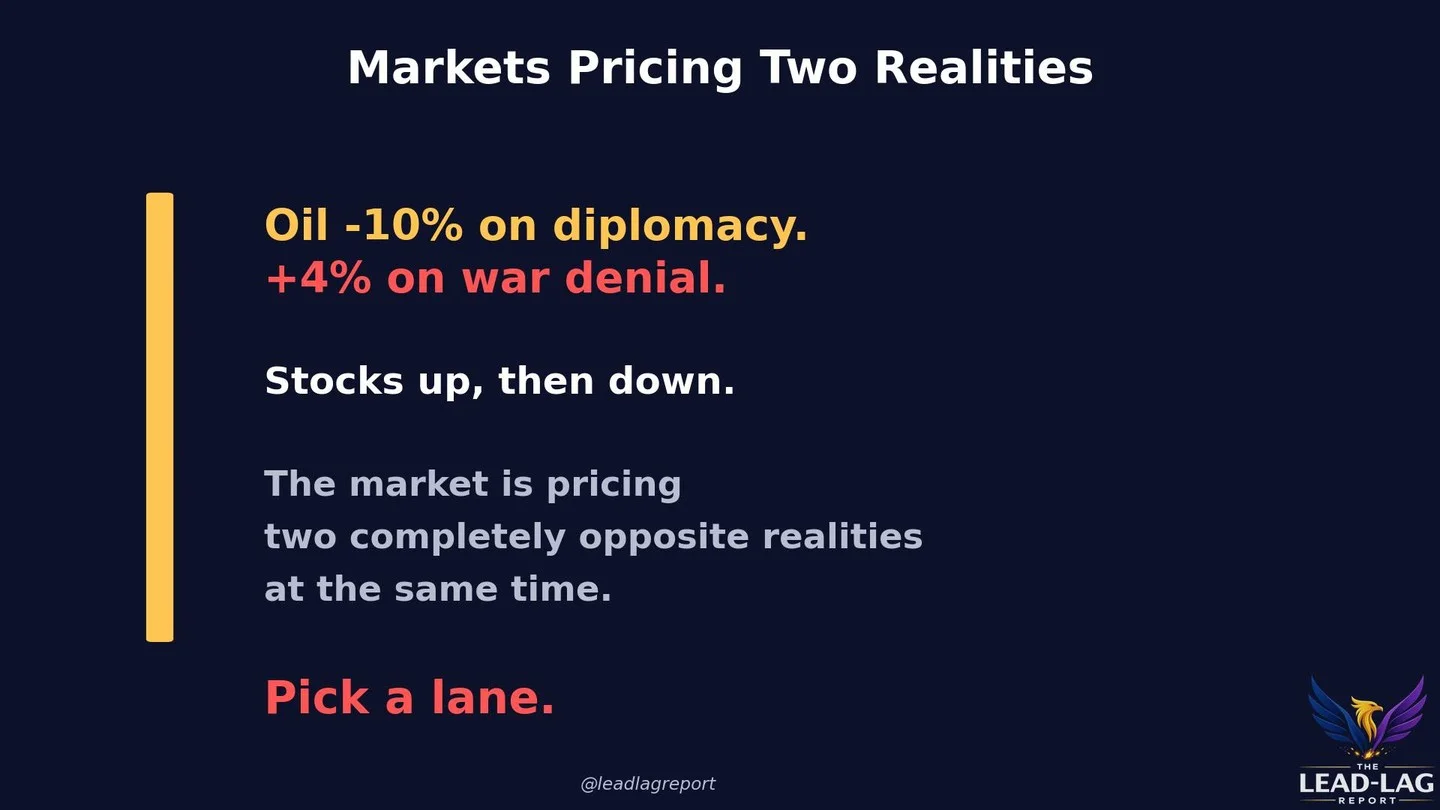
Markets Hedge Both Ceasefire and War, Await Resolution
The market prices a ceasefire and full-scale war simultaneously. Diplomatic pause: oil -10%. Iran denial: oil +4%. SPY -0.80%. Same week. Opposite pricing. 48 hours apart. Beneath the whipsaw, TLT keeps bleeding. Spreads widen. Copper stays down 10% monthly. Breadth broken. Geopolitical noise drives...

Energy Stands Alone as 2026’s Sole Positive Sector
Energy is the ONLY sector positive in 2026. Not tech. Not financials. Not healthcare. Oil and war. That's the market's only winner. $XLE $XOM $SPY https://t.co/knCwIMzMam

US Stocks Lag Behind Canadian Equivalents, Raising Opportunity Cost
it's clear... U.S. stocks whether equal-weighted $RSP or market-cap $SPX weighted are trending down vs. Canadian stocks $EWC making an oppoortunity cost for U.S. investors... https://t.co/MKHgNCqmYQ

Rising 10‑Year Yields Signal Regime Shift, Not Safety
10Y yields at 4.38% and RISING during risk-off. That's not the flight-to-safety playbook. That's a regime change. $TLT $SPY $GLD https://t.co/nCaYnxlGaO

Commodities Outpace S&P, Hinting Lower Stock High
did the rally of stocks $SPX vs. commodities since the '22 bottom roll over making a bigger picture lower high in favour of commodities? hmmm.... 👀 https://t.co/06LFvU59Fx

Rising Dollar and Volatile Oil Hurt Importers
$DXY near 100. Oil still swinging wildly. That combo is a hidden margin tax on every import-dependent company. $SPY $EEM $UUP https://t.co/IJ2NbkeCZZ

Slow Gap Fill Signals Potential Breakaway Trend
$SPY would have to decline to 657.03 and $QQQ to 587.93 to fill this morning’s gaps. How quickly the gaps get filled -- if at all – gives us an idea of how strong the underlying trend is… but if...

SPX Tests Resistance, Bearish Trend Still Intact
The $SPX is back up to the top of five-week descending trend channel and the 200-day SMA as combined resistance. What's the prevailing trend for the benchmark index? Bullish or bearish? https://t.co/CyJUytkudU

SPY Breadth Collapse: Only 25% Above 50‑Day MA
Only 25% of $SPY components are above their 50-day MA. The index is hiding a breadth collapse. Don't trust the headline number. $QQQ $IWM https://t.co/gMu0klhbVb

QQQ's Modest Dip After 100 Sessions Signals Strength
Today will be the 100th session since the Nasdaq 100 QQQ peaked. Yet it isn't even 10% off its high. That has tended to be a good sign, esp relative to those times it was deeper into a correction at the 100-day...

Will QQQ Hold Above Yesterday’s High? Watch Monday
Can the $qqq get and stay above yesterday’s high? Or fades. If it holds. Watch Mondays high https://t.co/lSsXXal0P7

S&P 500 Re‑tests Oct 10 Low Amid Pullback
left: S&P 500 $SPX pulled back and in the neighbourhood of the lows from the Oct 10th "biggest bar against" right: S&P/TSX $TSX https://t.co/kzsEuflLan
ENLV Posts $25 EPS, $1.23B Net Income
$ENLV numbers are out. $25 EPS, $1.23B net income profit. The @Enlivex treasury strategy is showing up in the financials for the first time. Worth watching how this moves.

Barclays Lifts 2026 S&P 500 Target to 7,650
Barclays raises 2026 year-end S&P 500 target to 7,650 despite Middle East, inflation risks https://t.co/UIix0xSpIM

Ceasefire Talks Boost Global Markets, SPX Near Resistance
Mostly green arrows around the World as Israel says there’s growing talks for a 30 Day Ceasefire. Europe and Asia broadly higher $spx futures +62. We’ll see if early strength builds or fades. $spy pivot resistance $662...

NASDAQ Breaks Support, Faces 2022‑Style Decline
NASDAQ is in bear trend Broke support Now almost at 50W MA NASDAQ still has a long way to fall if we mirror 2022 (midterm+war year) https://t.co/psqDN4PltZ
False Iran Claim Fuels Fleeting S&P Rally, Then Fades
Yesterday the S&P 500 surged on Trump's claim of productive talks with Iran. Today Iran said those talks never happened. Oil jumped 4%. The rally evaporated. The S&P closed below its 200-day moving average for the third straight session —...
Dow Holds Near 45,500, RSI Rising, Watch Resistance
#DOW doji Candle and Sideways 4 days. Support 45369. Resistance 46712, 47428, 48000. RSI 34 quite low and flicked up. Top Bollinger Band 47486. Midpoint Line 46468. Bottom Band 45450.

Broad Market Breadth: 60% of S&P
Good breadth today (if you're a bull) @stockcharts 60% of SPX names were up... $MDY $IJR $IWM higher https://t.co/pH2LtE4VaQ

QQQ Breaks Below 99‑SMMA, G
$QQQ (per request) Very similar to SPY. Top Goon X sell approaching alert is playing out and price currently looks like a clean breakdown below horizontal and 99smma support https://t.co/1V81W01FXC

Sam's Stocks Soar as Dell, Ciena Rise
Sam, you're having a good day with names like $DELL and $CIEN ramping higher in a down Tech tape @SamofAmerica

Market Stuck in Choppy Frustration, Spotting Strength Trade
The market's taking the path of most frustration with no clean flush, just chop. Here's a short update on what I'm watching to signal the next real move, plus one trade idea showing serious relative strength despite the noise. $SPY...

Trump Claims Productive Talks, Iran Denies; Market Rally Fades
Trump said US-Iran talks were "productive" and markets rallied over 1% on Monday. Iran's parliament speaker then responded: "No negotiations have been held with the US." Today the rally is already fading. The trend is down we’re making lower lows.

SPX Accelerates: Five 1% Moves in Eight Sessions
The $SPX now has logged five 1% moves in the last eight sessions, which is a high and dangerous pace. We can see just how different it is versus what happened from January through late February. While we didn’t see...

SPY May Fall 30%, Rebuild Below $475
$SPY Can't rule out a 30% drop but I think it could take a long time. Some supports along the way but if we go sub $475 then that's the ideal zone to build back long term exposure (not financial advice just...

S&P Nears Selling Climax Amid Deep Valuation Drop
In the table below, we see that the drawdown in the S&P 500 has now reached 7.6%, with breadth reaching moderately oversold levels. That drawdown masks a far bigger decline in valuations, with the trailing P/E down 20%. The MSCI EAFE and...

SPX's Fleeting Spikes Fuel Trader Indecision
At the beginning of recent weeks, SPX wicks up and then as the week goes on, the gains are given back. Certainly a way for the market to keep people continuously second-guessing their resolve https://t.co/vJ5eWqHZA8

US Equities Outpace Global Markets After Iran Strike
Nice look at US stocks' performance vs international after geopolitical shocks. US tends to be cleanest dirty shirt in these times. This time no dif, $VOO down 4.6% since Iran strike but $EFA down 9%. Nice note (which he put...

Rally Fades as ES and NQ Stay Below Key Averages
Yesterdays rally continues to fade pre market as $ES_F and $NQ_F remain below🟠5SMA and 🟢WTD AVWAP (hourly chart on left) On the 10 min chart, the 🟠"TACO news" AVWAP provides us with the average price since that event, with prices below...