
SPY at $654: Stay Below or Reclaim Pressure
Simplify it today. Does the $spy stay below yesterday’s low of $654 to keep some pressure on. Or reclaim it to relieve some pressure https://t.co/55Ia8e83Mu

Market Rally Fueled by Hype, Iran Risk Remains Unpriced
Fake News Saved The Market My morning rant Monday. Strong opinions held strongly.🙃 The short-covering bounce driven by headlines & algos, not fundamentals, doesn't change the fact: IRAN RISK IS NOT PRICED IN. $SPX $6666 –6718 as $DXY falls won't save us as yields...

ETFs Dominate Trading, Fueling Shorting and Volatility
Citadel on Flows: - ETFs have accounted for ~35% of trading volume over the past three weeks, peaking at 47%, and setting a record streak above 35%. - This reflects active shorting via ETFs to reduce net exposure. - Levered end-of-day flows remain...
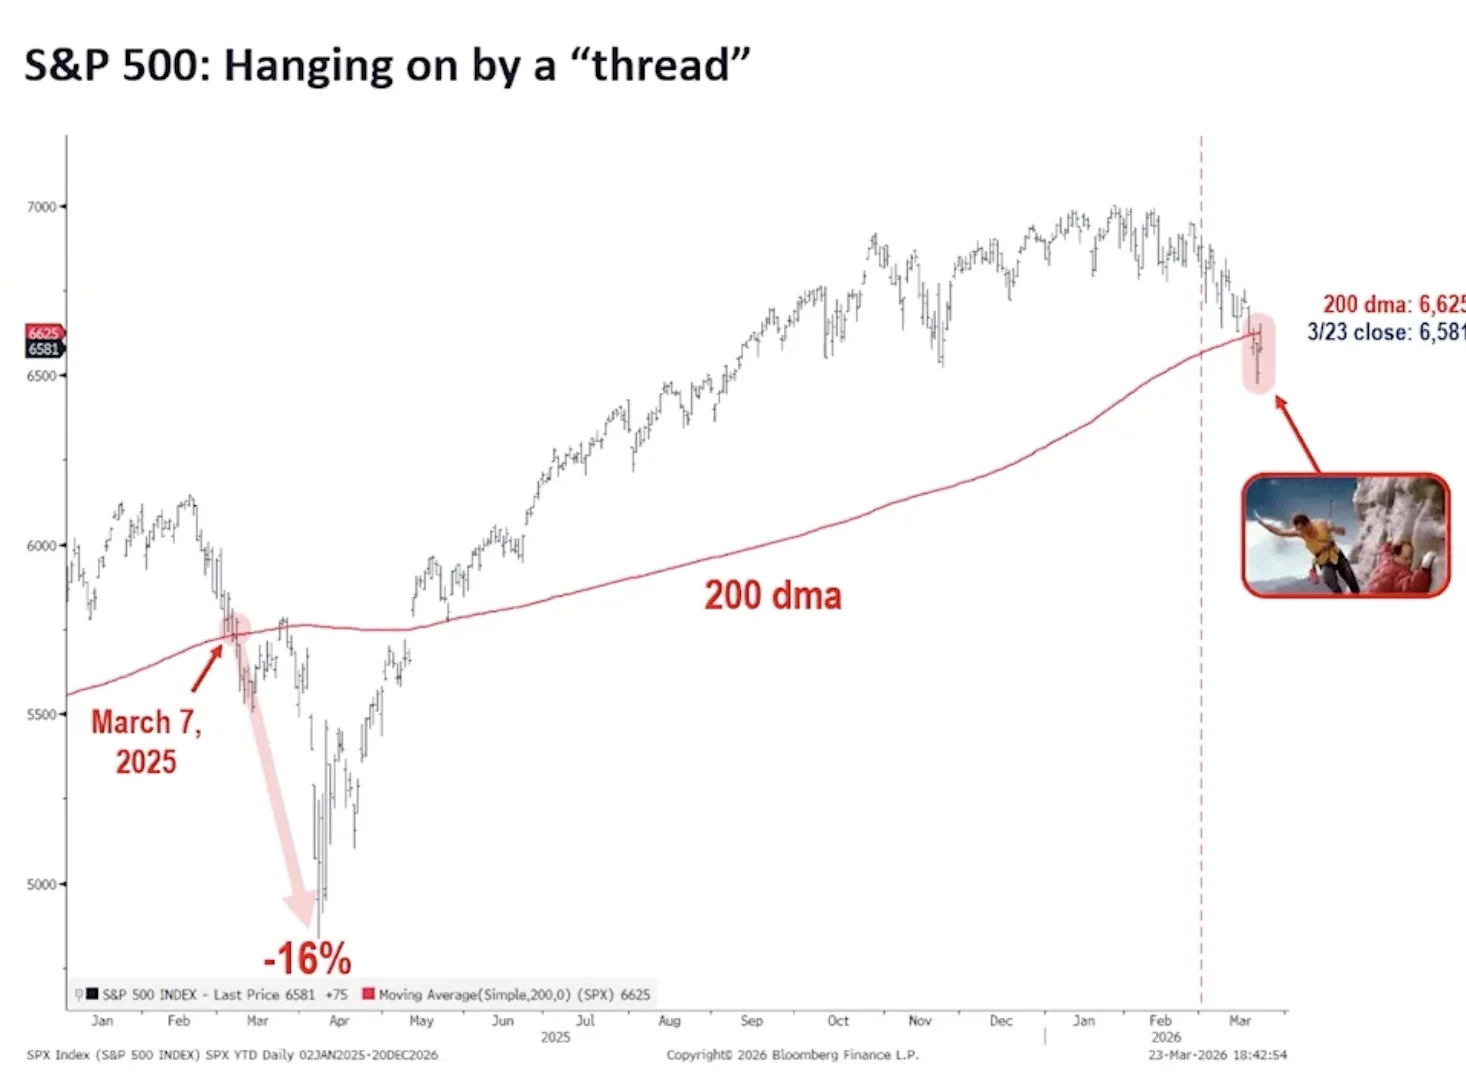
200‑DMA Breach Triggered Market Crash After April Tariffs
Why is 200dma important? Last year when S&P broke below its 200dma the markets crashed due to april tarrifs

Markets Mixed, Awaiting SPY Confirmation Above $654
Mixed markets around the World after yesterday’s bounce attempt. $spx futures-7. We’ll see if $spy has an inside day above $654ish to show some commitment to yesterday. Or not. News flow remains fluid. https://t.co/tJBZY4fjc3

S&P 500 Bounce Matches Chart Line—Pure Coincidence
YES - the S&P 500 "bouncing" today at one of the 700 lines you have drawn on the chart....is just a coincidence.
Nasdaq Doji Signals Bullish Turn if 21522 Holds
#Nasdaq Comp Doji Candle but up on Friday's Candle. Support 21522 must hold. Resistance 22189, 22569, 22906. RSI 39 not low but flicked up. Top Bollinger Band 22879. Midpoint Line 22251. Bottom Band 21616.
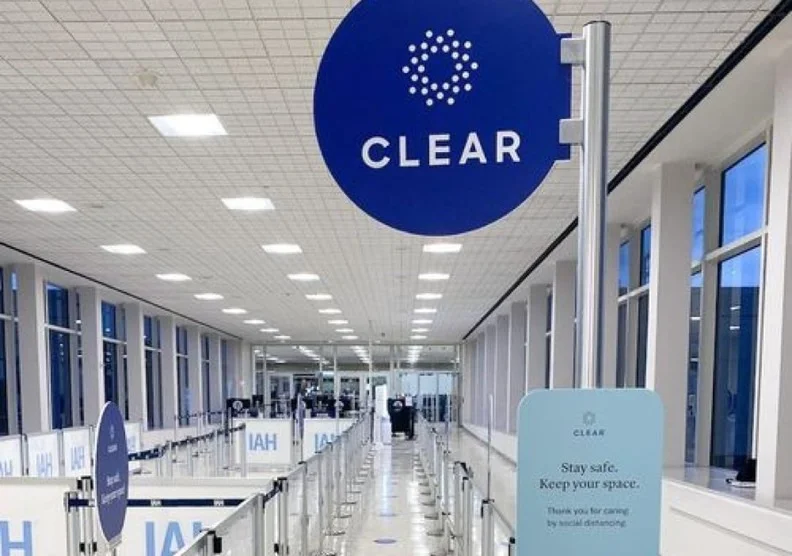
Multiple Stocks Reach 52‑Week Highs Today
All these stocks hit new 52 WEEK HIGHS at some point today Clear Secure $YOU Akamai $AKAM ConocoPhillips $COP Digitalocean $DOCN EOG Resources $EOG TechnipFMC $FTI GE Vernova $GEV Halliburton $HAL Mastec $MTZ Murphy Oil $MUR New York Times $NYT Pembina $PBA Restaurant Brands $QSR Tenaris $TS Tower Semi $TSEM
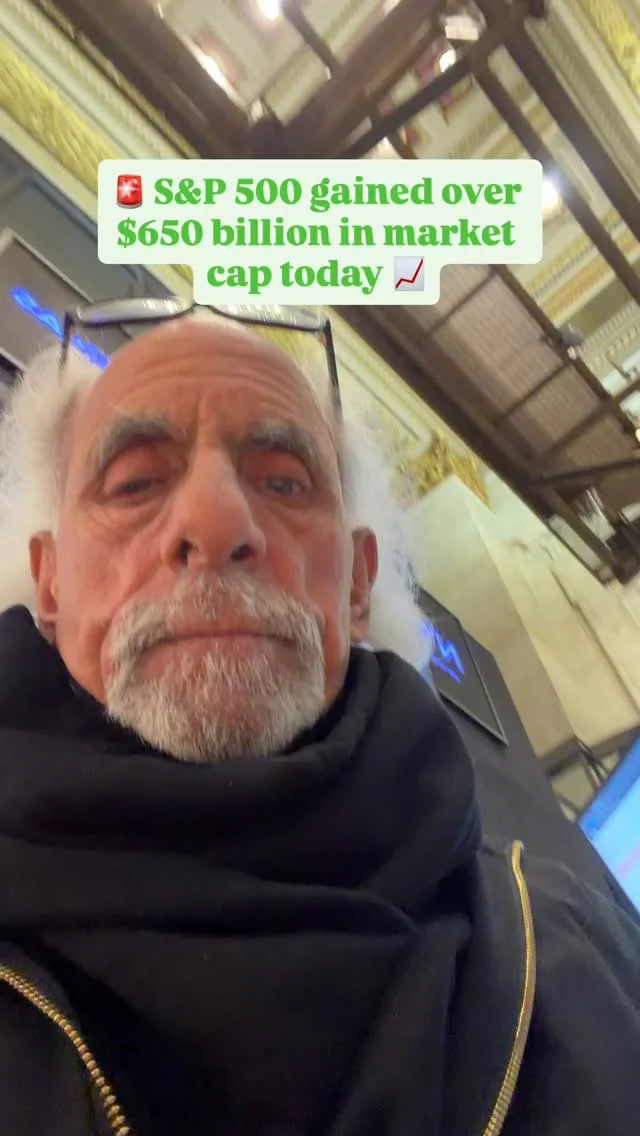
S&P 500 Adds $650B Market Cap in One Day
MARKET RECAP 📈 What a wild day, the S&P 500 gained over $650 BILLION in market cap today, jumping 1.15%. Earlier in the day, the index was up over $1 TRILLION in market cap, up 2% 👀 What the heck is...

Dow Holds 200‑Day Support Amid Volatility, Awaiting Trump Impact
Through today's (massive) volatility, the #Dow has held up the 200-day SMA as former support new resistance and maintained the descending channel of the past ~5 weeks. What will the Trump headlines bring for markets tomorrow? https://t.co/t3i7qUOG2I

SPX Needs 40‑Week MA Break to Halt Downtrend
$SPX - The attempt to close above the 200 day MA has failed. Even if it closes above the 200 DMA it won't be enough to confirm a Friday bottom. Last year before the "Liberation Day" crash it closed above...

Record Down Volume Followed by Record Up Volume
A day after the heaviest down volume in NYSE history, we get the heaviest up volume. Totally normal market. https://t.co/odNR7bgM5P

Markets Turn Defensive as S&P Breaks 200‑Day Trend
S&P 500: four straight weekly losses. 200-day MA: decisively broken. Fed: discussing rate hikes. Gold: worst crash since 2011. Oil: above $110. 3 of 4 intermarket signals say defense. The one that doesn't? It's the least convincing of the four. https://t.co/zTqF9056g8

QQQ Flat Between 20‑50 Weekly SMA Amid Political Chaos
All this drama and $QQQ still stuck between this range between 20 and 50sma weekly. More chaos politically the more leaning technically. https://t.co/cRWdMHiEh5

XLE Soars 31.8% as Middle East Energy Hits Hard
IEA confirmed it. 40+ Middle East energy assets severely damaged. Not 1. Not 5. Forty. $XLE is the only S&P sector positive since war began. +31.8% YTD. Everyone else is still pretending this is temporary. https://t.co/5G2vuSlSjh

Dow Rebounds to 200‑day SMA Amid US‑Iran Talks
I guess we are taking the President's remarks of 'productive' talks between the US and Iran at face value and not just a fear of hitting the 48 hour deadline and having to escalate with a market reaction... Dow has rebound...

SPY Breaks Support; Avoid FOMO Long at Key Level
$SPY Crazy price action. Now backtesting broken support. Key level here not a good spot to FOMO long into https://t.co/lxFPici06g

Oversold S&P Poised for Rebound After Four‑week Slide
The S&P 500 has been down 4 weeks in a row, and six of the last 12 weeks. As of Friday, we were off ~6.8% from recent highs, with the Nasdaq off ~8.2%. This looks less a case of TACO, and more...

Longs Find Breathing Room; Friday May Mark Low
We’re getting breathing room for longs this morning, but this is the tougher path for traders as price drifts back into the chop without a clear washout event. Friday could prove to be the low and the start of...

S&P Dips, VIX Stays Flat Despite Market Drop
last week, as the S&P 500 $SPX made lower (ugly) lows, the volatility $VIX index did not... https://t.co/Vmdmxc3JXz

Stocks at Critical Support: Oversold, Risky, Now-or-Never Rebound
Learnings and conclusions from this week’s charts: 1. Stocks are at a make-or-break point (major support level). 2. Conditions are increasingly oversold. 3. Sentiment and valuations have seen a partial reset. 4. (albeit from an overvalued/excess-greed starting point) 5. Pre-war, the global earnings/macro pulse was...

Dow Jumps 1,600 Points; Hormuz Risk Still Looms
🔴 Dow swings 1,600 points after Trump pauses Iran oil strikes - but the Strait of Hormuz risk isn't gone Oil. Gold. Rate hikes. I break it all down. Are you buying or selling into this move? Let me know below 👇 $DOW...

NVDA Signals Potential Support for Today’s Gap Up
$nvda can give some clues on how much of today’s gap up can hold https://t.co/oNBBNMrr7h

S&P Jumps as Trump Pauses Iranian Strikes, Oil Slides
Hope you’ve had your coffee Futures are ripping to start the week S&P is up 1.5% pre market after Trump says the U.S. will pause further strikes on Iranian energy infrastructure for 5 days Oil reacting fast, down 10% to $90 Big week ahead...

Shorting Missed the Exit; Market Already in Sell‑the‑rip
📺 IF YOU’RE SHORTING NOW… YOU’RE LATE The key level in $SPY (~$677–$680) was lost much earlier than you think — that was the real exit signal. Once that broke, the market entered a sell-the-rip environment, where every bounce into the...
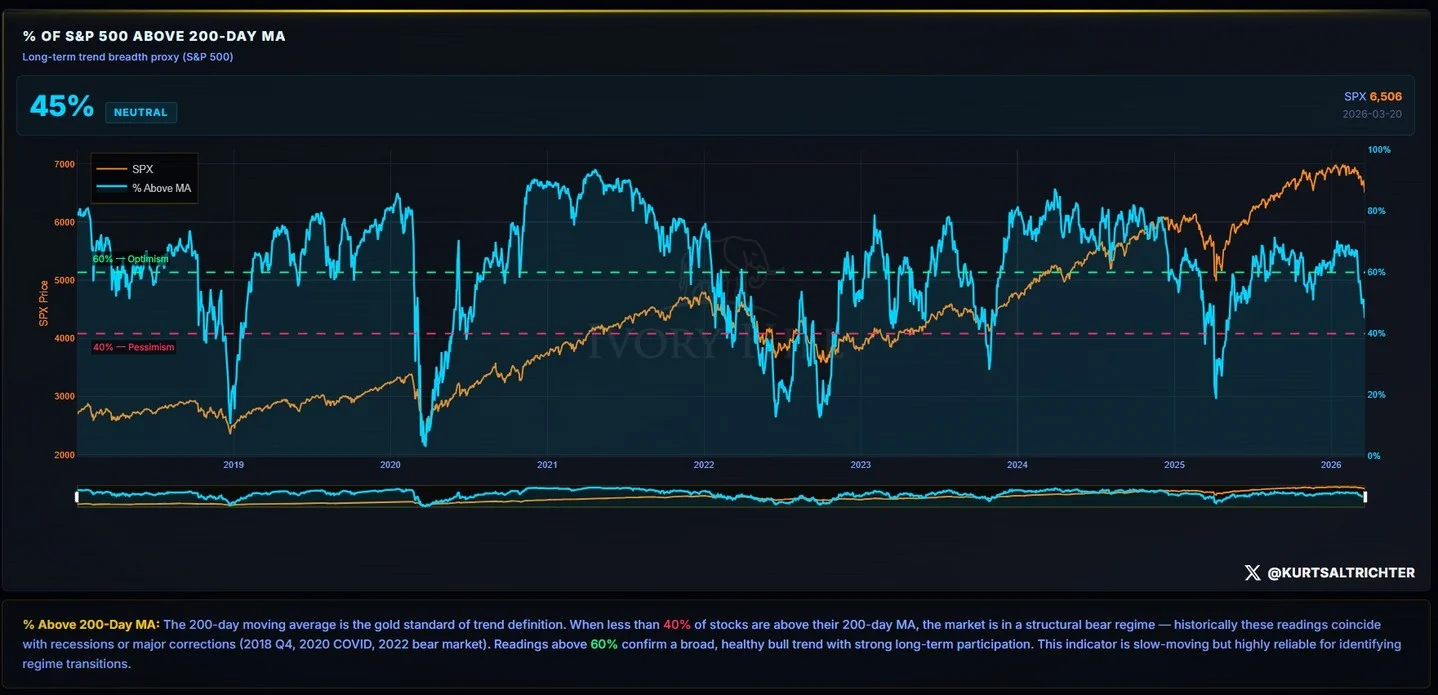
S&P 500 Near Bear Market Threshold at 45%
45% of the S&P 500 stocks are trading above their respective 200-day moving averages. The 40% level is where bear markets live. Recessions. Major market corrections. 2018. 2020. 2022. Five points away.

SPX Futures Surge Post‑Trump, Watch 6623‑6754 Resistance
The morning changed pretty fast — $SPX futures went from -45 to +130 handles after Trump said the last 48 hours of talks were very productive. There should be some resistance near 6623ish, and 6754 is the major if this...

Indices Outpace Stocks in Pre‑market Amid Ceasefire
We have a little ceasefire for the next five days, but it seems like the indices have moved a lot more than individual stocks pre-market.

SPY Spikes on Trump's 'Productive' US‑Iran Talks
$SPY printed a Sky Scraper Candle after Trump says U.S. and Iran have held ‘productive’ talks: CNBC https://t.co/1sxKxOeC2e

SPY Pre‑Market Surges Unprecedentedly Amid Fresh News
$SPY pre market looks wild after reacting from more news. Never seen anything like this before ha. https://t.co/iFCOQ8PDfa

Dow Futures Surge 1,200 Points After Trump's Iran Talks Claim
Dow futures jump 1,200 points after Trump says U.S. and Iran have held ‘productive’ talks: CNBC https://t.co/ayLrxCx0Ot

Sell Imbalance Hits 2022 Levels, Hedging Costs Soar
From GS on Flows (BBG): - Biggest sell imbalance since 2022 (Friday) - Stresses no longer “ignored” - “can start talking at what innings we’re in because the game has finally started” - Hedging is so expensive that to break even, would need indexes...

Magnificent Seven Lose Correlation with S&P 500 Again
🇺🇸 The positive correlation between the “Magnificent Seven” stocks and the S&P 500 index has disappeared again. https://t.co/Aq6mZl2Tcn

QQQ Seeks Pivot Low Amid Red Sea
$qqq lost so many levels while names broke down prior to last weeks move. We’ll see if if in a sea of red some names can go green. Perhaps the $qqq give a pivot low to use in the first...

SPY Slides, Eyes 644‑645 Support Amid Red Momentum
Mostly red arrows around the World Lots of spots to switch gears as the $spy lost the 8/21/50/100/200 day. $spx futures-42. Simplify today like last week. Does the $spy reclaim $644-$645 area to relieve pressure. Or Do we do...

US Stocks Barely Reflect War Risks, S&P Down 6%
The notion US stocks have yet to price in a dramatic war escalation makes sense. The S&P 500’s down just 6% from the peak. We’ve seen mediocre earnings, eco reports trigger deeper declines than the one we have currently https://t.co/esTq56VbOq

Algorithm Signals 94% Chance of Market Bottom
The stock market is very oversold $NDX $SPX SPX-BIGBOT algorithm we monitor (see bottom panel on chart) is flashing 94.4% probability of a large market bottom. On watch for a final flush (capitulation) followed by an intra-day reversal. https://t.co/BrhHwoD6Ls

Key S&P Level Threatens 2008‑Style Crash
It's good to have eyes wide open...just in case Crash Risk: 2008-Type Waterfall Level Is Here Rising oil, yields & dollar are increasing market stress. VIX has a persistent bid. A key $SPX level could trigger either a bounce OR a sharp "2008-style"...

Tech Forward P/E Near Long‑Term Median Since 1995
S&P 500 Expanded Tech Forward P/E Ratio.. right near its long-term median since 1995 @wisdomtreefunds https://t.co/gRuj8dp3hU

Rising Gas Prices Drag Down Discretionary Spending
Energy sector $XLE: +33% YTD Consumer Discretionary sector $XLY: -10% YTD Higher gas prices are expected to reduce discretionary spending. The more you spend at the pump, the less you have to spend elsewhere (travel, restaurants, clothing, etc.). Video: https://t.co/kTI1Olplo7

Defensive Sectors Lag as Risk‑on Stocks Surge
Last week saw the defensive stuff lag (utilities, staples, and healthcare). While financials, industrials, and tech lead. Not exactly what you'd expect to see if this was a pure risk off environment. https://t.co/Fj8UAuTQM0

SPY Breaks 200‑day MA, Signaling Regime Shift
$SPY broke the 200-day moving average. First time since May 2025. That's not a dip. That's a regime change. JPMorgan just cut their year-end target. Next support: 6,000–6,200. The market is telling you exactly what it's pricing. https://t.co/rl7QY5Hj3L

Weekly Outlook
S&P 500, Nasdaq, Dow Forecast for the Week Ahead https://t.co/OcHNiybaDE #SPX500 #Nasdaq #Dow Weekly Charts https://t.co/CFWjG0EJik

Heatwave’s Record Area Equals Size of Greenland
It's not just a swath of all-time March record highs... it's the size of greenland https://t.co/oliOqKe7PB
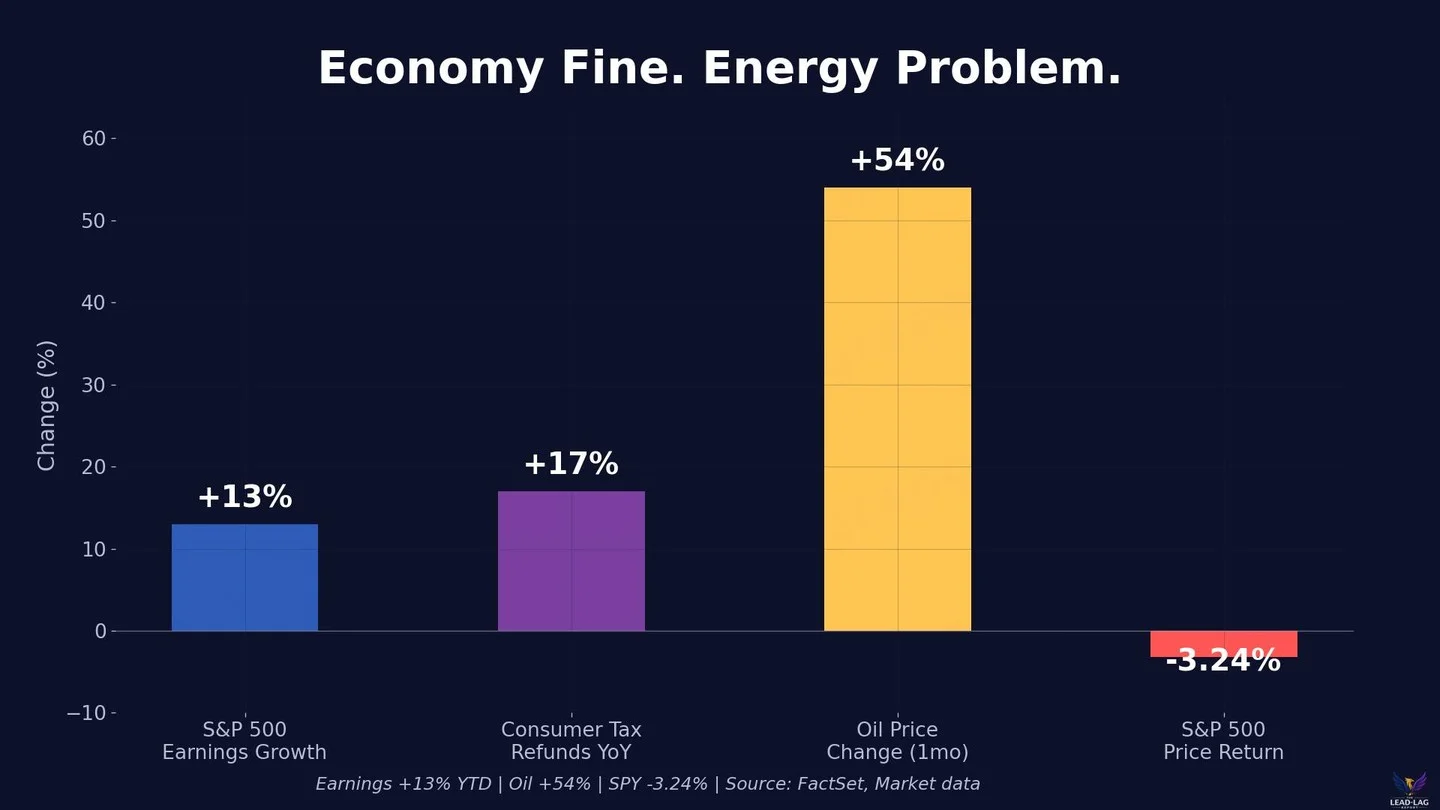
Earnings Rise, Prices Fall: Energy Costs Lag Impact
S&P 500 earnings growth: +13% year-to-date. S&P 500 price return: -3.24%. Strong fundamentals. Falling prices. What's actually happening? The economy doesn't have a fundamental problem. It has an energy problem. Oil at $110 is a forward tax on margins and consumption that...

Market Faces Critical Crash Support, Selling Pressure Rises
Selling Into Critical Crash Level Support Poor breadth, rising yields, fragile support levels. Selling pressure builds as crash support zones come into focus. A technical review & why $SPX $6508 & $QQQ $578 matter. https://t.co/clgEWxEHum

S&P 500's Top Ten Dominate
GS: Concentration of S&P 500 market cap and earnings in the 10 largest index constituents... jaws are clamping down a bit https://t.co/UX5qVWlYho
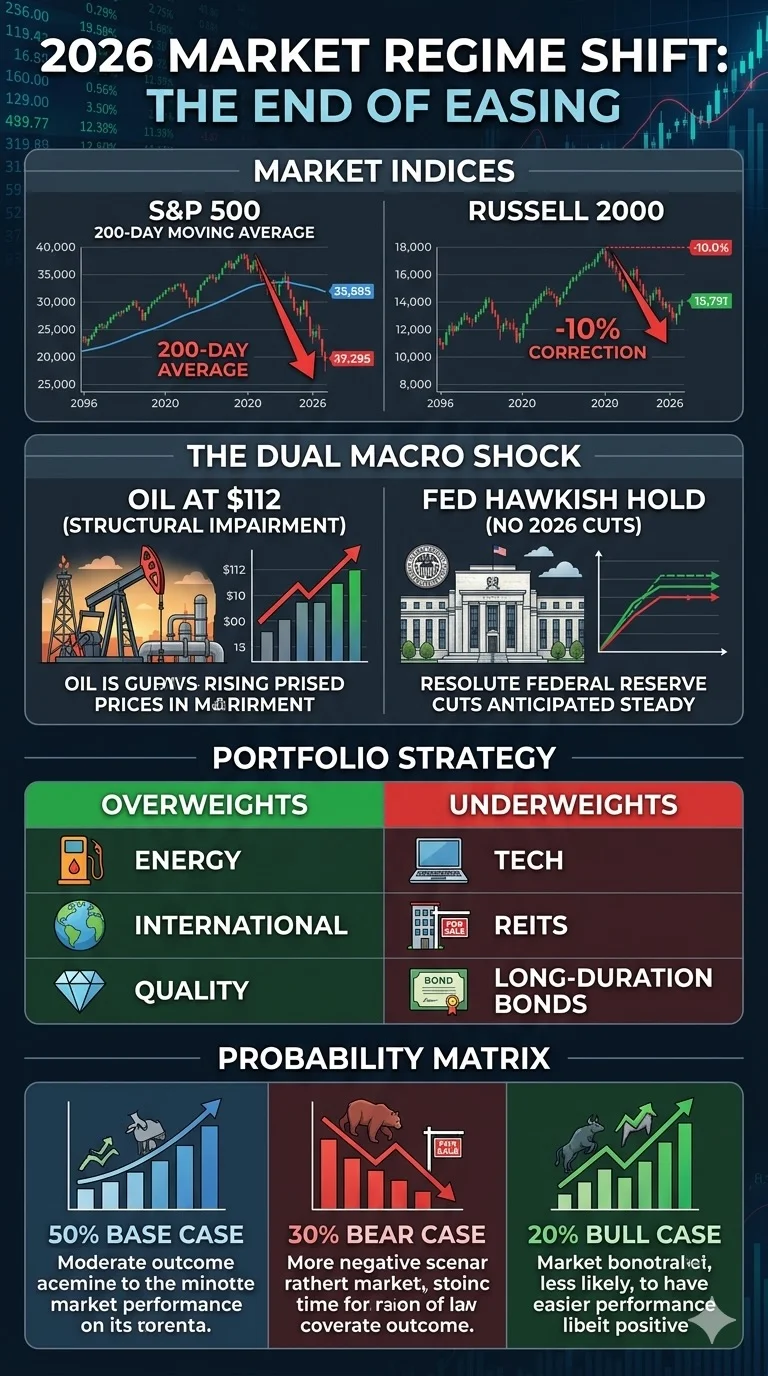
Market Regime Shift: Oil $112, Gold Crash, S&P Below 200‑Day
I just dropped my US Equity Market Weekly Intelligence Report on Substack - Oil at $112. - Gold’s historic crash. - S&P just broke below the 200-day MA. This week just triggered a full market regime shift heading into 2026. Read the full breakdown on...

S&P 500 and June E‑Mini Breach Key Support, Risk Downside
Both S&P500 and S&P June E-Mini Futures looked to have violated levels that could lead to additional downside. https://t.co/lo2FDEAZl2
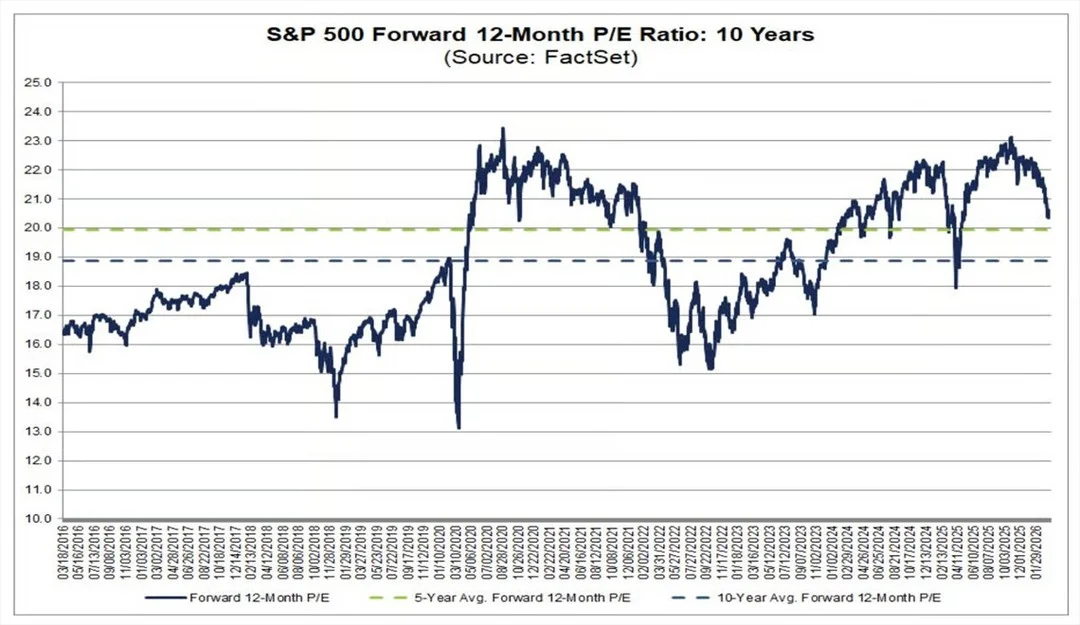
S&P 500 Forward P/E Falls to 20.3
"The forward 12-month P/E ratio for the S&P 500 is 20.3. (down 2.8pts from the high... the market multiple hits correction territory)" -Mike Zaccardi