Adobe Stock Plummets to 7‑year Low as AI Loser
Adobe Stock Hits 7-Year Low After It's Branded AI Loser https://t.co/CDZou0lrKO $ADBE $DOCU $HUBS $MSFT $ORCL

VIX Plunge Signals Rising Market Complacency Amid Stress
$VIX: 27.85 on March 13. 21.51 now. A 6+ point collapse in one week while oil trades near $100, the Fed just held, and private credit is cracking. Complacency doesn't announce itself. It just shows up in the $VIX. https://t.co/QOUSwv6YZ0
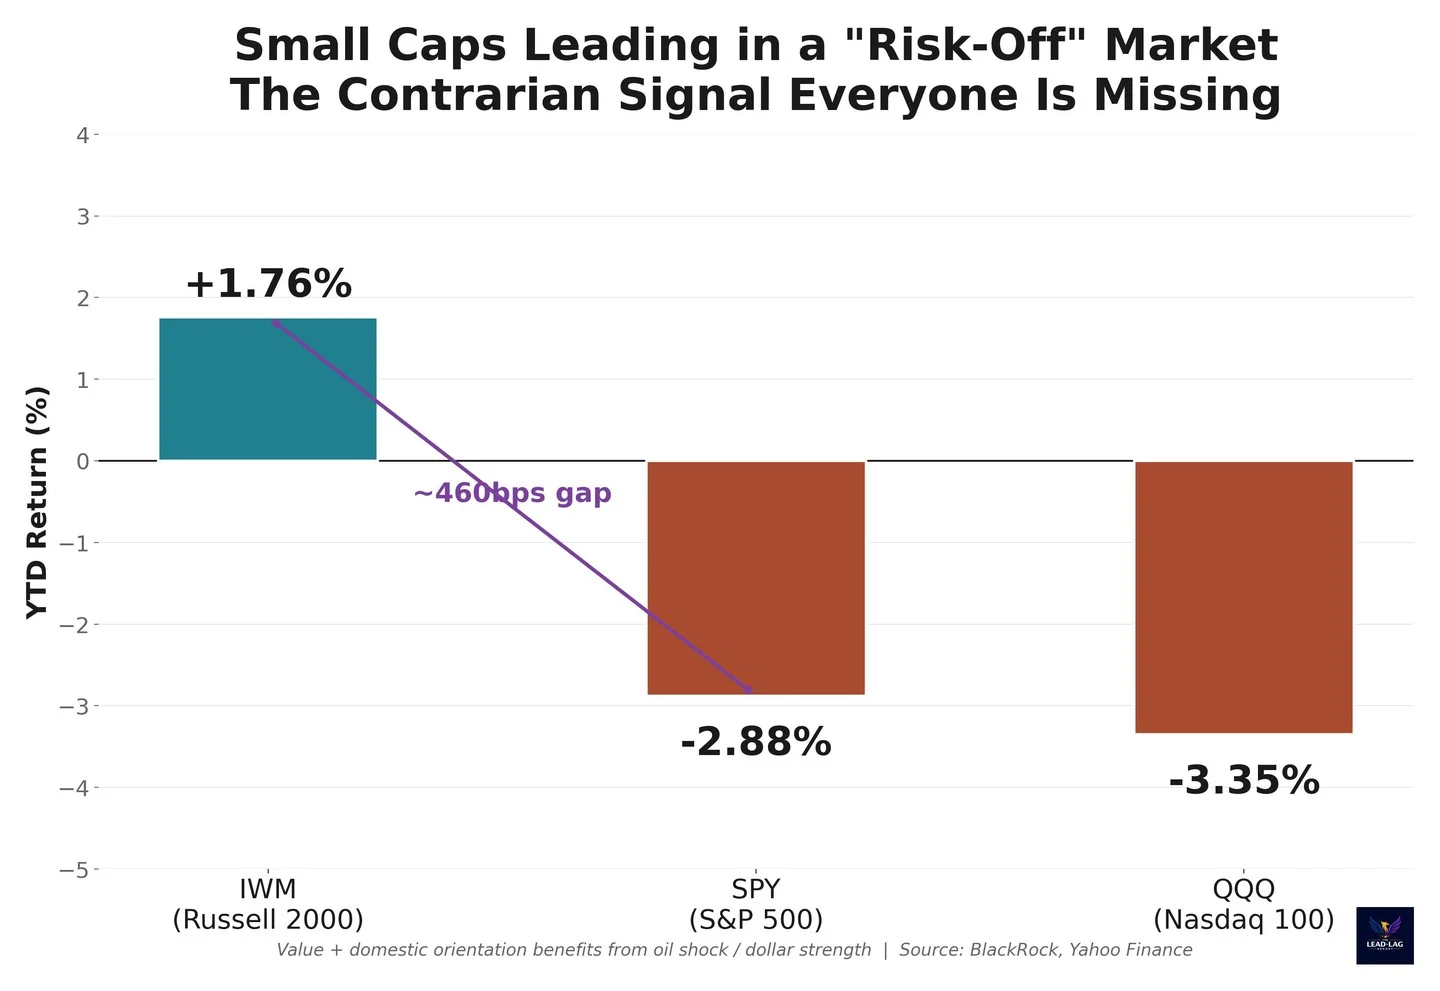
Small Caps Thrive as Large Caps Falter in Risk‑Off
IWM up 1.76% on the year. SPY down 2.88%. Small caps outperforming large caps by nearly 460 basis points. Nobody covers this because the narrative is pure risk-off. But small caps — domestic, value-oriented, less exposed to global supply chains —...

Fed's Hidden 1.9% Inflation Fuels 8,000 S&P Target
The Fed just spoke. Now hear what they won't tell you. LIVE today 1PM ET with @JDHatfield_ICAP: → Real inflation is 1.9%, not 3.1% → S&P target: 8,000 → CE credit eligible FREE: https://t.co/hWPjvUpuMt @InfraCap https://t.co/OV1gD4HZBs
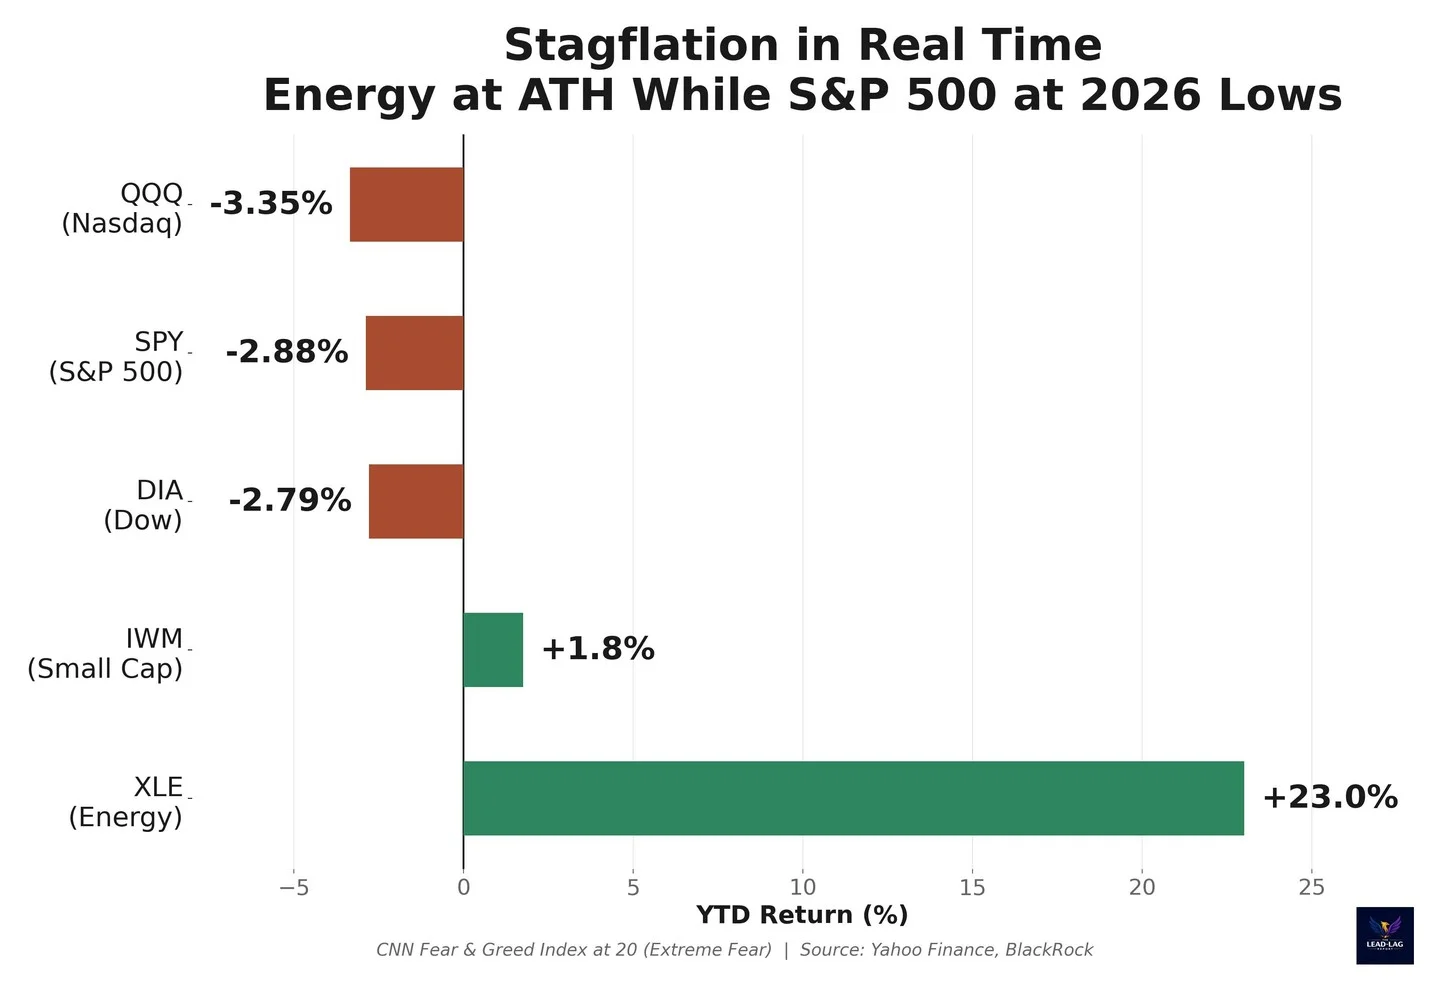
Energy Rises, S&P Crashes: Stagflation Signal Emerges
Energy stocks at all-time highs. The S&P 500 at 2026 lows. CNN Fear & Greed at 20 — Extreme Fear. This is the stagflation setup in real time: rising energy costs crushing margins while growth softens. What I find fascinating is how...

SPX Above 6640 Signals Short‑term Failure Risk
If $SPX gets back above 6640 (and the 200 day MA), we would have a short-term failure on our hands. Not sure if that kick starts anything substantial, but it wouldn't be a terrible look...

S&P 500
Will look closer later, but this might be the first time in a while the S&P 500 gapped under its 200-day MA without having previously breached it even intraday in the prior months. Interesting.

S&P 500 Weekly Momentum Remains Low
Week isn't over, but weekly momentum for the S&P 500 is at a pretty low level..... https://t.co/4q8LlgwKjX

Energy Surges, Financials Slump: 40% Sector Gap
>40% spread between the best and worst performing sectors so far this year... -Energy $XLE: +31% -Financials $XLF: -11% Video: https://t.co/kTI1Olplo7

Testing 6631.50 Swing Low Signals Short Covering
SP - test previous swing low....6631.50. (Will be main reference point for rest of day) but easy to see the initial short covering come in. https://t.co/UBAbLSkevS

US Stocks Dip After Europe Closes, Timing Matters
$SPY -0.3% $VGK Europe -0.9% (don't compare S&P 500 futures to the European indexes this morning... US stocks plunged after the European close yesterday... timing difference) @finviz_com https://t.co/KJVqqbxvMc

SPY Battles Around $661: Will It Stay Below?
Tactically $spy $661ish is the battle ground for today. Does it stay under or reclaim. https://t.co/NCX9lIi8IW

S&P 500 Faces Frequent >1% Drops Ahead
The S&P 500 fell 1.4% today, its 7th daily decline so far this year with a loss above 1%. Expect to see many more of these days in the coming weeks/months - the average year since 1928 has 29...

S&P 500 Tests Support Near 200‑Day MA
#SP500 Down Candle and parked on 200 day MA Line. Support 6521, 6443, 6360. Resistance 6710, 6845, 6901. RSI 39 not low. 13/21 day EMAs Bearish. Top Bollinger Band 6860. Midpoint Line 6727. Bottom Band 6590.

Oversold Growth Stocks Show Unexpected Strength versus Indices
Growth stocks declined over the past few months and are now very oversold. Interesting to note that they are now showing relative strength versus $NDX $SPX The generals of the army always get shot in the end.

Trump Blames Fed While His Policies Fuel Market Decline
President Trump claiming the stock market is doing down because of Fed Chair Powell. The stock market has declined because of the conflict in the Middle East, higher oil price and risk of rising inflation. So, the President himself is responsible...

Energy Leads as Discretionary Stocks Hit Bottom
In the US equity market, the energy sector is the only one gaining ground while everything else corrects. Consumer discretionary stocks are at the bottom, and while it’s tempting to conclude that this is because the dystopian “Citrini” scenario...

S&P 500 Nears Full Loss of Recent Gains
The S&P 500 is close to giving back all the gains of the last two days and reach another post-Thanksgiving closing low.
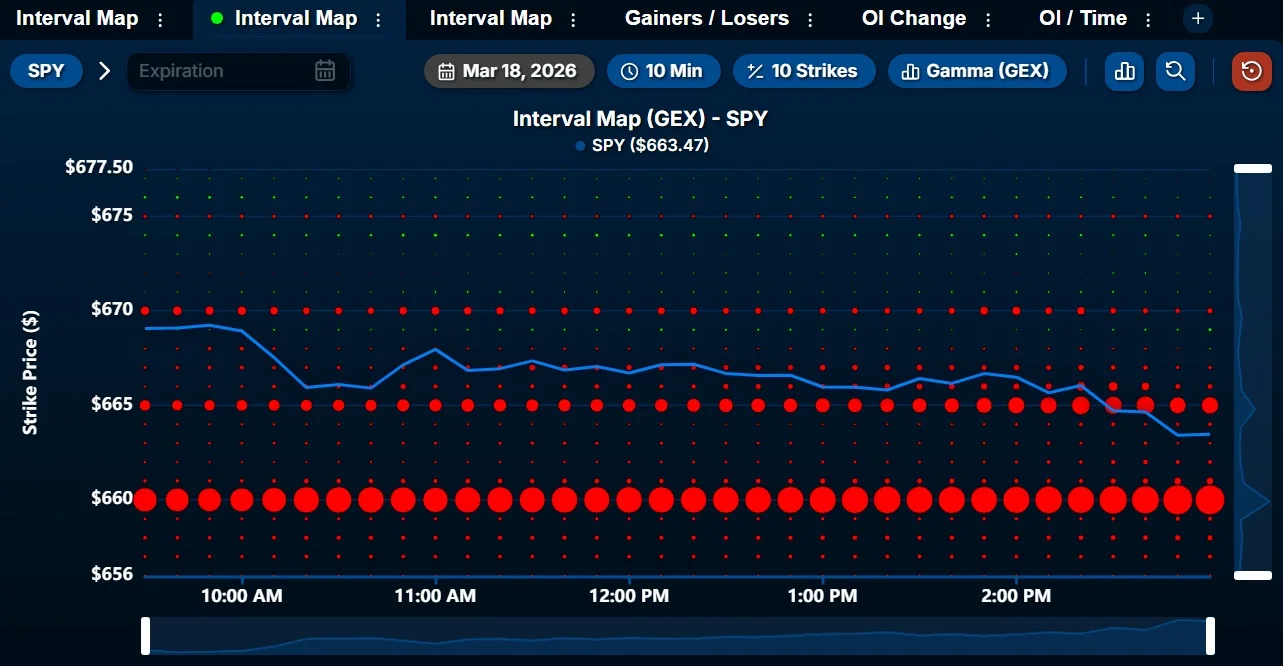
Watch $SPY Near Critical $660 MVC Level
$660 is the MVC on $SPY and is/has been a very significant level recently. Worth keeping an eye on as price approaches 👇

Fed Chief Warns Inflation Expectations Could Unanchor Amid Shocks
Powell reiterates that the Fed "worries a lot" about inflation expectations becoming unanchored due to the multiple shocks over the last 5 years.

VIX Poised for New Highs as SP, Dow Lead
would love to see VIX make new highs in afternoon. So far SP and DOW only ones to take out PDL, though. https://t.co/uw5945fvVN

Rising Oil, Flat Yields Hurt Banks, Boost Energy
$XLF down 9% from January while $XLE is up 23%. Banks hate rising oil and flattening yield curves. Energy loves it. Intermarket analysis tells you exactly where the stress is. https://t.co/bOfy6Vuy07
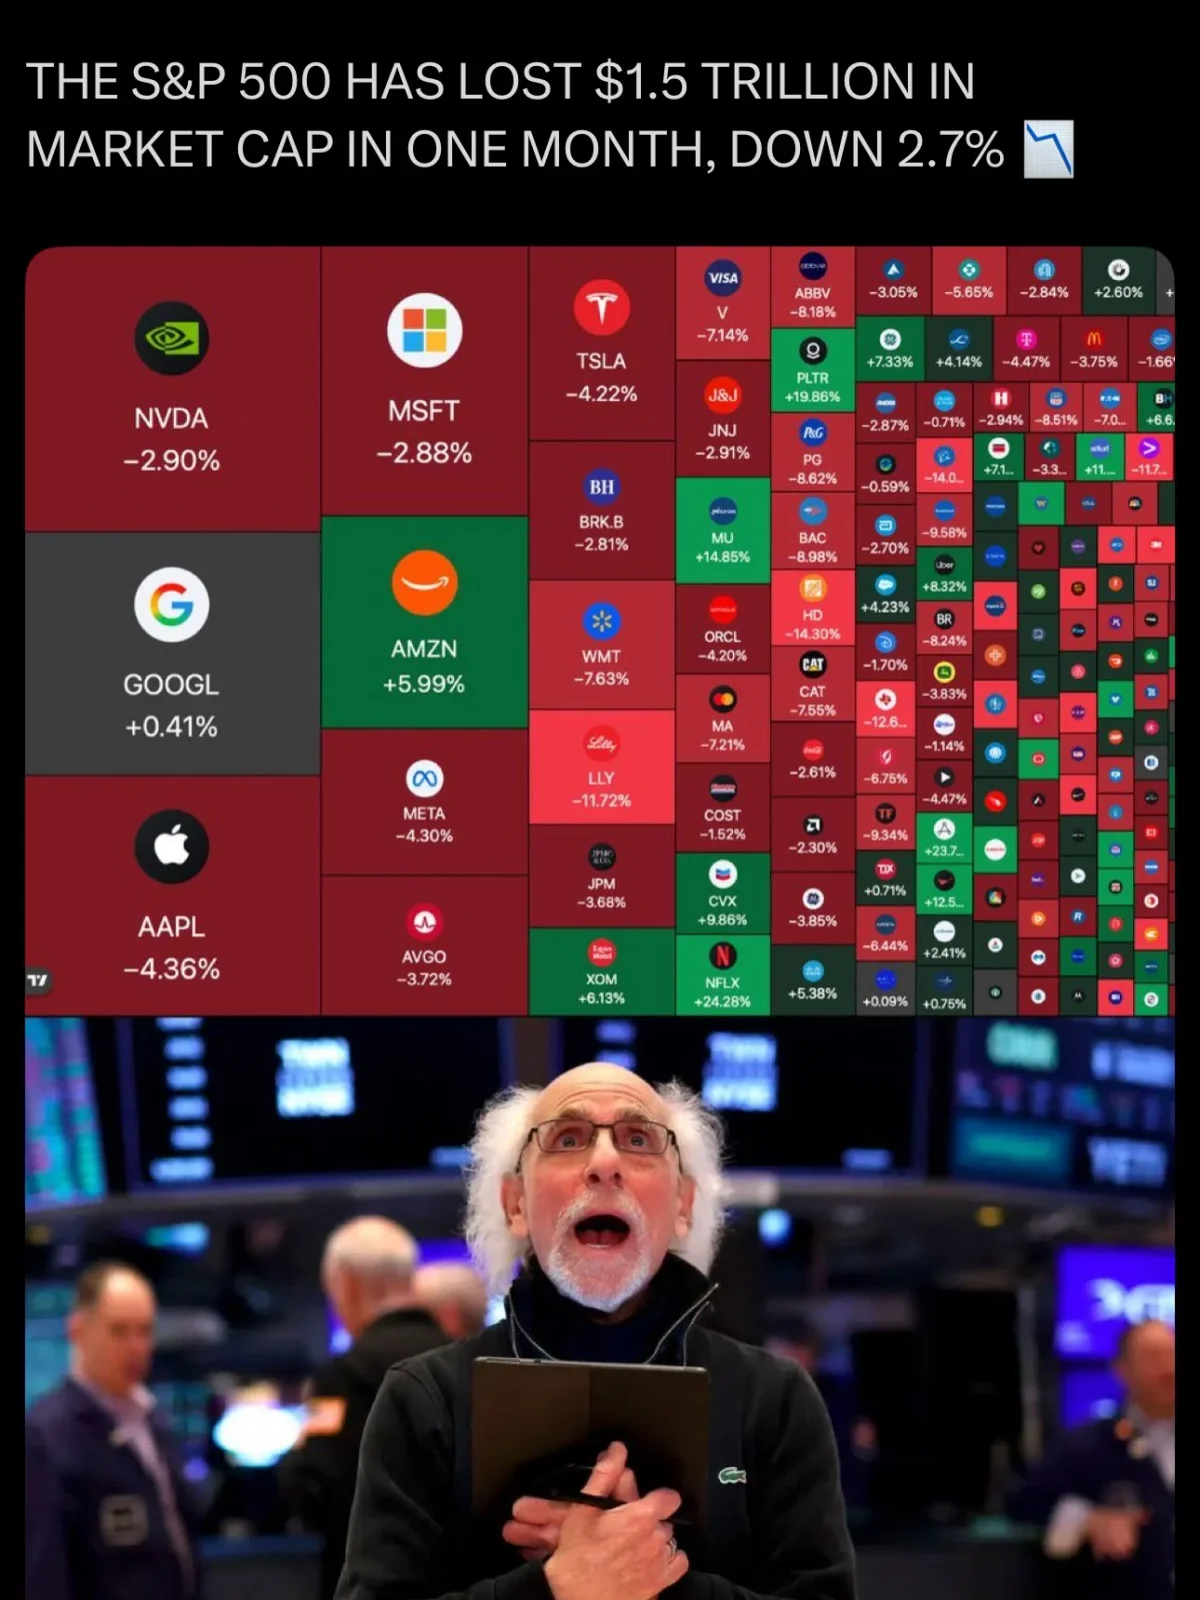
S&P Loses $1.5 T as Volatility Soars
The S&P 500 has now lost over $1.5 TRILLION in market cap within the past month, down 2.72% 😳 So far in 2026, the S&P 500 is down over 3%, while the volatility index has jumped more than 50% 📉 The story...

Live: March OPEX Analyzes FOMC, Options & Expiration Impact
Don't miss March OPEX Live, today at 4:30pm ET. Join us for a breakdown of today’s FOMC reaction, options pricing in the face of global conflict, and why Friday’s expiration could impact markets. Join us live at: https://t.co/55HHarmCC7

Stocks Tumble as PPI Spikes Beyond Forecasts
JUST IN: Stocks drop as Wholesale Inflation (PPI) comes in higher than expected (+0.7% MoM vs +0.3% forecast)

Micron Rallies 100+ Points Ahead of Earnings
$MU Daily. Up over 100 points in a little over a week, headed into earnings tonight. Micron is definition of optimistic. On a tear since Sept. 2025. https://t.co/D2r1prShVZ

Dow Gaps Down, Stays in Multi‑Week Downtrend
US equities open lower with the Dow gapping down and in turn holding to its multi-week descending channel https://t.co/ZEWi9gngsN

Early Position Management Saves Traders as SPX Swings
$spx futures from +35 to -25 It’s good to get up early and manage ur positions. $spy chart https://t.co/jgRx8rsmyg

QQQ Drops 4% After Israeli Strikes on Iranian Gas
$QQQ off 4 from pre-market high on news of Israeli strikes on Iranian gas facilities... https://t.co/CTzBR2yMse

Fed Decision Zone Signals Hedge Opportunity Near $670
📺 WHY THIS FED MOVE СOULD BE SOLD 🛑 Get my newsletter tomorrow: https://t.co/Rqp84Wg39F The market has shown short-term strength going into the Fed today. $SPY has rallied meaningfully from around $662.34 to the $674 area, a solid move given the macro backdrop...

Energy Soars, S&P Plummets: Stagflation Warning
$XLE at all-time highs. $SPY at 2026 lows. Energy up 23% since January while the S&P is down nearly 4%. This is not rotation. This is the market screaming about stagflation. https://t.co/CzWrHdP55I

Expect Fed‑Driven Volatility Spike, Real Move After 2 PM
🚨 Morning Market Rundown – March 18, 2026 🚨 Big macro day ahead — inflation + Fed decision = expect volatility spikes and potential trend shifts. This is a trader’s day, not a passenger’s day ⚡️🧠 Macro Focus: 0830 - PPI (inflation...

Scott Redler's Live Premarket Picks: NVDA, TSLA, IBIT
⏰ Scott Redler’s #630club - LIVE Premarket Stock Update ➡️ Free VIP List Newsletter: https://t.co/EW4O2nc6Yl $NVDA $TSLA $IBIT $SPY https://t.co/HVd20DAtel

Equities Poised to Rebound as Oil Steadies, Yields Dip
While Equities have been able to bounce as WTI has shown a mild rollover (and this likely continues for 2-3 more days) along w/ US Dollar, Yields pulling back, the broader pattern should still allow for an eventual push back...

Bearish Fear Peaks, Reversal Looms for AI Stocks
The "Magazine Cover" indicator has fired Positioning is bearish, extreme fear, VIX is in retreat... We are getting close to the reversal. The beaten down AI + infrastructure software stocks are coiled springs. $NDX $SPX https://t.co/AD4EpmfDLR

Bond Rally Masks Lack of True Risk Appetite
Bonds rallying while stocks bounce. $TLT up 0.8%. In a real recovery, bonds sell off as risk appetite returns. This looks like a flight to safety dressed up as a relief rally. $SPY https://t.co/azWo3xSslp
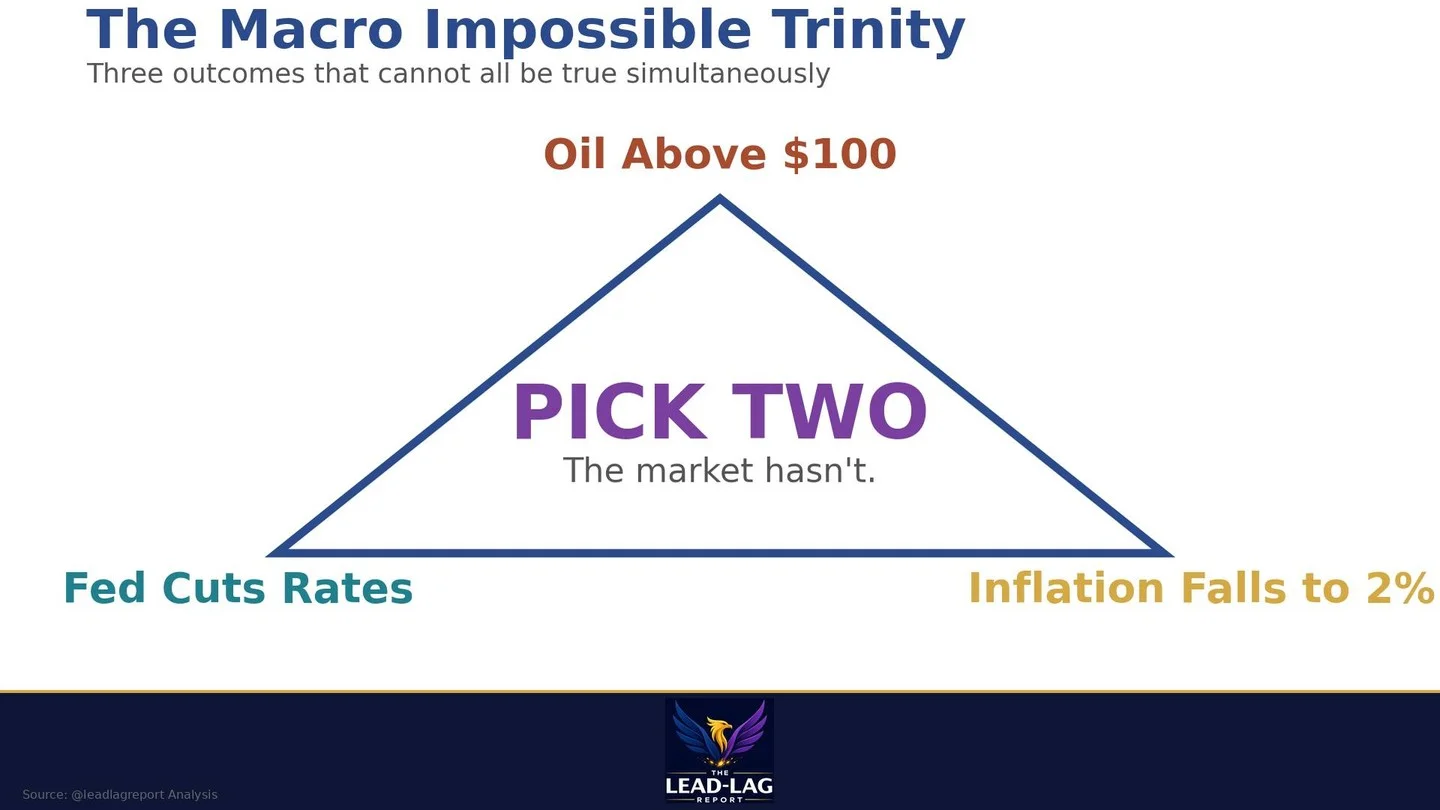
Only Two of Three Oil, Fed, Inflation Scenarios Can Occur
The market is pricing in three things simultaneously: • Oil stays above $100 • Fed cuts rates • Inflation falls to 2% You can have two. Not all three. If oil wins → stagflation. If Fed capitulates → dollar collapses. If demand craters → recession. Every...

Market Prices Impossible Trinity: Oil, Rate Cuts, Low Inflation
The impossible trinity: - Oil above $100 - Fed cuts rates - Inflation falls to 2% Pick two. The market is pricing in all three. That's the trade. $SPY $WTI https://t.co/OvC9wyNGXm

Earnings Growth Driven by One Sector, Not Broad Market
66% of S&P 500 earnings growth came from ONE sector. Strip out Information Technology and earnings growth drops from 13.2% to ~5%. Meanwhile: • The Magnificent Seven grew earnings 27% • The other 493 companies grew ~5% • AI capex is heading toward...

Labor Market Contracts Despite Positive Three‑month Average
Feb payrolls: -92K. Three-month average: +6K/month. The labor market isn't softening. It's contracting. And the Fed can't cut because oil won't let them. $SPY $TLT https://t.co/RVUtPtl388

Market Misprices Fed Cuts Amid Strong Data
PCE at 2.9%. Oil above $100. Fed rate at 3.50-3.75%. Goldman just pushed the first cut to September. The market is pricing in cuts that aren't coming. That's mispricing, not hope. $TLT https://t.co/xYBdA2JDGM

Fed Meeting’s Dot Plot Will Steer Markets This Summer
The Fed starts its most consequential meeting of the year today. Oil is above $100. The S&P 500 clings to its 200-day moving average. Wednesday's dot plot will reveal whether any rate cuts survive in 2026. The answer could set...

SPY Turns Constructive, Hits Target Above 200‑MA
$SPY getting a bit more constructive this week Sentiment washed out a bit Hit my 660 target nicely and basing type price-action above a rising 200-MA as NYMO hit extreme oversold Warned of the bearish RSI divergence into highs earlier this year, that...

Traders Bet Fed Dovish; Stocks Rise, Dollar Falls
🚨 TRADERS JUST TIPPED THEIR HAND BEFORE FED The market is already telling us what to expect from the Fed - and smart traders are paying attention. Stocks are rallying and the dollar is pulling back ahead of Wednesday's Fed decision. That's...

Nvidia's AI Boom Keeps Stock Range‑Bound; Avoid MU Earnings Risks
📺 RANGE COMPRESSION IN $NVDA, EARNINGS RISK IN $MU $NVDA raised its AI outlook to roughly $1 trillion in demand/revenue visibility through 2027, effectively doubling prior expectations and reinforcing the long-term AI bull case. Despite that, Nvidia is still range-bound and struggling...

TraderTVLIVE Returns; Nvidia Keynote Triggers Sell‑off, Oil Drags Market
After a little bit of a scare, @traderTVLIVE will be back on Youtube at 8am ready to Air. The $NVDA GTC keynote turned into sell the news while oil prices threaten to continue to give the market the blues....

Oversold Market Signals Nearing S&P 200
Historically oversold market based on the McClellan Oscillator, right as the S&P 500 hits the upward sloping 200-day MA. https://t.co/TqybXrzkXG

Key Indices Breach 5‑SMA, Then Resume Steep Declines
Rus, SP, Naz and DOW: All got look above 5 SMA, but could not hold. SP, Rus and DOW remain on extended runs DOWN. https://t.co/3ZBu6MNk9F

SPX Stabilizes; Watch for Looming Big Short
SPX $6630 hit Friday target & we bounced on cue into a 'stabilizing week' ahead of VIX expiration, MU earnings, FOMC, BOJ & month end OpEx. Even chasing $CAVA, swing long $JD & trend long $AA from live trading room. But be...

NVDA Beats Forecasts, Stock Barely Reacts, Investors Confident
The fact that Jensen guided CY27 revenue about 7% ahead of the Street, yet the stock only moved about 1% higher on the news, speaks to investors' willingness to believe. $NVDA