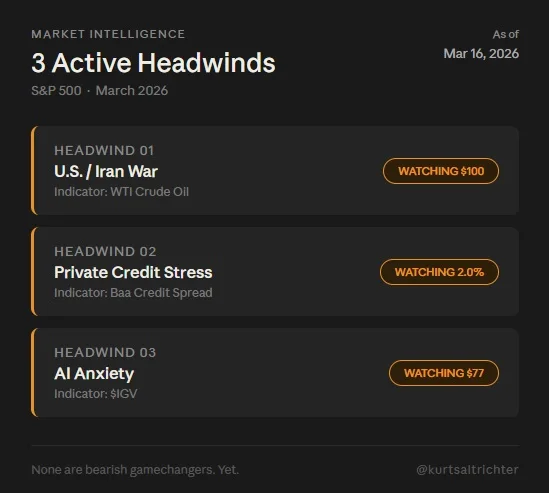
Three S&P 500 Headwinds, One Overlooked Indicator Each
The S&P 500 has 3 headwinds right now. Most investors are only watching one. Here's what all 3 are, and the single indicator for each that tells you if it's getting better or worse 🧵

Gas Hits 2023 High, Stocks Surge Anyway
Gas prices reach highest level since October 2023 as oil holds above $100 per barrel; US stocks jump https://t.co/voUmM6Kcb0

S&P's 3‑Week Drop Smallest Since 2019
S&P 500 down the past 3 weeks in a row, but down 'only' 4.01%. This is the smallest 3 week decline since October '19 (N=15). Pretty incredible if all you looked at was the headlines. https://t.co/Tzkqd8oLsv

S&P 500 Finds Support, Holds Range After Rally
S&P 500 advance/decline line pulling back to trendline support. S&P 500 index still trading in a big ol' range the past few months, as it works off the historic 40% rally after Liberation Day. Yes, the headlines are really bad, but...

Small Caps Crack First; Large Caps Soon Follow
$IWM down 9% from highs. $SPY down 5%. 400 basis points of divergence. Small caps always crack first. The question is whether large caps follow. History says yes. https://t.co/sp96ah5BoF

BDCs Lag While S&P Holds Near January Peak
The last 2 times BDCs were in a bear market (2020 & 2022), the S&P 500 was in one as well. Interesting divergence today with the S&P 500 down only 5% off its January high... Video: https://t.co/P29a0c5vMR
SPY Preps for Inflation Data and Fed Decision
$SPY levels going into the week. On the agenda: - CPI & PPI Inflation Data (Wed) - FOMC / Interest Rate Decision (Wed) - Fed Press Conference (Wed)

Energy Surges While Financials Tumble YTD
Top 3 S&P 500 Sectors YTD... 1) Energy: +29% 2) Utilities: +10% 3) Staples: +9% Bottom 3 S&P 500 Sectors YTD... 1) Financials: -11% 2) Consumer Discretionary: -7% 3) Tech: -5% Video: https://t.co/P29a0c5vMR

Avoid Shorting Open; Market Still Above Bottom
📺 DON’T RUSH TO SHORT TODAY’S MARKET OPEN — BUT THIS ISN’T THE MARKET BOTTOM YET Many traders expected a sharp selloff after Friday’s weak close to start this week. Instead, the market points to opening stronger, creating a situation where...

Vanna‑driven Rally May Thrust SPX Into the 6,800s.
It *could* be a big week for a vanna driven rally into the 6,800s. Note here how VIX spread to SPX movement (RV) often contracts around VIX exp, which is this Wed. We've unlocked the AM Founder's Note to explain our...

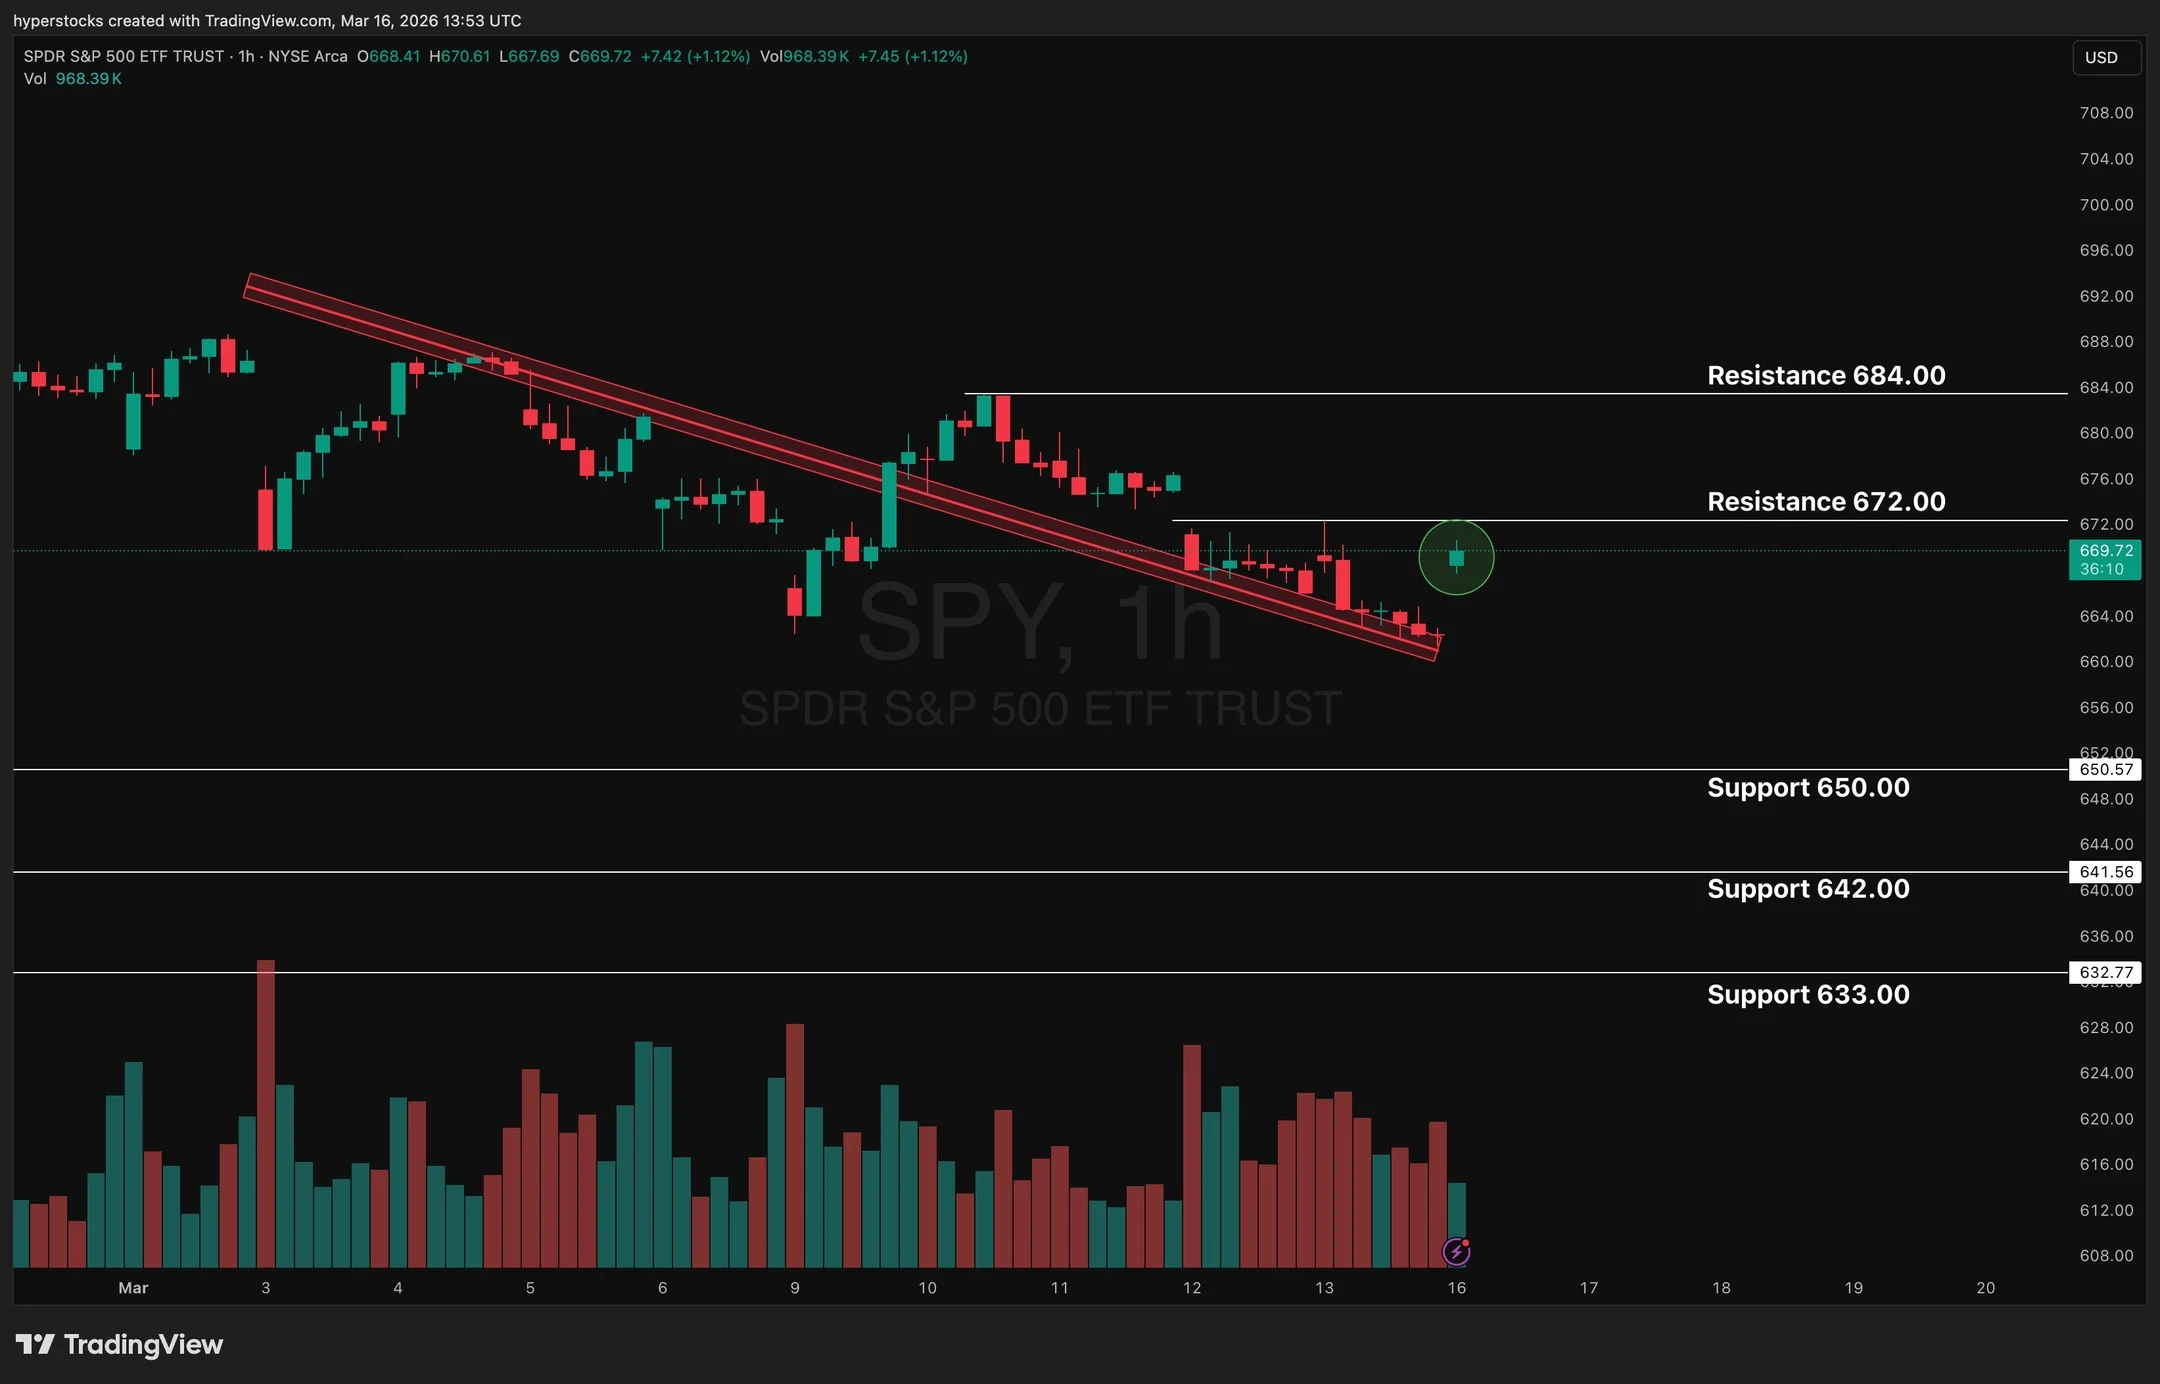
SPY Faces Resistance Near 665, Eyes 669‑671 Range
$spy daily chart as $SPX futures look+27 after the oscillator went out -52. $spy has small resistance $665ish much bigger $669-$671. Fridays pivot low $662ish https://t.co/EdvepYd8dv

Oversold Markets Signal Rebound Amid Bearish Technicals
Learnings and conclusions from this week’s charts: 1. Technically things look fairly bearish overall. 2. But recent history shows the tendency for rebounds (even during bear markets). 3. And conditions are currently looking notably oversold. 4. Yet there are some vulnerabilities being exposed in...
SPX Slides Below 3‑Month Range Amid FOMC, Iran Tensions
SPX has broken solidly below its 3-month range. This next week brings expiration dynamics and FOMC, with the backdrop of geopolitical risk from the Iran conflict. Where could this market be headed? View our weekly analysis at: https://t.co/f2As6iRdoD

S&P 500 Logs 32nd 5% Pullback Since 2009
The S&P 500 is down 5.4% from its Jan 28 peak, the 32nd pullback >5% since the March 2009 low. Video: https://t.co/P29a0c5vMR

Magnificent Seven All Down, Lagging S&P 500
All 7 members of the Magnificent Seven are down on the year and underperforming the S&P 500. Video: https://t.co/P29a0c5vMR

Equities Near Bottom, Expect Weakness Then Reversal
Positioning suggests equities likely near a bottom... Weakness early next week followed by a reversal? Chart @SubuTrade https://t.co/u7fpaG36eG
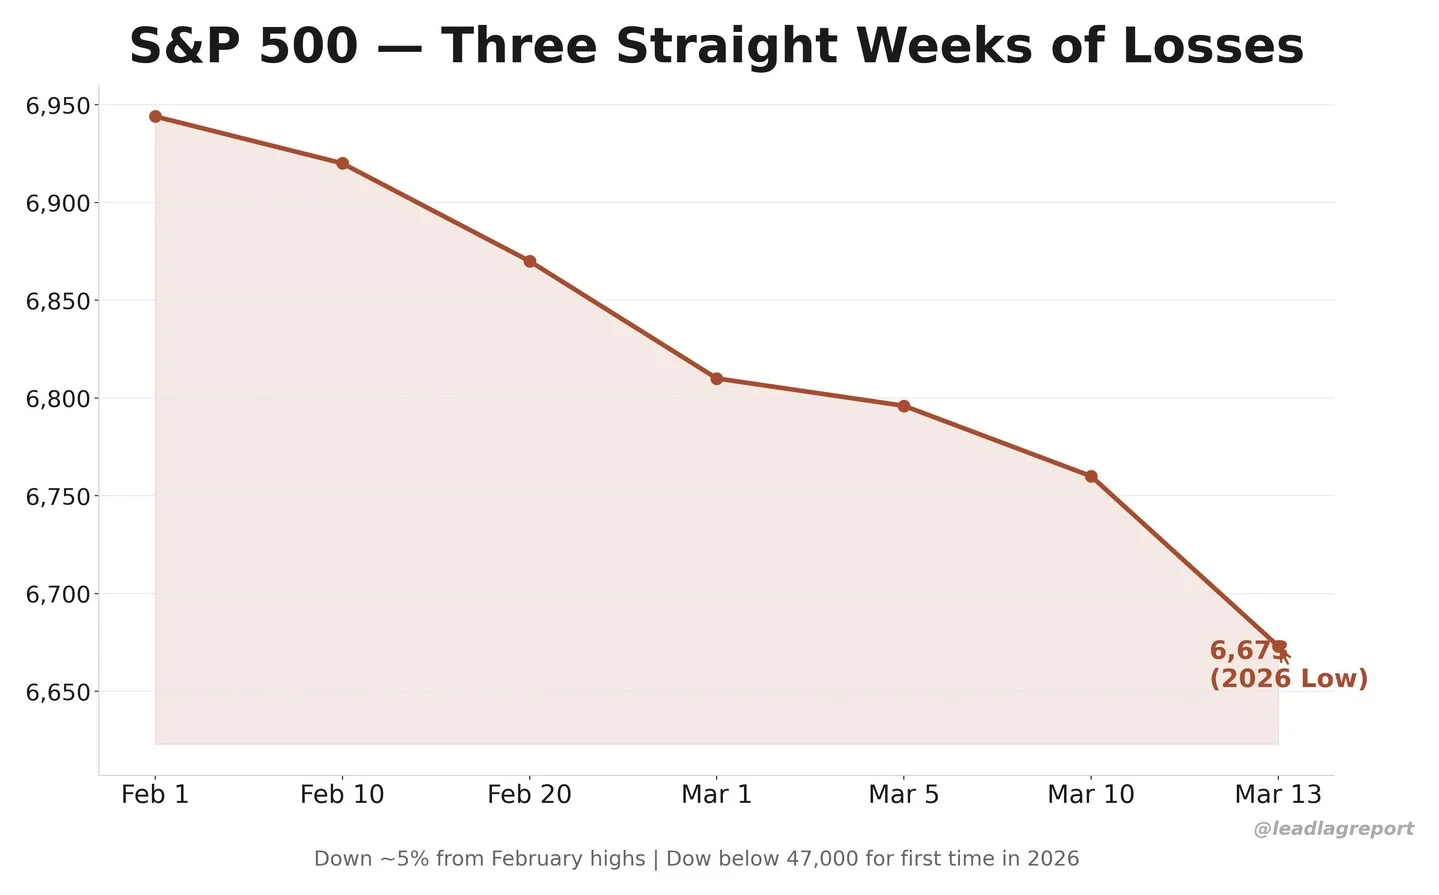
Market's Slow Grind Tests Patience, Not a Crash
Dow below 47K. S&P at 2026 lows. Three straight weekly losses. What concerns me isn't the level — it's the character. This isn't a crash. It's a slow grind lower that constantly tempts you to buy too early. The 2008 decline took...

Markets Grind Lower; Dip‑buyers Run Out of Bargains
Dow below 47K. S&P at 2026 lows. Three straight weeks of losses. The "buy the dip" crowd is running out of dips to buy. This is what repricing looks like. Slow. Grinding. Relentless. $DIA https://t.co/n4HR4uNcCX

Berkshire Hathaway Resumes Buyback, Purchases $226M of Shares
Berkshire Hathaway bought back the equivalent of 309 $BRK.A shares (~$226 million worth), on March 4th, the day it resumed it stock buyback program for the first time since May 2024 - CNBC

Risk‑Off Signals Rise, Yet Core Market Levels Hold
Today felt like a textbook risk-off session. Weak GDP revision. VIX back above 20. Short-term breadth rolling over. Dollar up. Rates pushing toward 4.3%. Oil surging. In CHART THIS I walk through what’s actually changing — and what isn’t. Six viewer questions. Clear levels. No drama. Watch...
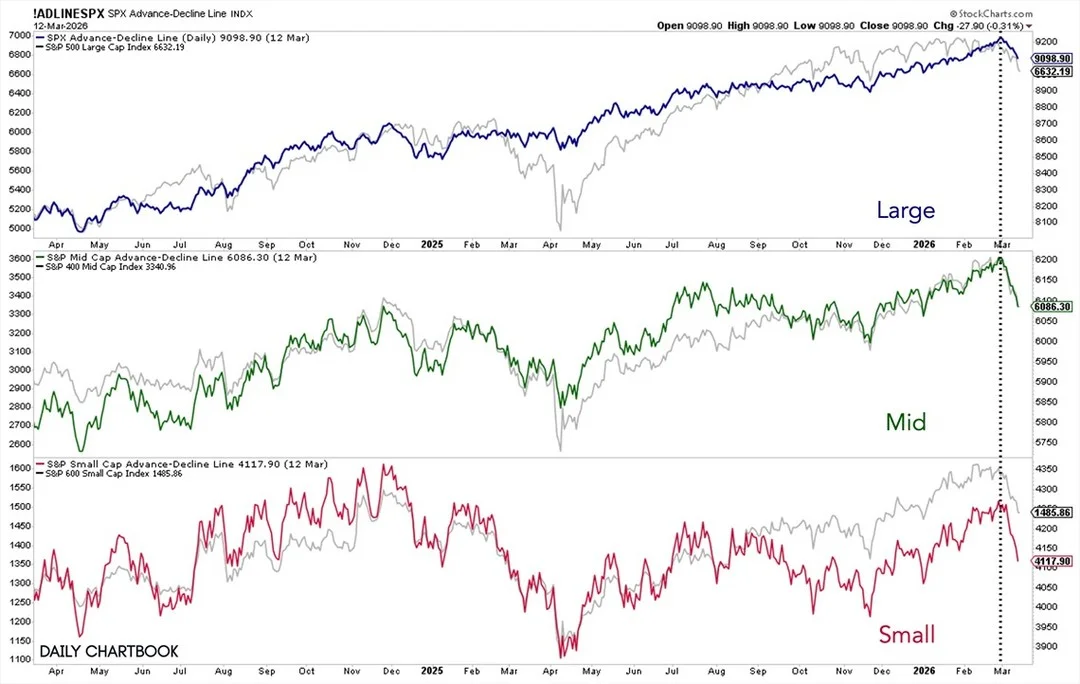
US‑Iran Conflict Slashes Market Breadth Across All Caps
Since the start of the US-Iran war, breadth has deteriorated sharply across large, mid, and small caps.

Oil Shocks Lift Risk Premiums, Weaken Markets, Curb Inflation
Risk premium rising across equities and credit while intraday correlation between oil and equities around -80%. Oil shocks push the tide out and expose underlying weak links. The peak in oil in June 2022 explained the first low in markets...
Q4 GDP Halved, Inflation Rises: Stagflation Hits Markets
The number Wall Street was dreading arrived today. Q4 GDP was revised down to 0.7% — literally half the initial reading — while core PCE inflation climbed to 3.1%, its highest since early 2024. The S&P 500 responded by hitting...

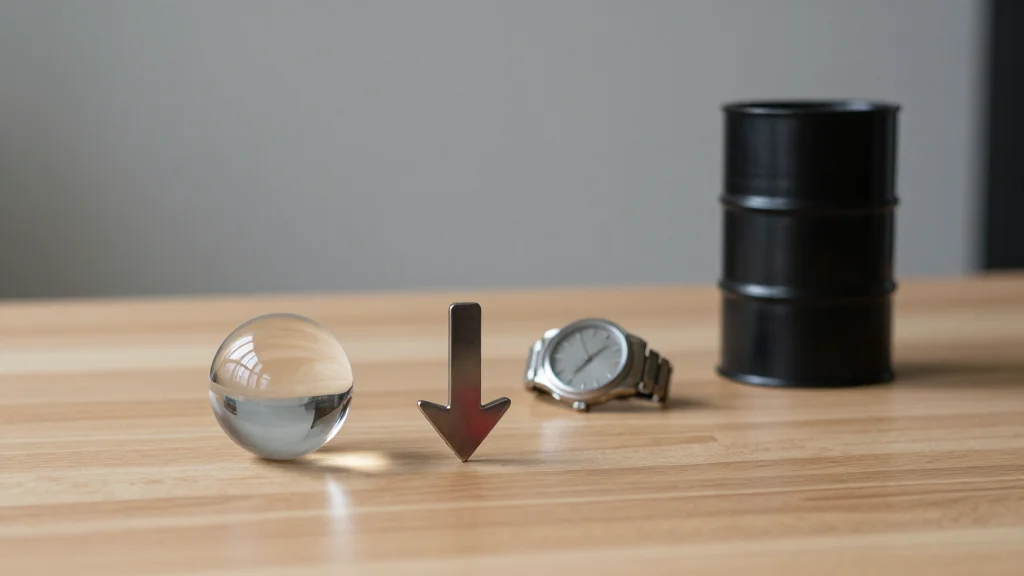
Oil Prices Dictate Yields and SPX Until $
Oil = 10yr = -SPX 1 variable market continued for another week and will likely persist until oil drops back below ~$70 when the Strait is back in business. https://t.co/349BroE6sP

Markets Enter Regime Change, Not Crash, Amid Slow Repricing
$SPY at 2026 lows. Dow below 47K. The "buy the dip" crowd has gone very quiet. This is what a regime change looks like. Not a crash. Just a slow, grinding repricing of risk. https://t.co/p01B1V5aNG

Energy Surge Splits Market as SPY Hits 2026 Lows
Energy stocks at all-time highs. $SPY at 2026 lows. Chevron, Marathon, Valero ripping. Everything else bleeding. This is not a market. It's two separate markets wearing one coat. https://t.co/yJjS0g4dAU

SPX's VIX Sensitivity Drops to Unsettling Low
Beta of SPX to 1pt chg in the VIX has fallen to uncomfortable levels. Opposite in many ways to Volmaggedon where VIX was at depressed levels, but SPX showing almost no response to implied vol changes. https://t.co/zaPe03rueo

Rising Oil, Yields, Dollar Boost Crash Risk Ahead of OpEx
Market Crash Risk Odds Have Increased $SPX $VIX #crudeoil #10Y #USD All eyes on rising oil, yields & dollar... for increased pressure on equities... before or after OpEx is the big question... https://t.co/fgfY8OJ2nm

S&P Rebounds From Low, Eyes 6740 Resistance Amid Hawkish Fed
$SPX hit a 6636 low Monday and bounced to 6670, and now we’ll see if early strength holds or fades with 6740ish as resistance. #FOMC is the next move as the Fed turned more hawkish with inflation and higher...

Markets Stay Resilient Despite Global Turmoil and Rising Yields
War in Iran Oil up nearly 70% YTD Software stocks crashed Private credit imploding Legit chance of no cuts this year Inflation set to surge Yields globally moving higher S&P 500 down only 2.5% this year
Oil Spike Meets Credit Freeze, Market Stressed
Two different crises hit the market on the same day Thursday. Brent crude closed above $100 for the first time since August 2022. And four of Wall Street's biggest fund managers — Morgan Stanley, BlackRock, Blackstone, and Blue Owl —...
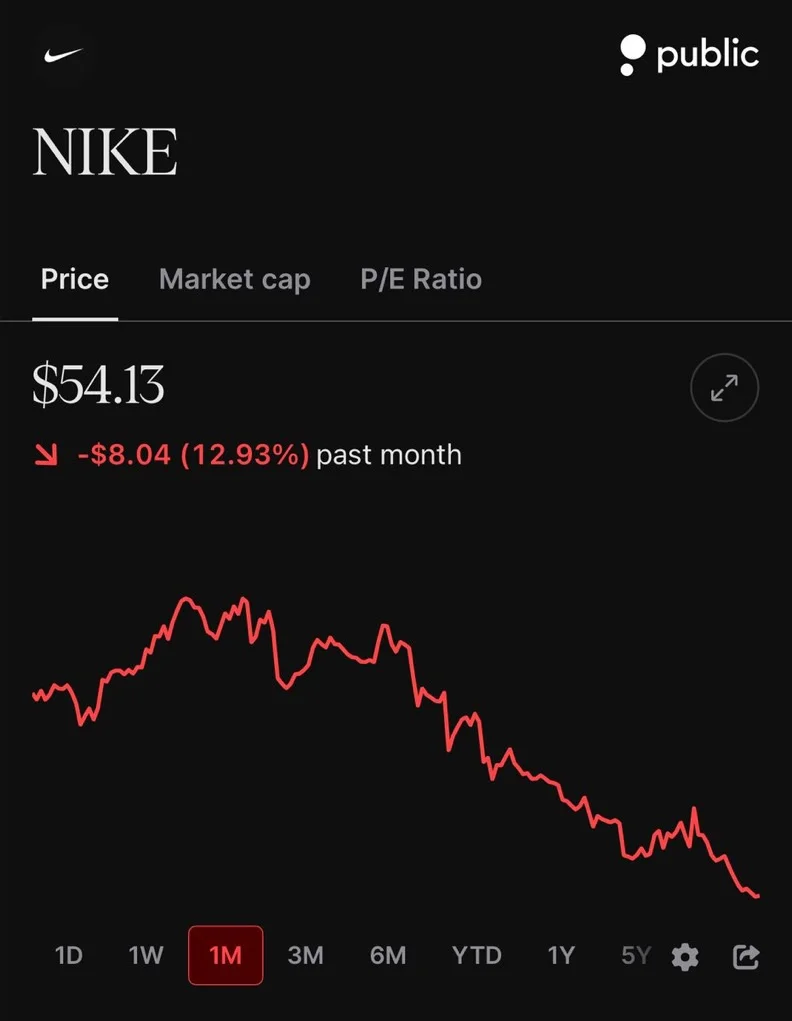
Nike Shares Slide Ten Days Straight
Nike $NKE stock has now closed lower for the last 10 trading days in a row

CF Industries Leads SPX, Bet on 2026 Food Prices
CF Industries $CF was the strongest outperformer today within $SPX and it continues to be right to favor Agriculture & food prices in 2026 @IBDinvestors @marketsurge I added one of its competitors to UPTICKS for my early March addition and while...

Everything Plummets: Crypto Crashes Harder than Stocks
% Below All-Time High Chevron: 0% S&P 500: -5% Gold: -9% Apple: -11% Google: -13% Nvidia: -14% Amazon: -19% Meta: -20% Tesla: -21% Palantir: -26% Microsoft: -27% Netflix: -30% Bitcoin: -44% Ethereum: -58% MicroStrategy: -75% Fartcoin: -94% Trump Coin: -96% Melania Coin: -99%

S&P 500 Sheds $800B, Down $2.5T Monthly
MARKET RECAP 📉 What a day, the S&P 500 lost over $800 BILLION in market cap today. The index is now down 4% in a month, losing $2.5 TRILLION 😳 What the heck is going on?!? Let’s talk about it 🗣️
S&P 500 Drops 1.5%, Erasing $1 Trillion; Crypto Steadies
NEW: The S&P 500 fell 1.5% today, erasing nearly $1 trillion in value Crypto held mostly unchanged

S&P Dips Below Dec Low: Historically Weak Returns
The S&P 500 just closed beneath the December low in the Q1. 38 times this happened and 38 times it didn't. When it breaks (like this year) the avg full yr return is 0.2% and up only 50% of time versus 18.9%...
S&P 500 Dips Below 170‑day Average, First Since May
The S&P 500 closed below its 170-day moving average for the first time since May.

S&P
$SPX - We are getting a lower low after all. Going back to the April low, we've had a ~80 trading day cycle. Due to many holidays in this cycle, I expect this cycle to be shorter in trading days...

S&P 500 Hits Year’s Worst Close, Down 4.5%
S&P 500's worst close of the year... lowest since late November -4.5% from the January record high https://t.co/kASRYfc9MR

SPX Extends 7-Day Run Below Trading Box
$SPX has traded below the latest trading box for 7 straight days. Only closed below it twice. Today would be the 3rd. https://t.co/gYeIND2TmK

Quarter of US Stocks Hit 52‑week Highs Today
There's actually a pretty decent list of S&P 500 52wk highs... bunch of food/ag, chemicals, refiners @stockcharts 1-in-4ish US stocks are up today https://t.co/ebgPXxwKyU

Nasdaq 100 Approaches 200‑Day SMA, 2nd Small
The Nasdaq 100 is staring down its 200-day SMA just like the Dow and S&P 500. Notably, the index is sporting its 2nd smallest 6-month range (as a percentage of spot) on record: https://t.co/D3FuDpSJFh

AAPL Misses Expectations, Slides to $254 Key Level
I thought $aapl would act better this morning. It didn’t. Hurt a bit. $254 a key level now
Protection Costs Surge Despite Modest S&P Gains
Wow. The cost for protection is nearly off the charts. Feels extreme given S&P 500 is about 4% from new ATHs. Nice one from @MacroCharts
SPY Slides Below $669, Hits Weekly Low
$spy failed it reclaim $673 and now below $669.50. See if it stays below. Fast tape. $662ish is low of the week

Market Ignores Good News, Flags Geopolitical Risk
Today the market got exactly what it wanted: inflation right on target at 2.4%. And it still fell. Oil surged 7% to $89.50. Ships were struck near the Strait of Hormuz. The FBI warned about Iranian drone attacks on U.S....

SPX Forms Multi‑Week Descending Channel Amid Bull Trend
What would you say the prevailing trend is for the $SPX? That is a question of time frame of course, but there is a multi-week descending trend channel tentatively forming against the larger bull trend from last April's Liberation Day tariff...

S&P 500 Stalls
$SPX -0.08% and closes smack-dab in the middle of its intra-day range. Was it a failure to go up or an inability to go down?

Rising Yields Signal Dollar Surge, Growth De‑Risking Continues
Bonds fall on growth fears and rise on recession fears - as a rule of thumb. But that’s under monetary dominance, not fiscal dominance. The new rulebook will look very much like February into the April tariff terror event where dollar and bonds...