Know What's Happening in Stock Trading
Know What's Happening in Stock Trading

USD/JPY poised for breakout toward 170 as safe‑haven demand spikes
USD/JPY lingered around the 160.00 level last week, buoyed by safe‑haven demand amid the escalating Iran‑U.S. conflict. The Elliott Wave count points to a potential move toward the 170.00 resistance, with broader market dynamics such as rising oil prices and ECB policy discussions influencing the pair.

Qantas Airways’ shares plunged more than 10% to A$8.92, their lowest level in ten months, after the United States and Israel launched large‑scale strikes on Iran, sending oil prices sharply higher. The geopolitical flare‑up forced the closure of key Middle Eastern hubs such as Dubai and Doha, disrupting thousands of flights and stranding tens of thousands of passengers. The market reaction spread to other regional carriers, with Virgin Australia briefly falling 3.5% before rebounding and Air New Zealand slipping 0.5%. The episode underscores the sensitivity of airline equities to geopolitical shocks and energy price volatility.
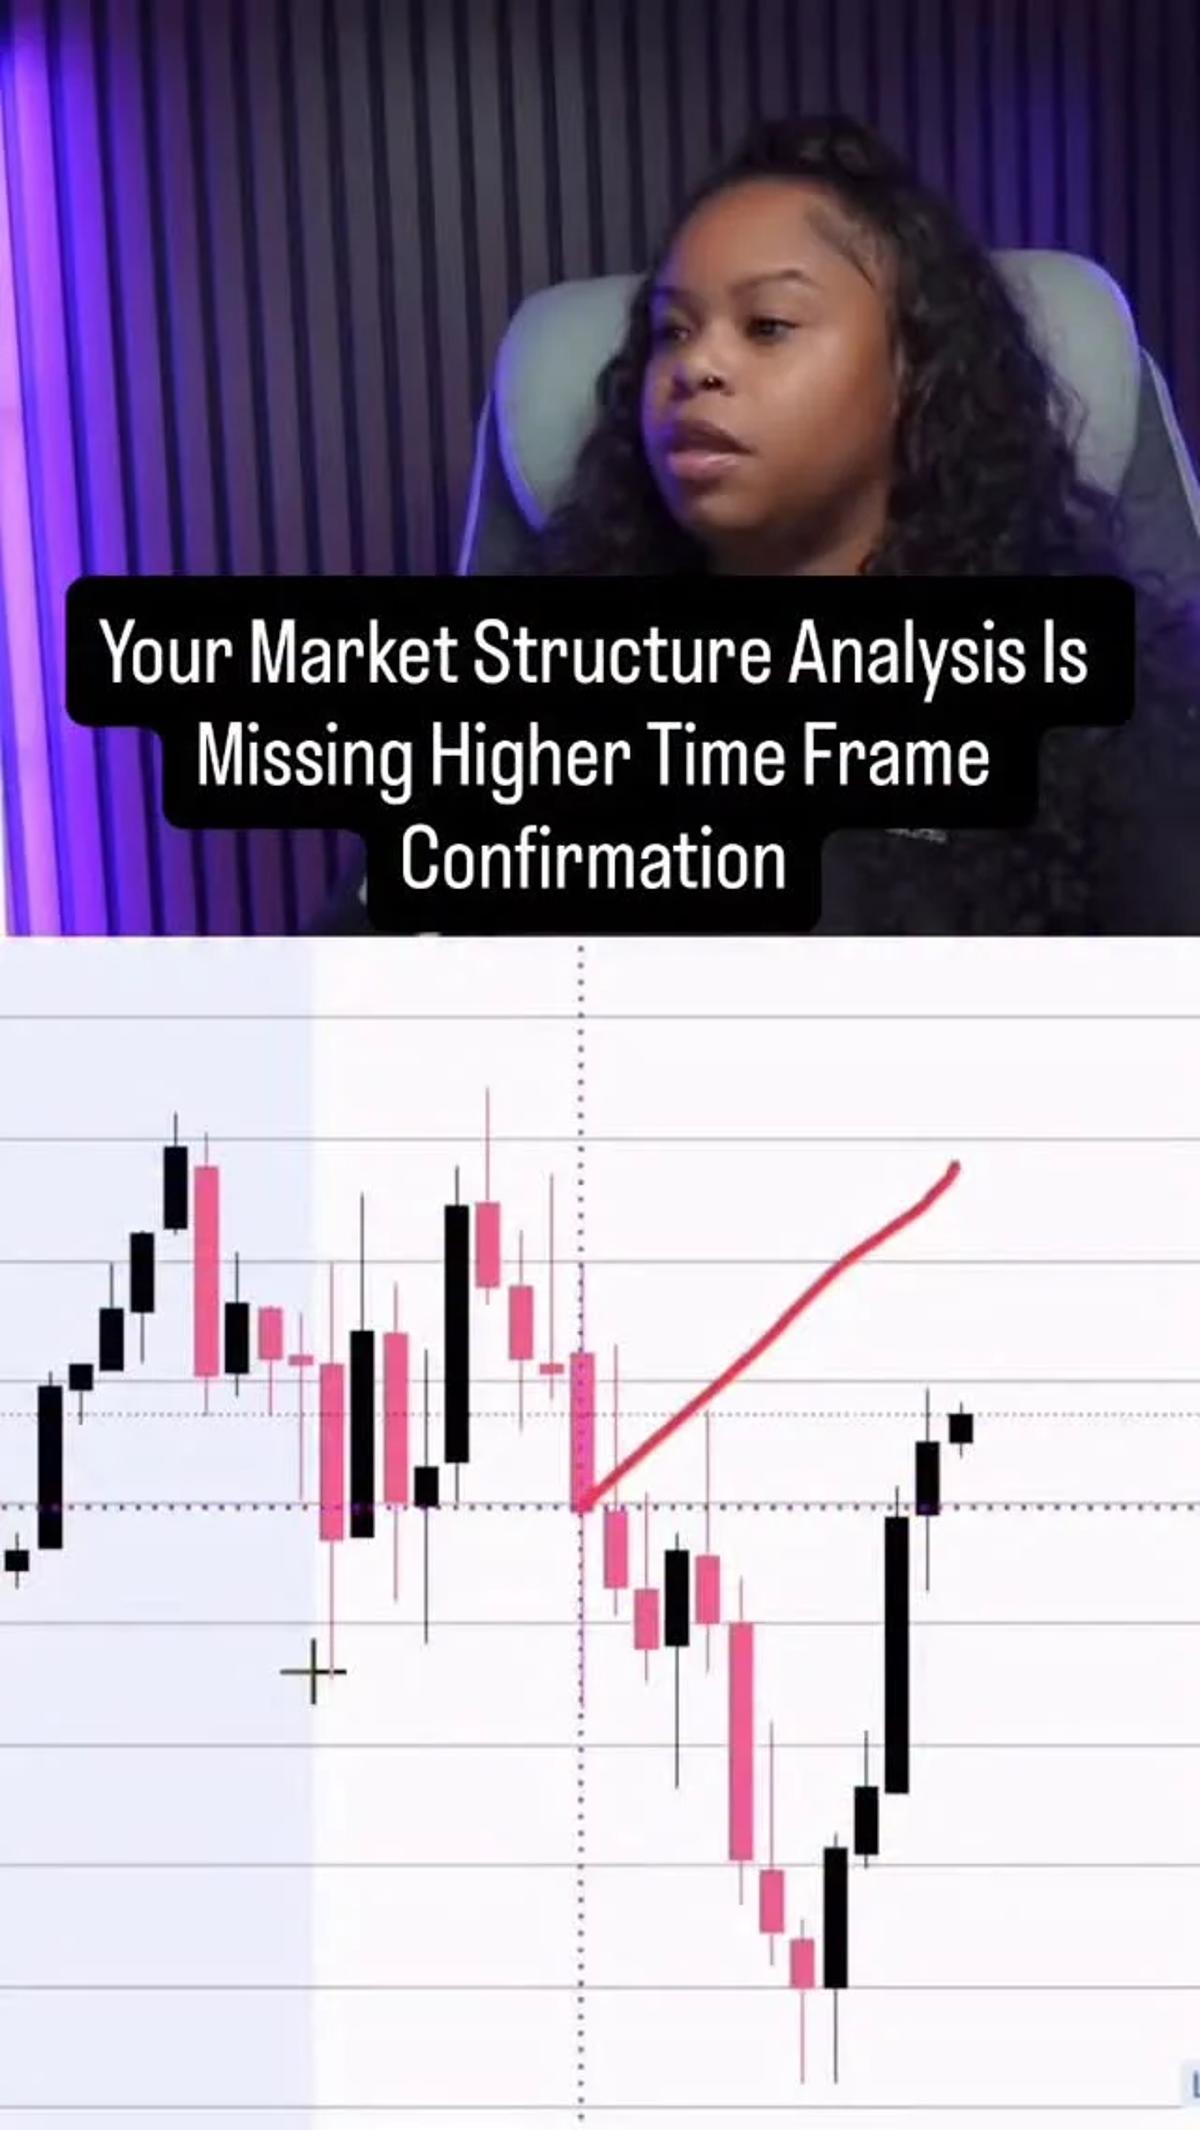
Most traders lose because they trade the lower time frame first. You saw the sell off and wanted to short it. But on the hourly chart, price was sitting at a key gap level. That higher time frame support mattered. Drop down and...

🔴US market short interest is SURGING: Median S&P 500 stock short interest is up to 2.7% of market cap, the highest in at least 10 years, according to Goldman Sachs. The top 10% most shorted stocks now have 7% of their market...

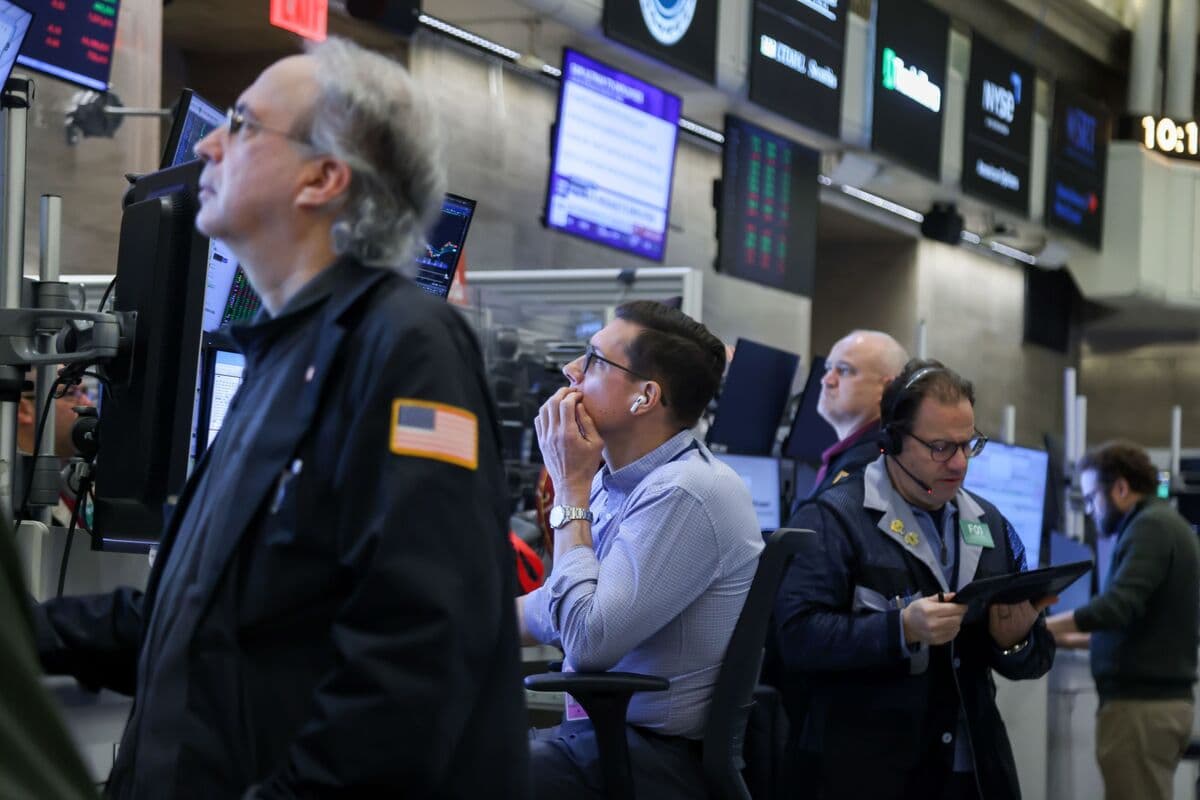
Global equities fell sharply on March 1 as the Iran crisis escalated, with Asian shares dropping 1.6% and U.S. and European futures slipping over 1% and 1.7% respectively. The heightened geopolitical risk pushed investors toward safe‑haven assets, lifting the U.S....

Thoughts? The Iran war and oil crisis affect your money across four key areas: oil prices and inflation, stock market volatility, cryptocurrency movements, and overlooked opportunities in uranium and energy security stocks.

GOLD & SPX TRADES UPDATE: Booked profits right at the weekly open in anticipation of gap fills on both & middle east tensions holding lesser impact than everyone's fearing. On SPX , i am leaning neutral to slightly bearish , not much...

Price Action Lab’s weekly market report shows its tactical ensemble (WRE) posted a modest 0.1% gain for the week ending Feb 27, 2026, while the benchmark SPY fell 0.5%. Year‑to‑date, the unleveraged WRE is up 4.3% and its 1.6× leveraged version 6.9%,...
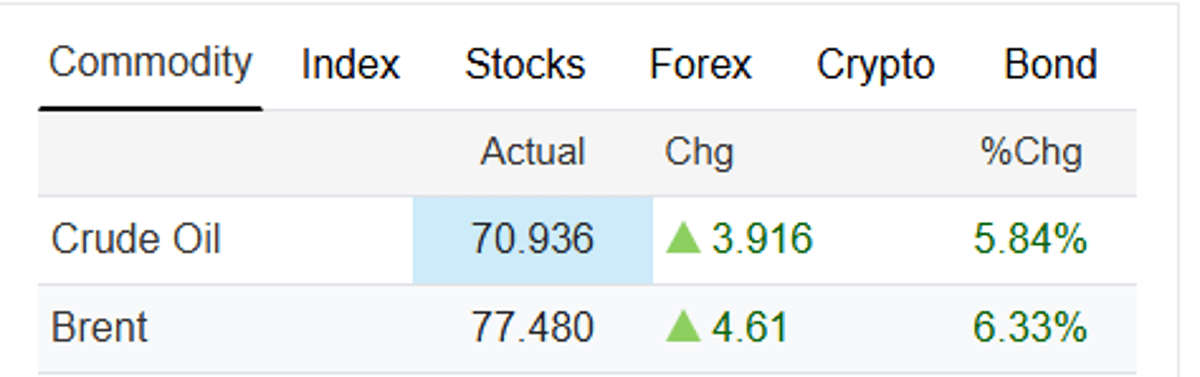
Oil has given back about half of the gap higher.. but where will it be tomorrow morning? CL, Brent +6% https://t.co/xc6c5bVP1V

Good time to dust off the Chart of Fears. Yes, what is happening now is confusing and scary. But we've seen many other times like this and stocks have always moved from bottom left to upper right. https://t.co/H9xMLrLKC1

ProShares UltraPro Short S&P 500 ETF (SPXU) delivers –3X daily exposure to the S&P 500, attracting short‑term traders seeking inverse market bets. The fund manages about $489 million in assets and sees roughly $284 million in average daily trading volume. SPXU is prone to...

Further to the prior post: A classic initial market reaction to this weekend’s eruption of military conflict in the Middle East: Oil has surged over 10%, the Dollar has strengthened, and Dow futures have opened down some 500 points. #economy #markets #oil...

Markets are back in crisis mode with the US–Israel strikes on Iran dominating headlines: global risk assets are reacting, oil prices are spiking, and S&P volatility is alive. Join us LIVE at 6pm EST as we break down how ES futures...

European Central Bank Governing Council member Joachim Nagel warned that confidence in the U.S. dollar’s safe‑haven status is waning. He noted that recent market turbulence has led international investors to question the dollar’s reliability, contributing to its ongoing weakness. Nagel...

🚨 I stopped losing money when I learned this one concept: Failed signals are the BEST signals. 🔄 Buy signal dies? Wait for the candle to close through the low. Go short. 📉 Sell signal dies? Wait for the candle to close through...

4 out of 5 signals nailed in NQ Friday 🔥 Balanced market. Flat VWAP. Clean rotations between deviation bands. But this week? Volatility expanding = continuation setups likely take over. Comment VWAP and I’ll send you the free Discord link 👇 #vwap #futurestrading #tradingstrategy
Traders are gearing up for a surge in zero‑day options (0DTE) on major tech names as the broader equity rally loses steam. Sector rotations have flattened S&P 500 gains for the year, and the close of earnings season has heightened...
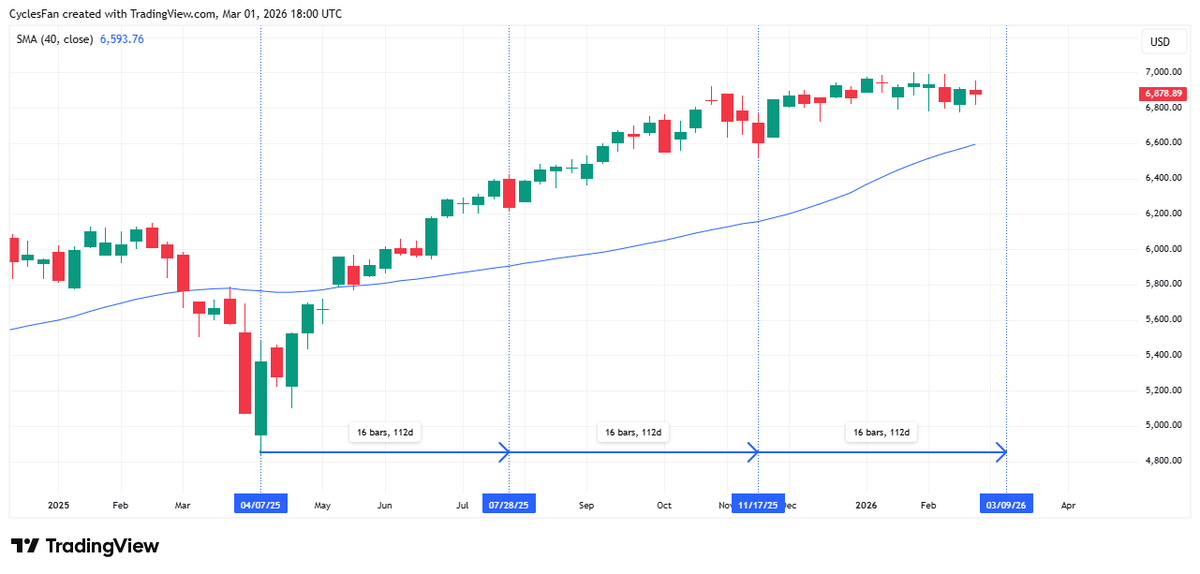
$SPX - The next 16 week cycle low is due in the 2nd week of March(March 9-13). In my opinion it's unlikely to drop to the November low at 6522. The probable target is the 40 week MA that closed...

🚨 UPDATE: On February 2nd I told you to buy OIH and XLE. Since then: OIH: +14% XLE: +10% Crude oil: 7-month highs And in my opinion, we’re just getting started. Here’s why I’m not selling yet:
Gold closed Friday at $5,278. The all-time high is $5,595. That's $317 away. The US and Israel just launched strikes on Iran. Tehran is retaliating. Iran vows to shut down the Strait of Hormuz. This is the biggest safe haven trigger since 2020. Fib extension...

Goldman Sachs down 7.5% in a single day. From $985 to $860 in three months. Meanwhile, a UK mortgage lender just collapsed. Private credit contagion is spreading across the Atlantic. This isn’t a correction. It’s a credit event hiding in plain sight.
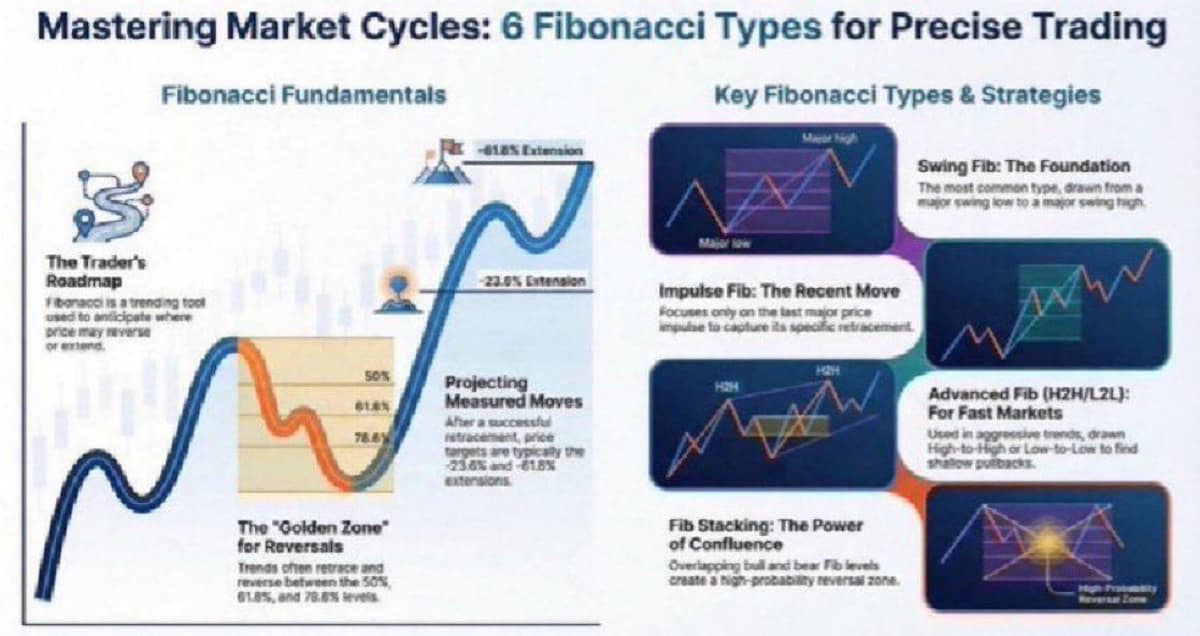
Here’s a link below to a FREE Fibonacci Trading Strategy Guide (ebook): 📈📉 Learn the 6 Fibonacci Pattern Types that Create the Most Precise Price Levels, Targets, and Reversal Zones for traders. Click here: ⬇️ https://t.co/62UAf4L9jv Discover the 5 types that aren't...
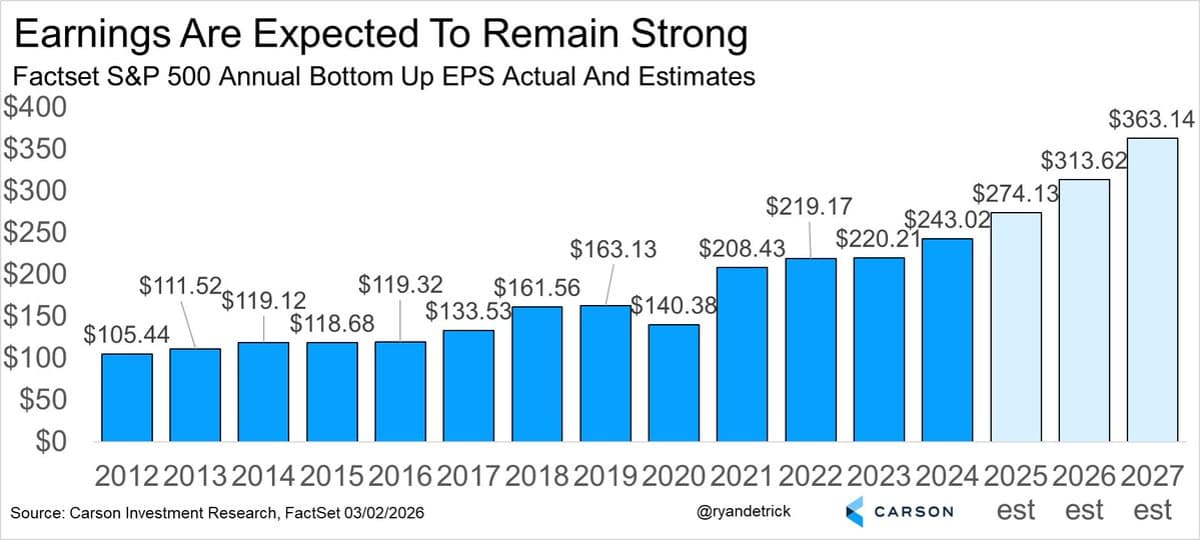
2027 EPS up another couple bucks the past two weeks. Yes, the headlines are scary, but this is why this bull market is alive and well. https://t.co/G1hArdVPz9
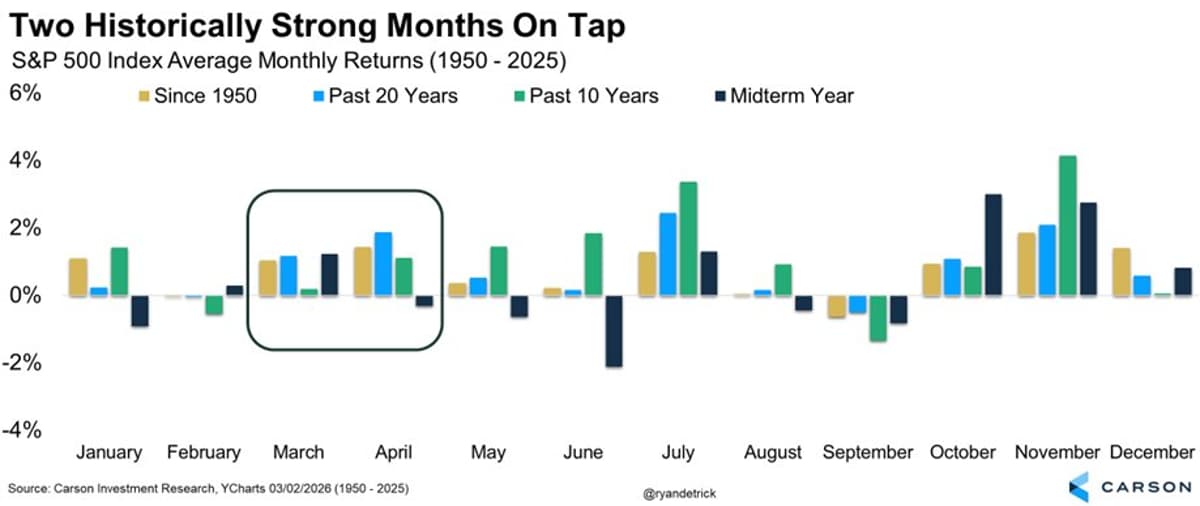
AAII bears>bulls two weeks in a row NAAIM lowest since May '25 Historic shorts on software 10-day equity put/call ratio highest since after Liberation Day Record equity outflows from institutions One of smallest ranges to a year ever Now here's two of the better months on...

Update from the set. Brent up 9%, prices up across the futures curve. Gold up by about $120/ounce, also up across the curve https://t.co/UX9X5ChFfK
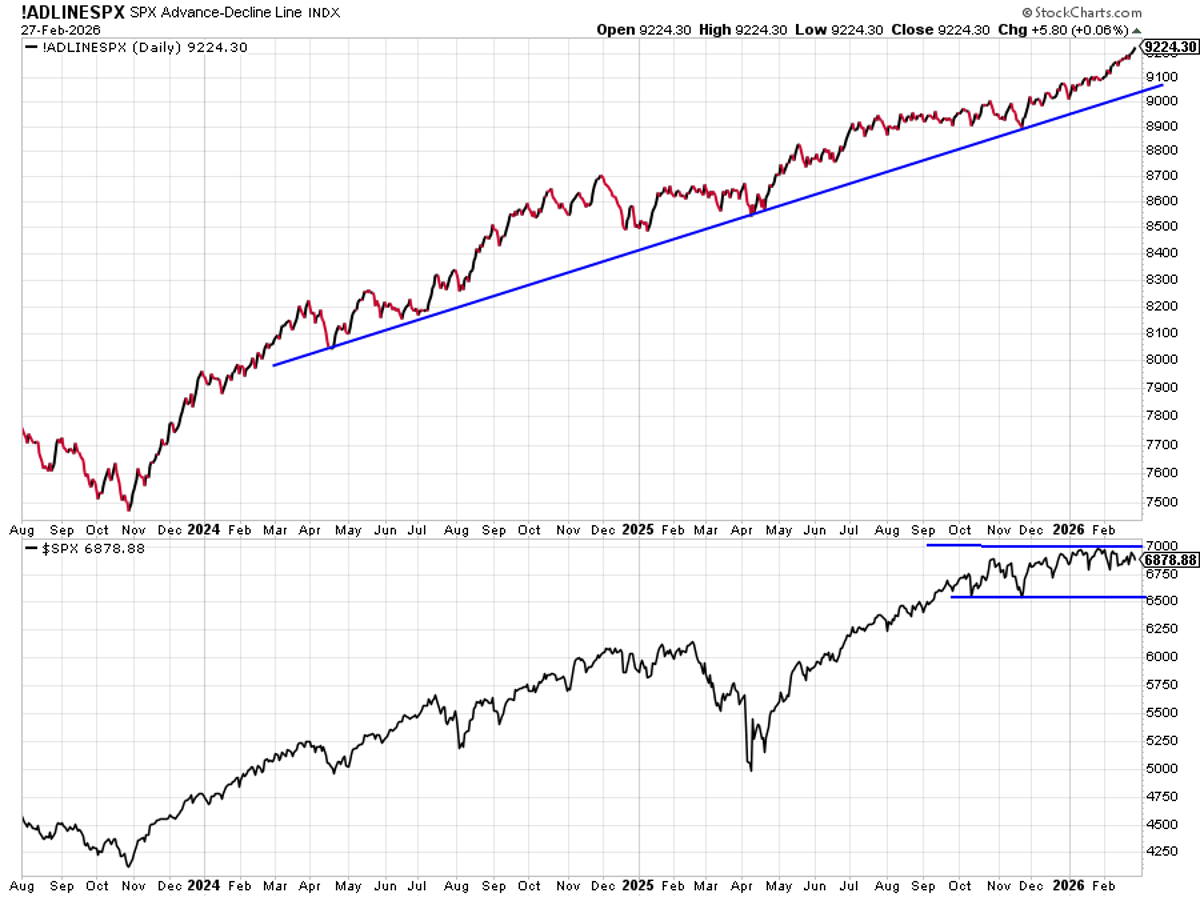
The S&P 500's advance/decline line hit a new high on Friday. I'm pretty old fashioned, but I still think that is a good sign. https://t.co/6slLIZINHZ
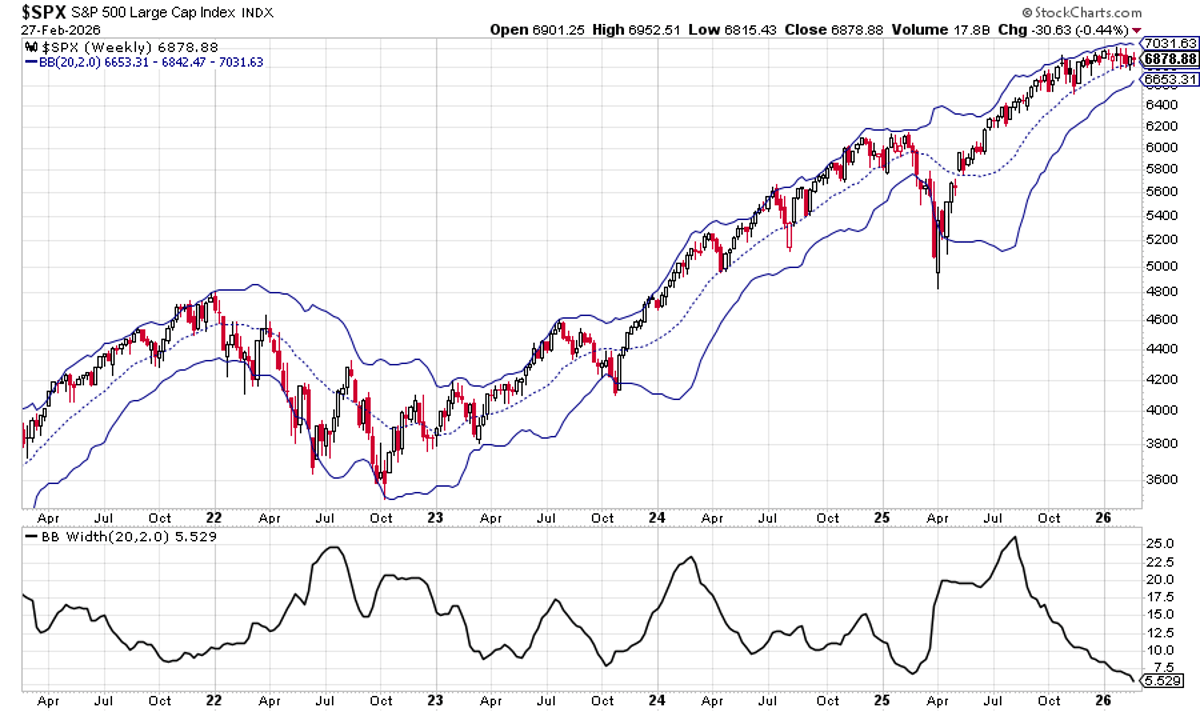
Futures open down only 1% for the S&P 500. Bollinger Bands are about as tight as they've been in years. The spring is coiling. How many think it'll be volatility to the upside? https://t.co/QMWz06txWk
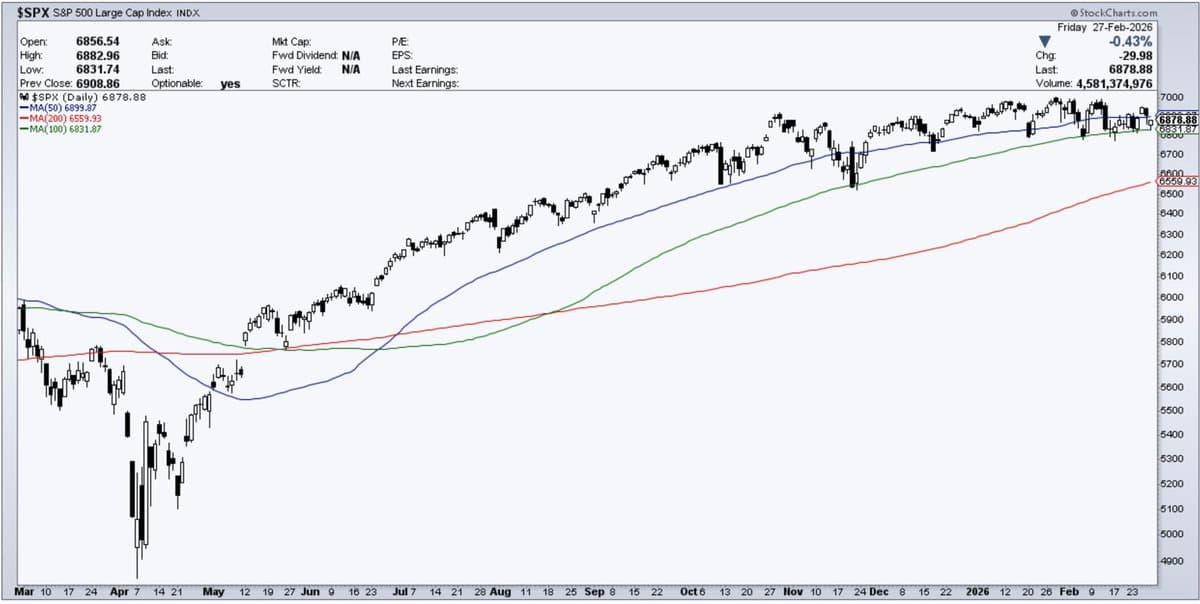
S&P 500 had been holding the 100-day moving average. That level 6831 now. Futures down 1% at 6815. Let’s see if we get a close below there. https://t.co/rCkhL5PUZi
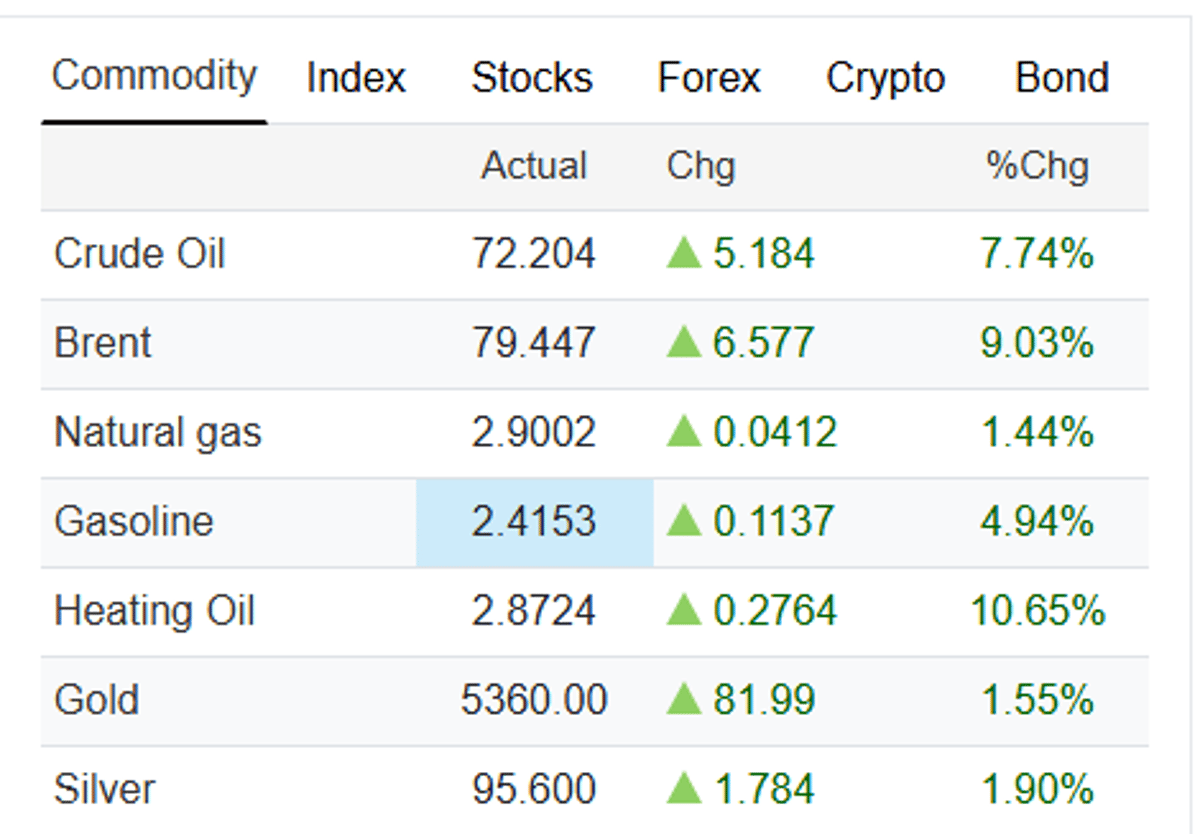
Brent crude oil +9% to $79 WTI crude oil +8% to $72 RBOB gasoline futures +5% to $2.42 https://t.co/Z7uoT3rHYZ

Early market signals Monday in Asia: risk aversion & flight to safe havens, stocks set to open down. Oil and gold come online in 20 minutes, both will see substantial upside. Update then https://t.co/IwRjfptbHJ
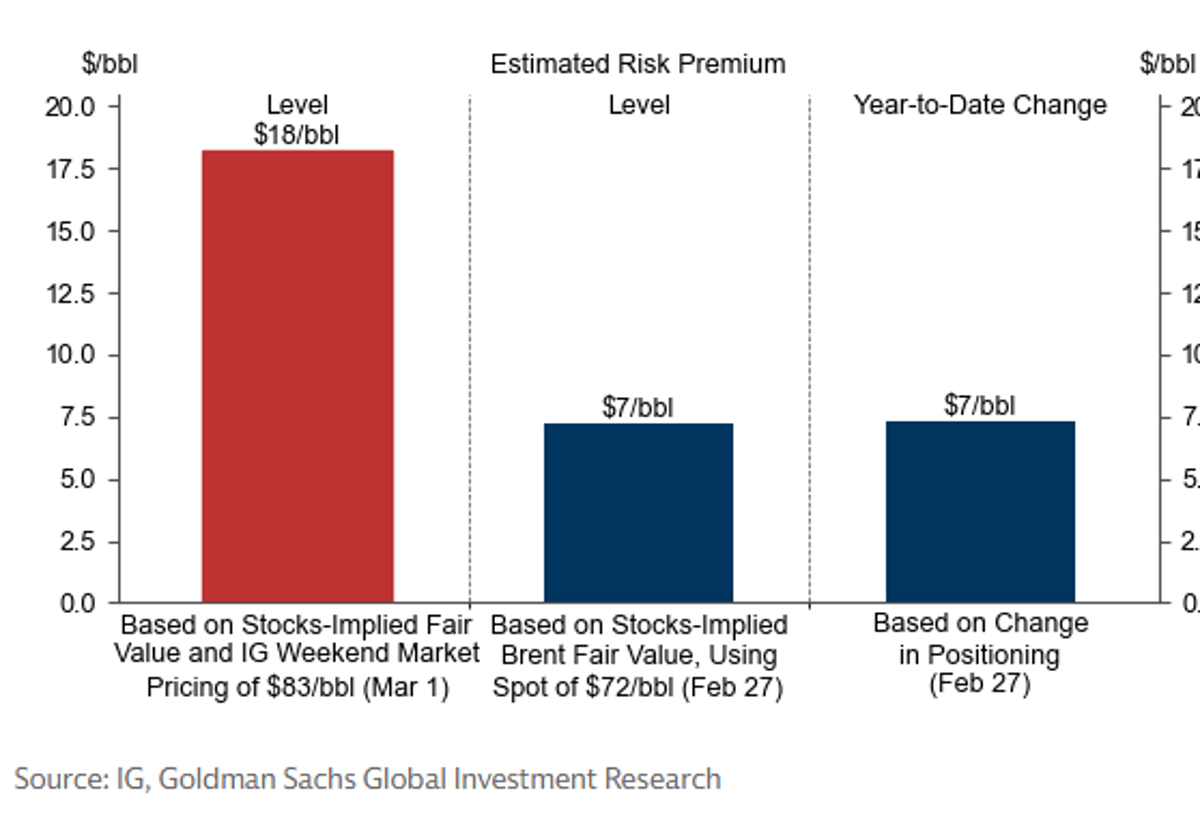
GS: Taking Into Account Estimated Weekend Market Pricing, We Estimate a Risk Premium of Around $18/bbl on the March 1st Oil Market Open https://t.co/vtpc8AfijE
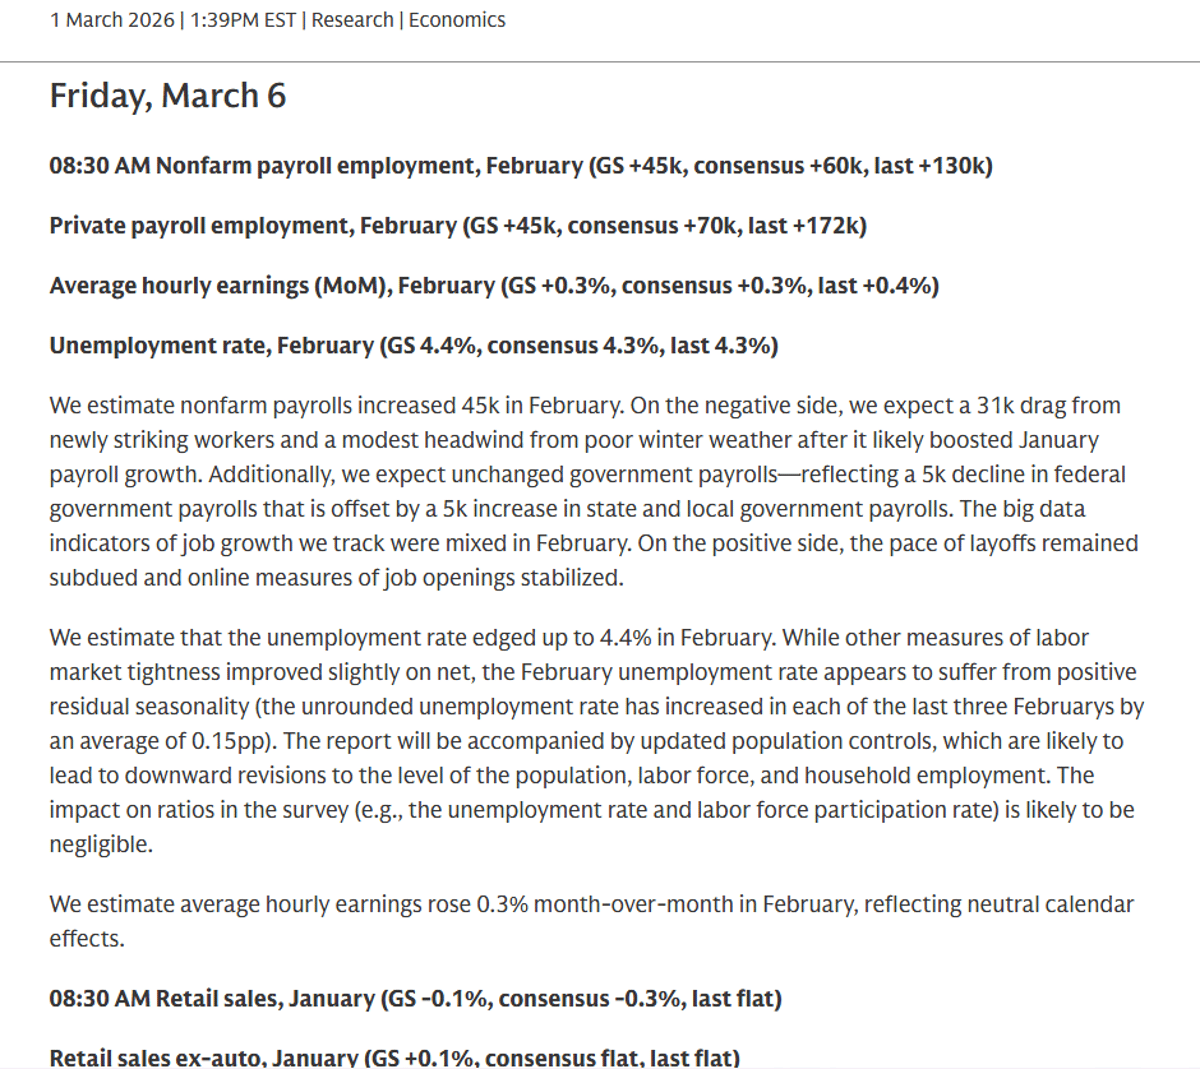
NFP, Retail Sales Fri GS thinks +45k headline payrolls, +45k private, UR ticks up to 4.4% +0.5% Jan core Retail Sales https://t.co/EbcNES5A55

The carry trade has everything to do with leverage. And I encourage you to study Yen behavior during US stock market tail events.

IG pricing US Crude up around $10 to $77.26 Gold up around $111 to $5,385 EURUSD down 64 pips to 1.1751 Strap in. This is going to be a wild open.
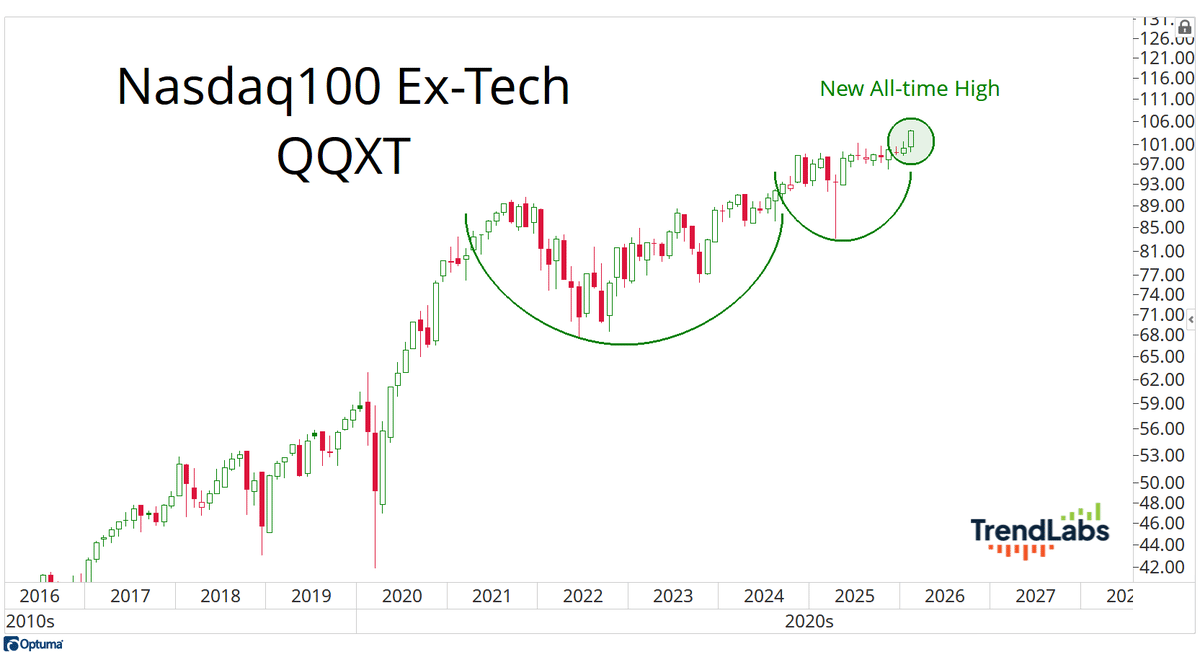
I know the Nasdaq with no Tech is like having Kool-aid, no sugar. Peanut butter, no jelly. Ham, no burger (Daaamn). But the Nasdaq Ex-Tech just closed at new all-time high on a daily, weekly and monthly closing basis. https://t.co/3ASLrrLbLk
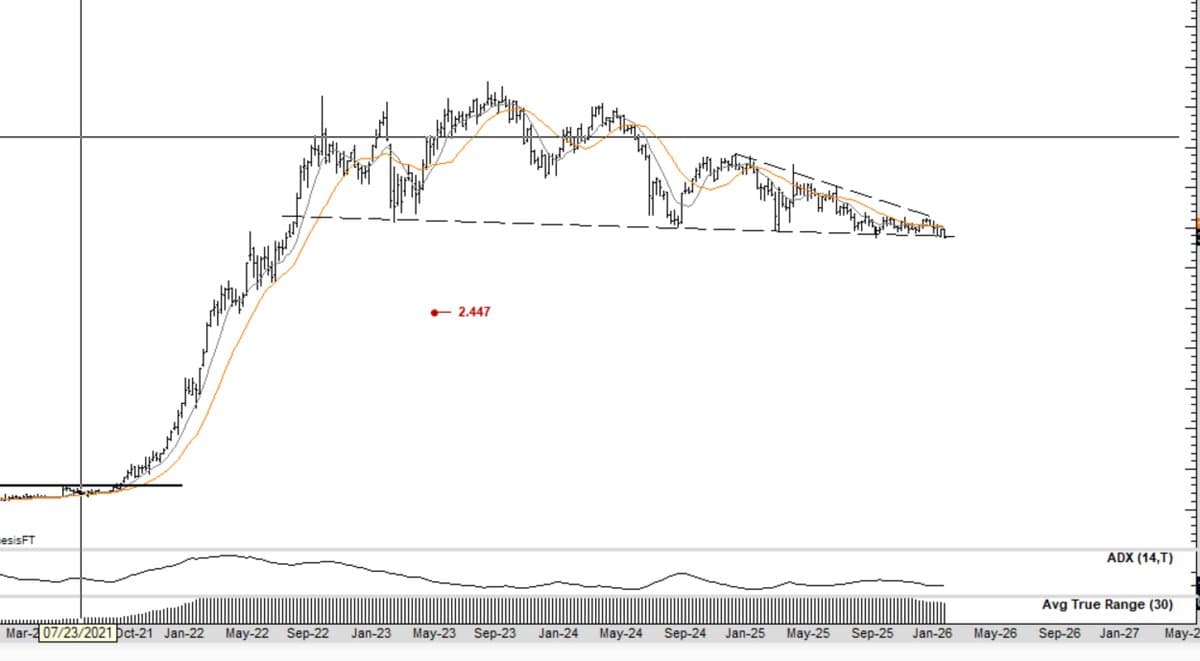
Chart of the week More important than Gold or Crude Oil More important than Iran or any other "Trumped-up" event This chart will set the tone for financial markets for months to come https://t.co/pw41RjkqT7
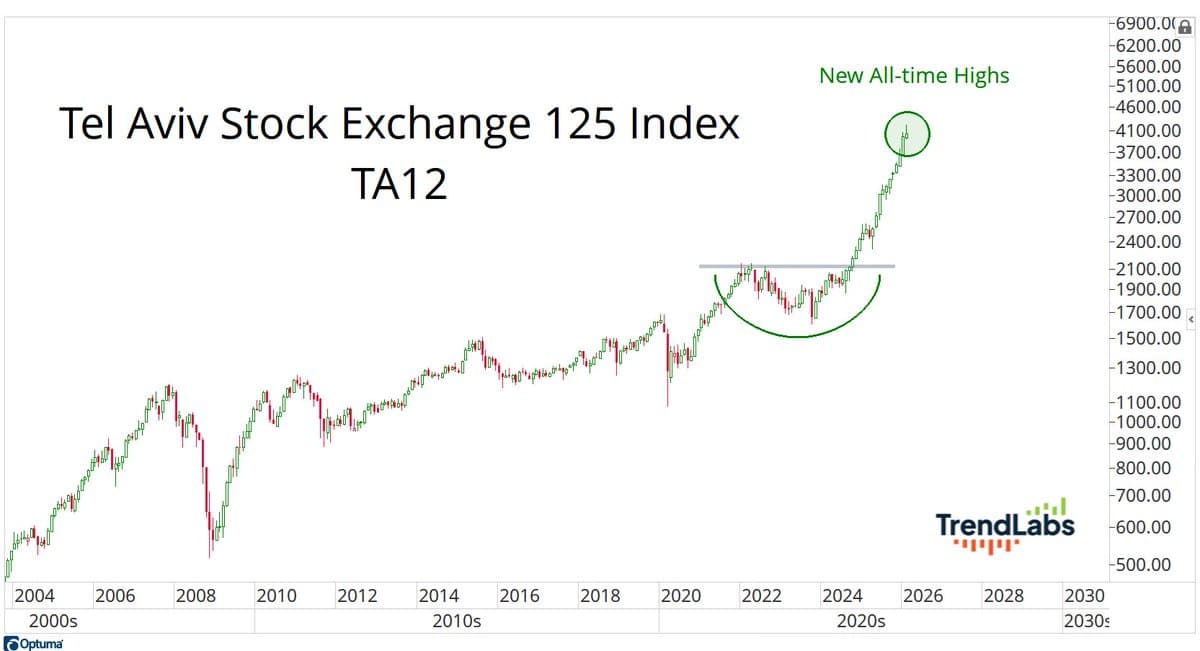
That’s 11 straight up months for Israel’s Tel Aviv 125 Index, and 19 of the last 20. The October 2023 capitulation turned out to be one of the greatest buying opportunities in stock market history. https://t.co/S7CKED4mYT
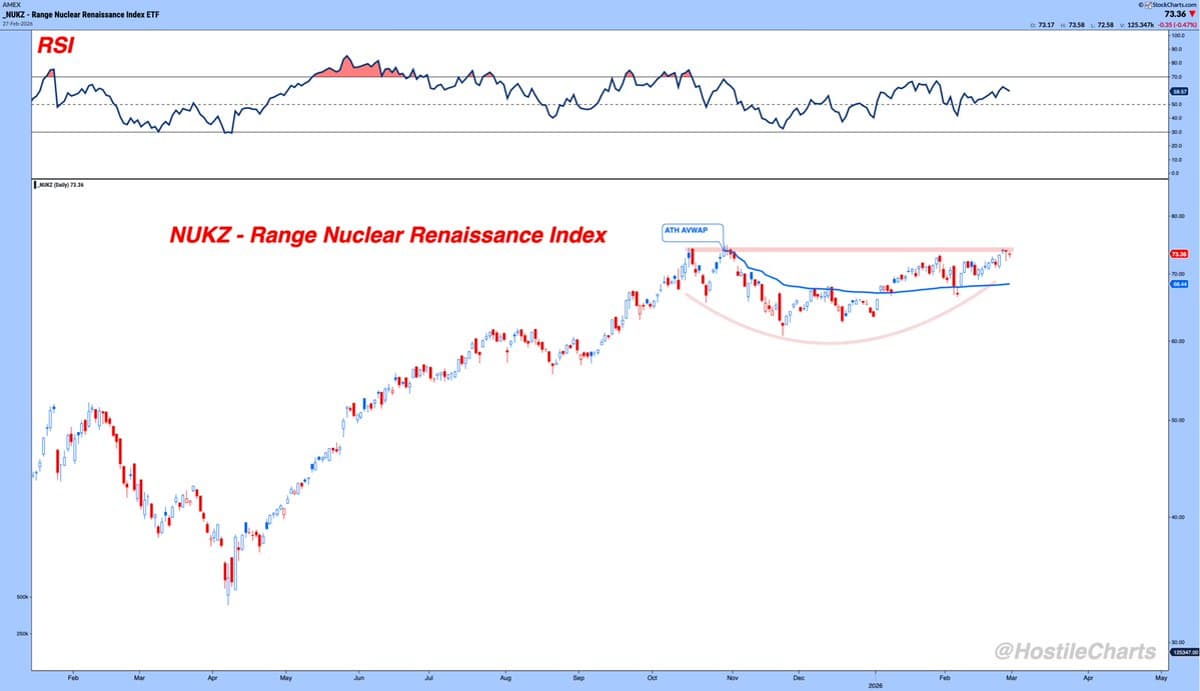
$NUKZ - Watching the nuclear...honestly don't mind jumping the breakout using the former AVWAP high as my stop. https://t.co/pCzEAhWYxc
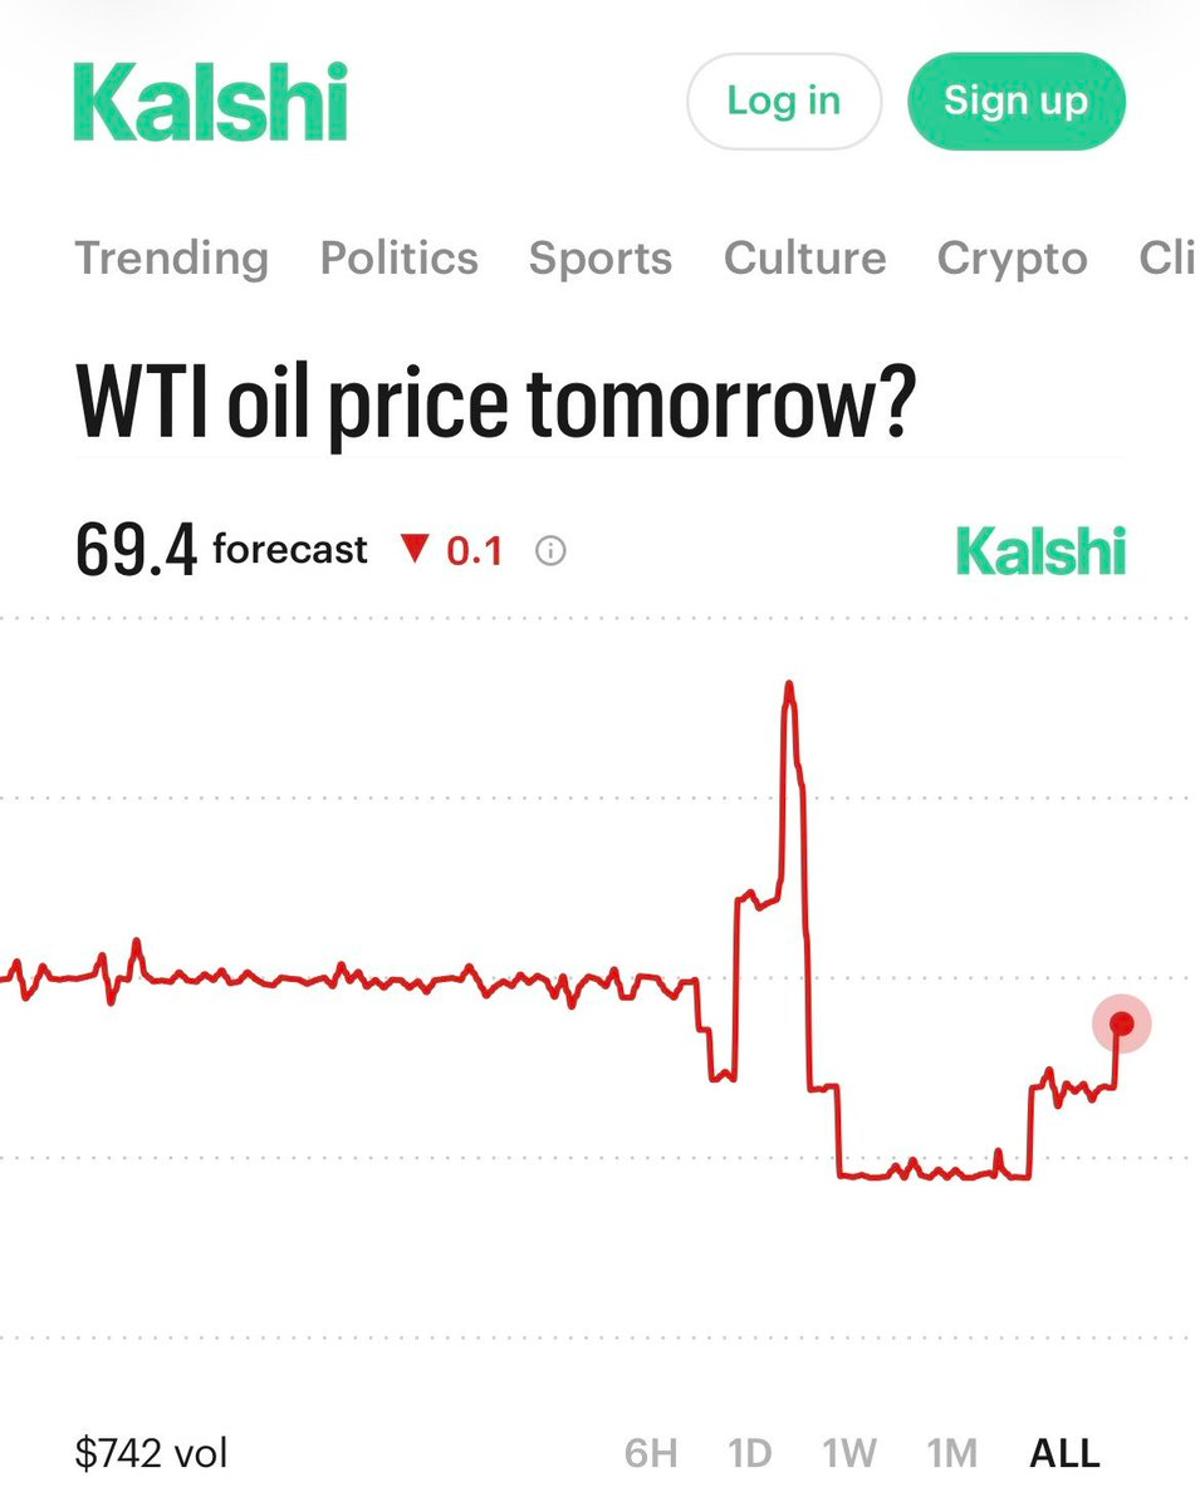
Kalshi prediction markets currently see a 95% likelihood that U.S. crude oil hits at least $73 per barrel or more tomorrow. U.S. crude closed at $67.02 per barrel on Friday https://t.co/CKqpj0YQcp

Weekly Market Report: Weekend Wars. Strategic allocation +7.7% YTD, Tactical allocation +4.3% YTD. More details and some free access in the link in reply below. 👇 $SPY $VEU $GLD $TLT https://t.co/gZFEG6wHe1
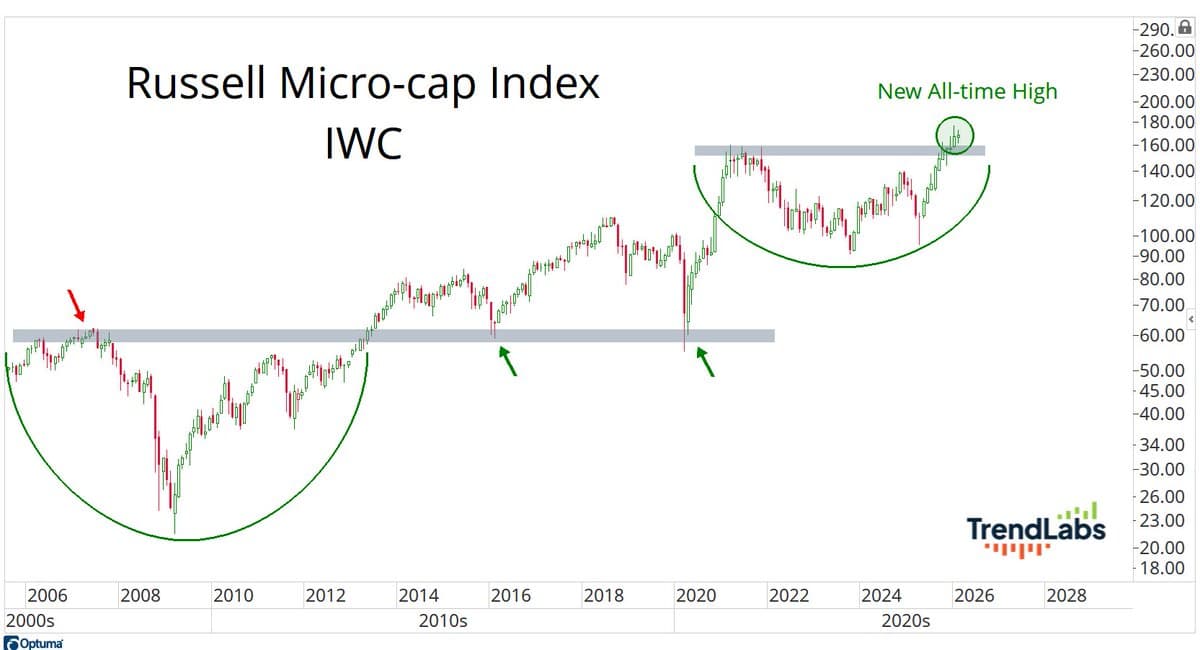
The market is so weak and turning so defensive that the Micro-cap Index is now up for ten consecutive months, and just closed the month at the highest level in history. https://t.co/R0UyyR24z2
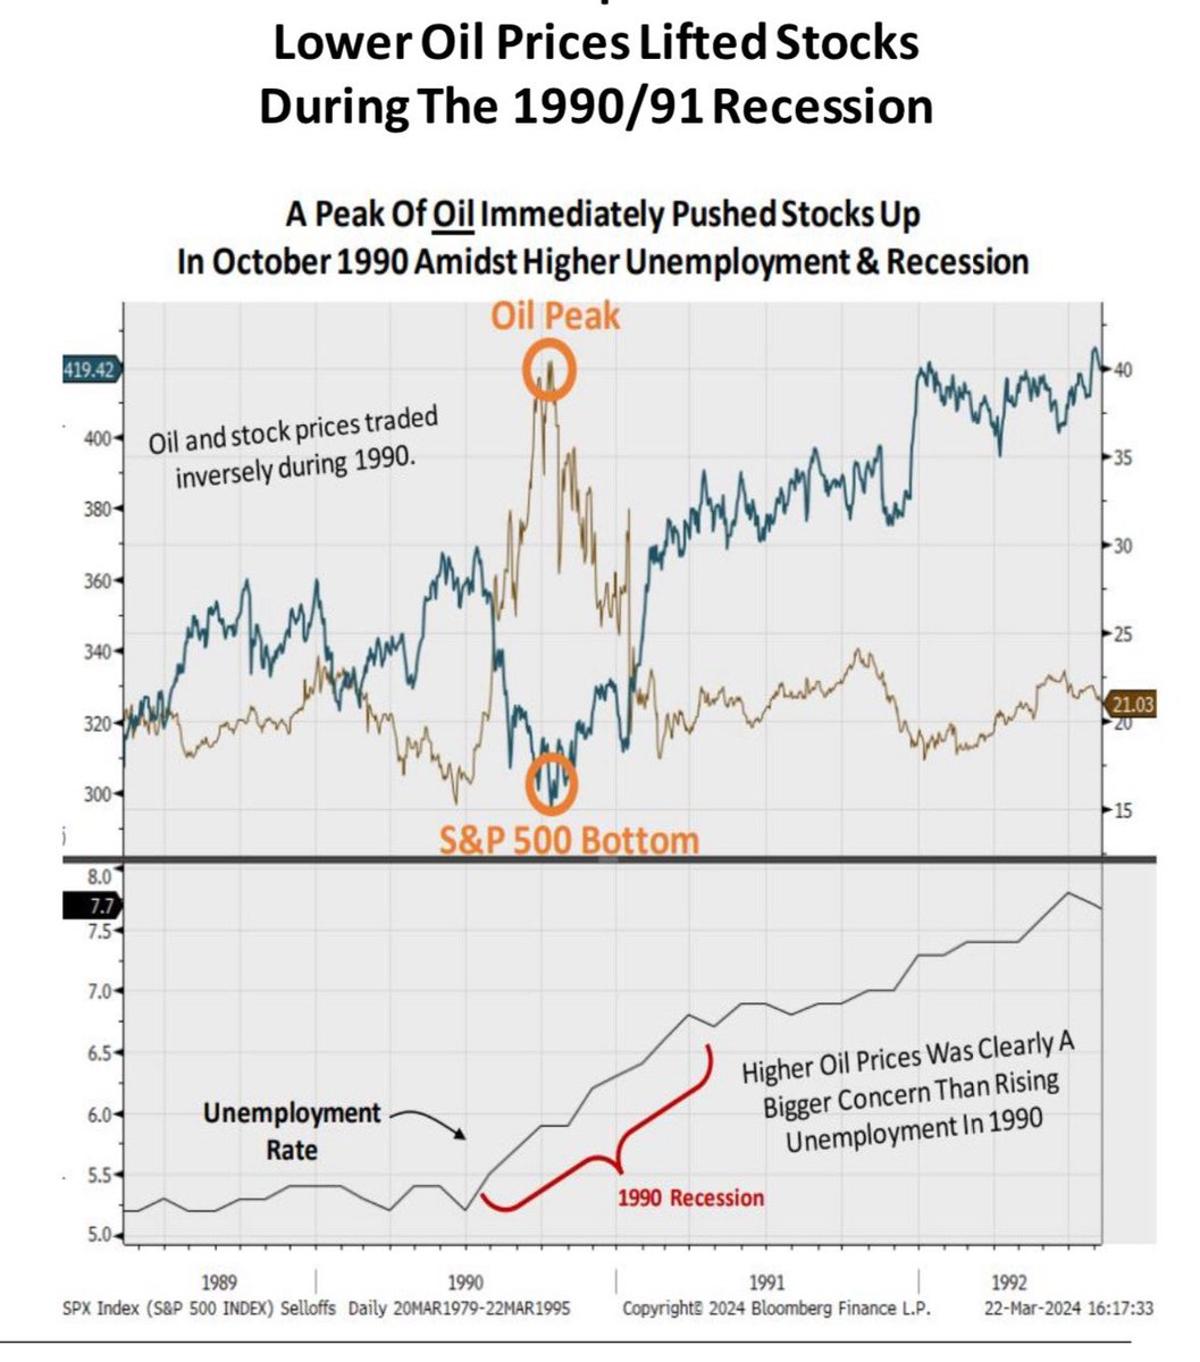
A sharp oil spike to those levels would likely result in a one-variable stock market like we initially saw during the 1990’s Persian Gulf War. Stocks under pressure until oil prices come back down. https://t.co/8DQZhDYXqo
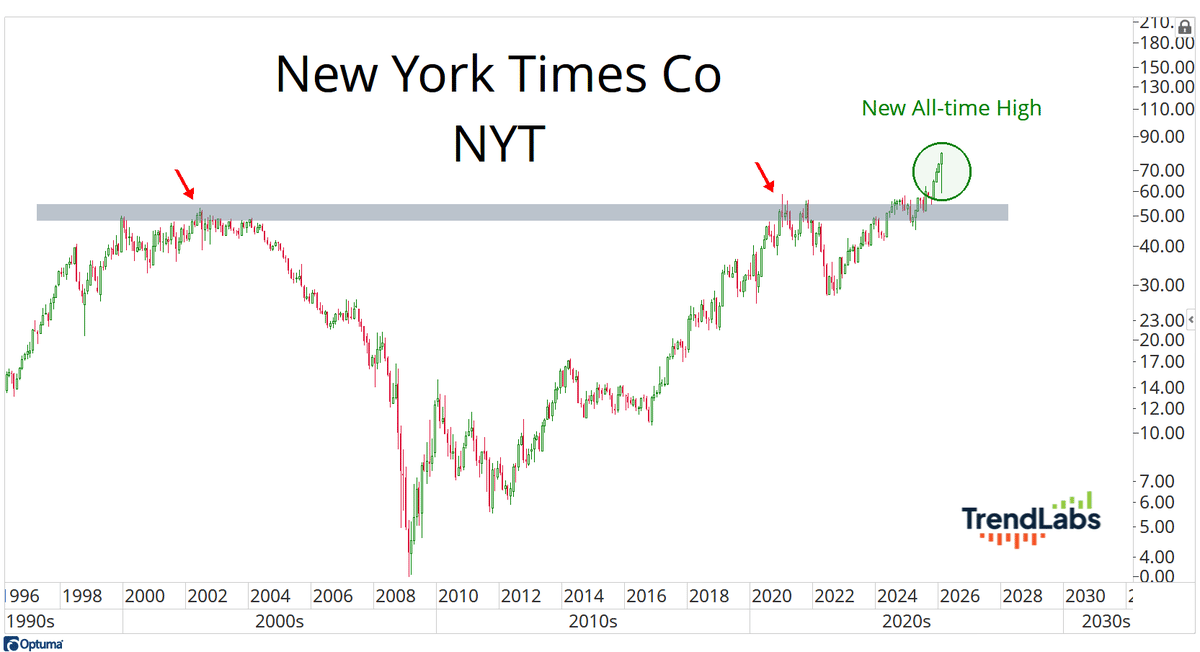
Talk about a company that just keeps on winning. This monthly candlestick in New York Times was more than 20 points wide and still went out at the highs, with Friday marking a new all-time high close for NYT 👀...

There's nothing wrong with being defensive until we see better accumulation in the Nasdaq, but I'm not getting bearish because there are so many growth stocks (outside of the Mag 7) that are in strong uptrends. More here in this...

Carbon markets are at an inflection point. Policy momentum. Capital rotation. Tightening supply. Most investors aren’t positioned for what’s next. Read this before the crowd catches on: https://t.co/axCJ40q8bX cc: @LukeAOliver @kraneshares
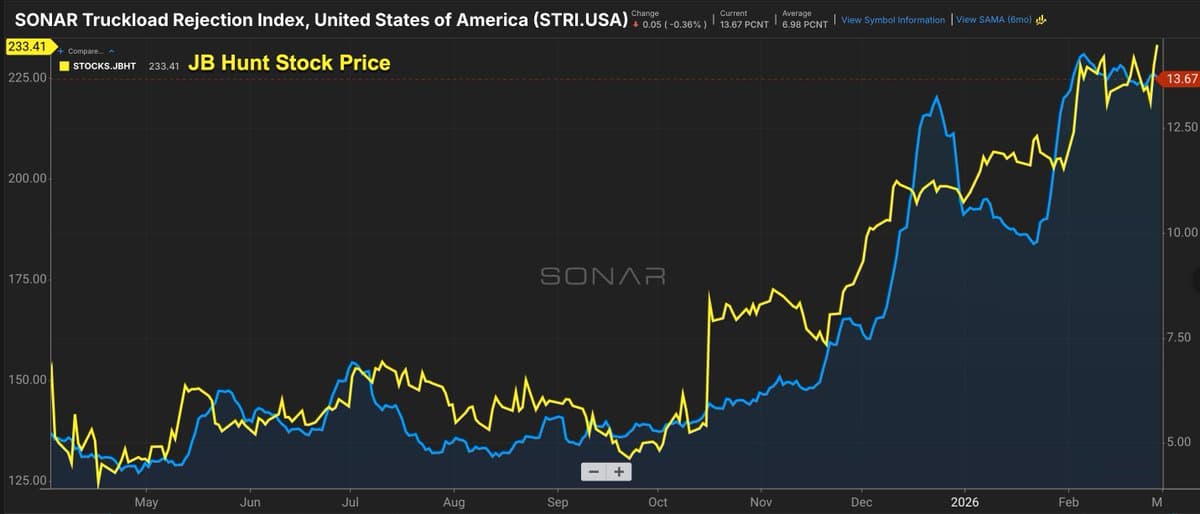
The connection is clear: Large trucking equities trade based on forward trucking market conditions and the best signal is SONAR's Tender Rejections Chart: SONAR Truckload Rejections vs. JB Hunt Stock Price https://t.co/R8Mc1l5UyF
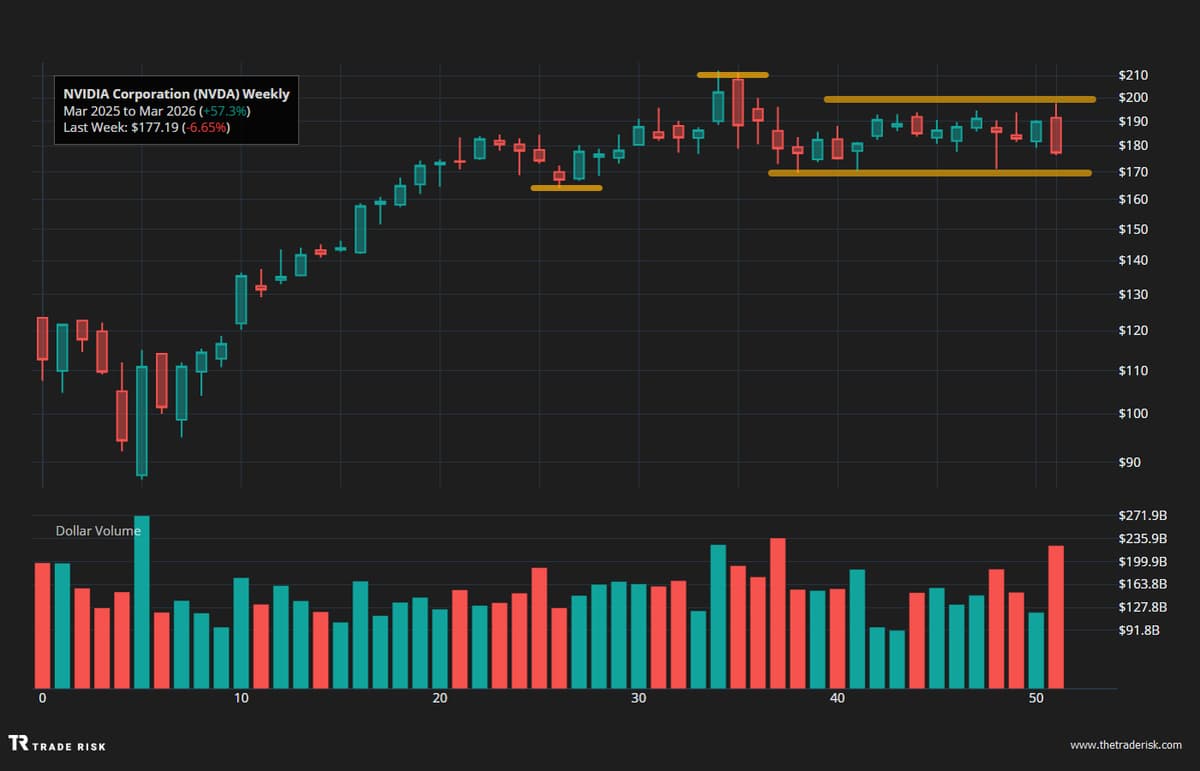
Looking forward to the day this weekly range in NVIDIA resolves itself. 📺 Latest market thoughts here: https://t.co/EXexrJSfof $SPY $IWM $QQQ $NVDA https://t.co/MT0GCVoiFE
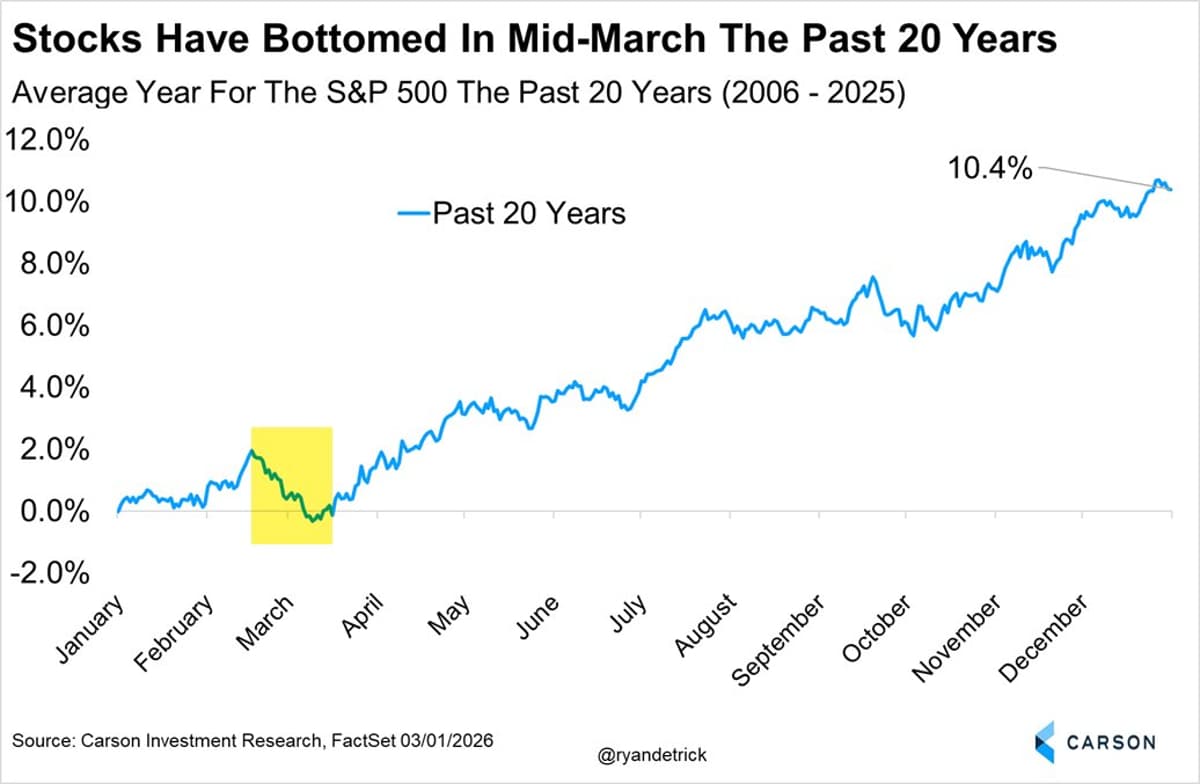
Looking at the past 20 years, it is perfectly normal for S&P 500 weakness in late February and into mid-March, then a major low forms. Yes, 2009 and 2020 are a big reason why, still worth noting. https://t.co/di2DeekJx8
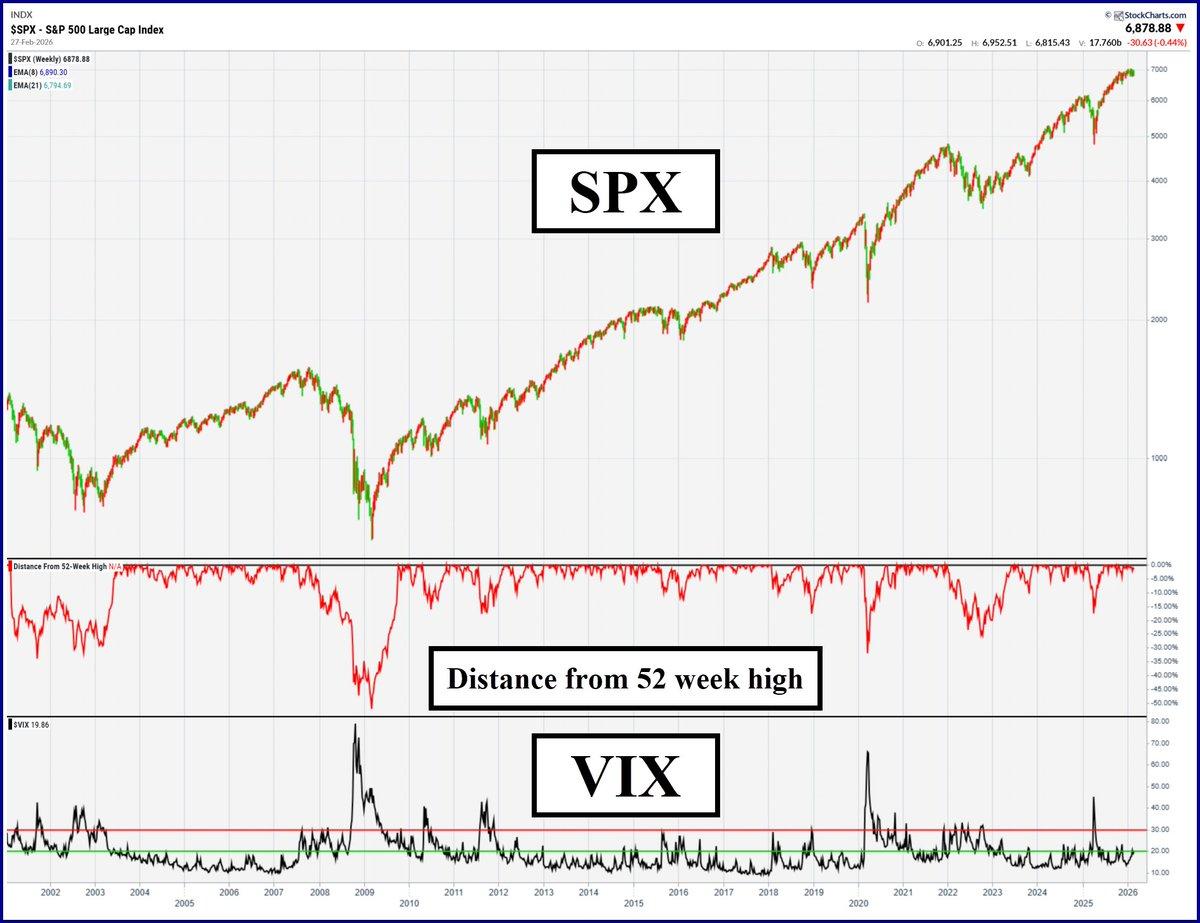
Going back to collapse of the Internet bubble, serious VIX spikes coincide with big drops from 52-week highs for $SPX. Second chart is a closer look at current times. Do we go down hard when futures open later today?? https://t.co/XnG2Iu29Fd

FREE Book: Andrew Aziz @BearBullTraders’ #1 bestselling day trading book for over 10 years: How to Day Trade for a Living is FREE on Amazon Kindle today. https://t.co/CMtQsmFMhY It is the perfect book for new traders and those looking to sharpen...

What is the #1 trade you want to be holding when a Middle East war breaks out over the weekend? ⬇️