S&P 500 Posts 99.7th Percentile Surge in Two Weeks
Incredible. At least a 99.7th percentile move (per @WarrenPies earlier today) in the S&P 500 over the past 2 weeks.

Nasdaq Hits New ATH, RSI Suggests Further Upside
#Nasdaq Comp big Up Candle and New ATH (just) 24026. Support 23331, 23000, 22501. RSI 65 not that high so more room for gains. Top Bollinger Band 24150. Midpoint Line 22684. Bottom Band 21245.
S&P's 11‑Day V‑Recovery Shows Power of Price Action
While skeptics focus on Trump, the Middle East, and oil prices, the S&P 500 just staged a V-shaped recovery to new highs in only 11 days. After more than 40 years of successful trading, I still don’t rely on gut instinct...
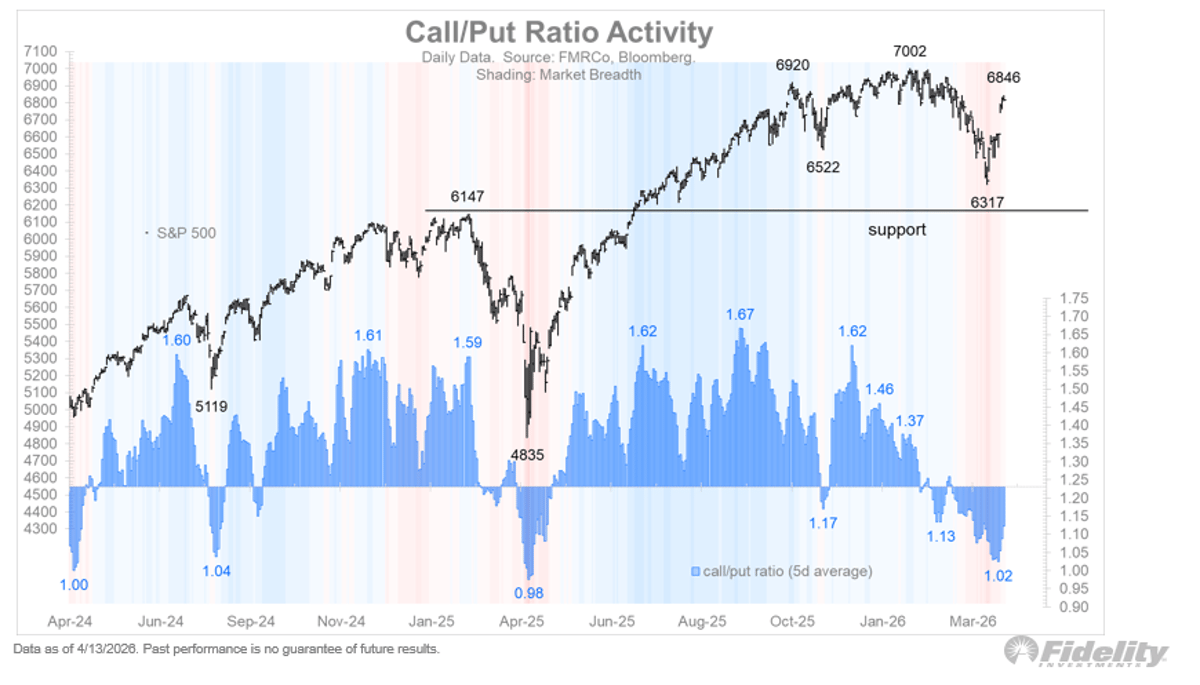
Market Rally Fueled by Call/Put Oversold Reversal
One support behind the market’s surge last week was the reversal in sentiment from an oversold extreme, at least as judged by the call/put ratio. That ratio is still negative. https://t.co/i43C3jXDt6

Stocks Hit Record Peaks as Sentiment Hits Record Lows
It's official: Stocks are at all-time highs, while consumer sentiment is at an all-time low

Tech Rallies, Transport Slumps: Nasdaq’s Best Day Since 2023
After a steep decline, Nasdaq Comp vs Dow Transports is just about having its best day since early 2023... bullish reversal favoring tech at the expense of the 'real' economy? @stockcharts $COMPQ $TRAN https://t.co/3GneL22l5O

Imported Inflation via Energy and Food Remains Top Risk
“The biggest risk continues to be that inflation gets imported around the world,” first through energy, then to food & beyond: MS’s Ted Pick. Otherwise, markets will stay strong with even a “narrowing of the cone of uncertainty” around the...

Markets Surge to Record Highs, Silencing Doom Forecasts
The S&P 500 and Nasdaq 100 both hit all-time highs today. Congrats all.. well, except for the columnists and economists who have spend the last 15mo wishcasting doom, my condolences to y'all. https://t.co/tWXvVesdyR

V‑Bottom Returns: Stocks Surge While Quality Lags
V-Bottom Strikes Again: Stocks Soar as Quality Lags As the S&P 500 hits a record, I assess how far we've come... and where equities may be headed @stockcharts https://t.co/4cER6C7dmo https://t.co/oo4msWOBBK

31 Large‑Cap New Highs, Only One New Low
there are 31 large-cap stocks hitting the 52-week new highs list today... there is 1 large-cap stocks hitting the 52-week new lows list... #HighLowShow #marketUpdate #investing
April All‑Time Highs Predict 22‑0 S&P Gains
Another fun tidbit to watch into month end. April’s closed at a new all-time high monthly close 22 times. The S&P 500’s return the remainder of the calendar year is then a perfect 22-0 for average gains of 11.18%. $spx

RSI Jumps 30‑70 in 15 Days—Rare Historic Signal
RSI has gone from under 30 to over 70 in 15 days just two prior times since 1980: Nov. '16 & Aug. '82. It's not quite there yet but it's very close. $SPX $SPY https://t.co/qhQVEqh9QX

Elon’s Hardware 5 Tape‑Out Fuels Tesla’s Biggest Rally
$TSLA up 7.4% today, marking its best daily performance in 9 months. I attribute 20% of today’s move to the market (Nasdaq up 1.4%), along with a UBS upgrade earlier today. I believe 80% of the move is related to Elon’s nocturnal...
NDX's 11-Day Rally Falls Short of 1979 Record
The NDX is up 11 days in a row. Not the record. The NDX was up 19 days in a row in August 1979.

SPY Reaches 52‑Week High, EMA Bullish Cross
$SPY hits the highs and in 52 week high list. Weekly chart 8/21ema bull cross
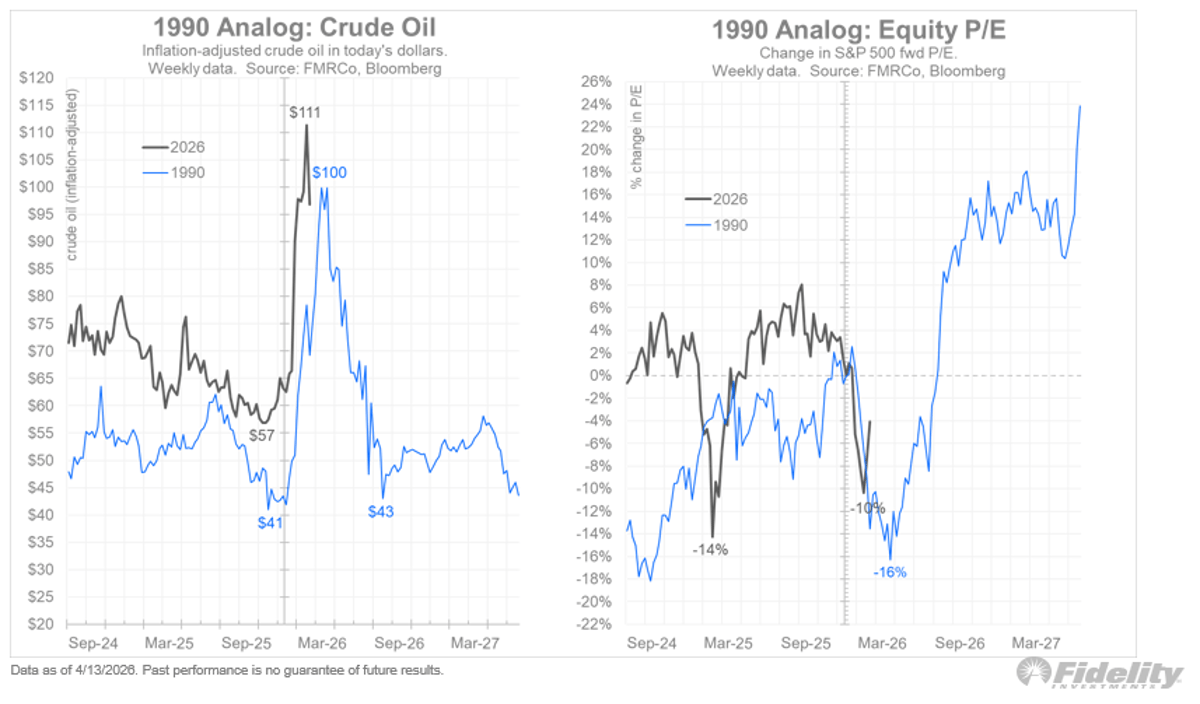
Oil Spikes Trigger Swift P/E Collapses, History Repeats
The markets have been pricing for a quick end, much like what happened during the 1990 Gulf War. The analog below shows that the surge in oil prices to $100 (in today’s terms) was quickly reversed, and with it so...
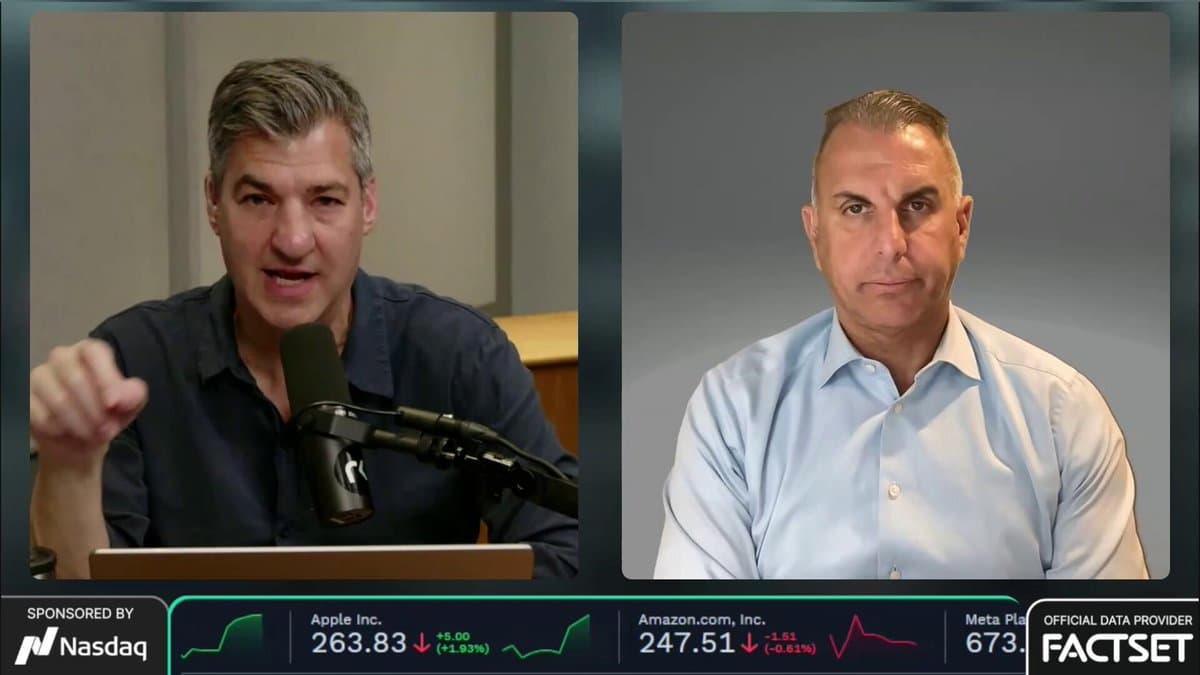
Nasdaq‑100 Leads, Not Nvidia, With Software Upside
"This is the main event for the Nasdaq-100, not Nvidia." With $MSFT earnings on deck + $IGV showing signs of life. The next 15-20% in software could be to the upside. 🎙️ Dan Nathan & @GuyAdami on MRKT Call https://t.co/m7qiCbM5wb
AMD Eyes Base Zone at $236‑$257 After 10 Up
$AMD daily with 10 up days finally starting to base. Daily indicators elevated a move back to the 10ema and gap for basing levels would not be disaster. 236-257 area for basing
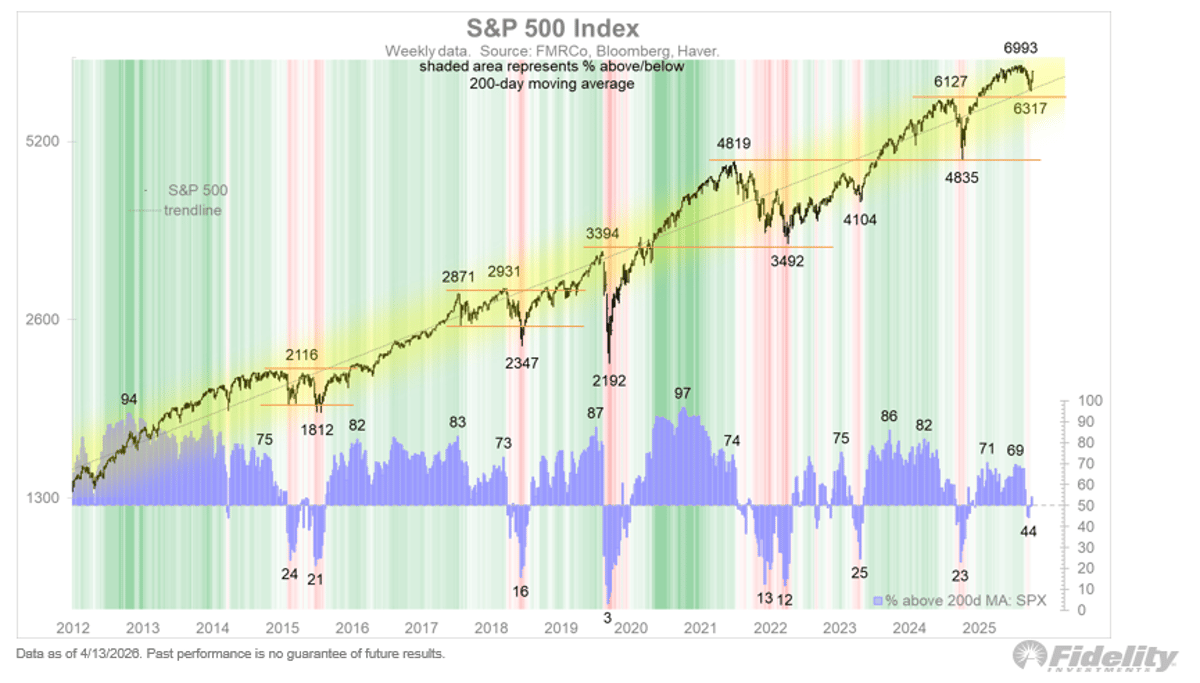
S&P 500 Missed Oversold Low; Further Dip Needed
The weekly chart below shows that the S&P 500 index stopped short of an oversold extreme at its March 30 low of 6317. We never got that juicy entry point. We’ll see how the market reacts as the headlines continue...
Equities Rally on Hope, Valuations Still Under Pressure
Equity markets gapped higher last week on hopes that the negotiations in Pakistan would lead to some sort of détente. The week closed with an S&P 500 index at 6816, a mere 2.6% below its all-time high set on January...
Equity Demand Soars; Markets Unfazed by Hormuz Blockade
Wall Street is choosing optimism. $SPY near record. $QQQ up 10 straight days. Oil falling. Gold rising. VIX at 18. The Strait of Hormuz blockade didn't break markets. That tells you more about modern equity demand than any single data...
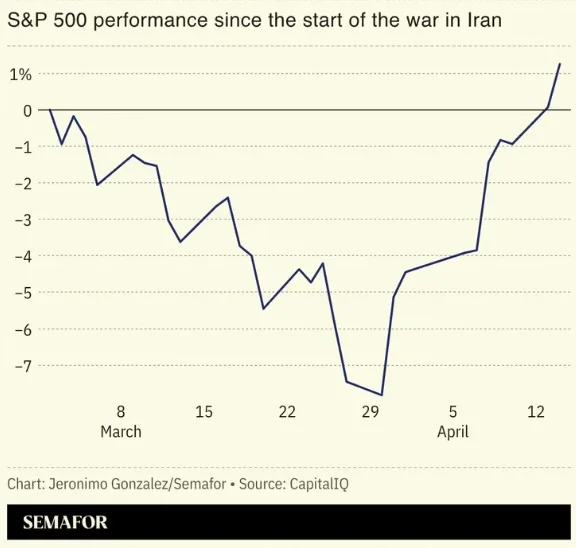
S&P 500 Rebounds, Ignoring War, Oil, Inflation
the s&p 500 has fully recovered to pre-iran war levels. the strait of hormuz is still effectively closed, disrupting global supply chains. oil is still near $100. inflation just hit a three-year high. the market has decided none of that...

SPX Holds Positive Gamma; 7025 OI Leads Upside
SPX overall positive gamma still holding. -7,025 is the biggest 0DTE OI right to upside. -Downside eyes on 6,965 Now trial it in BLOOMBERG: APPS SPOTGAMMA Updating every minute of every day - not that stale bank stuff + see SPX gamma map +5...

Seeking Update on Tech-to-Industrials Rotation Status
Can we get an update from the “tech to industrials rotation is on” crowd ?
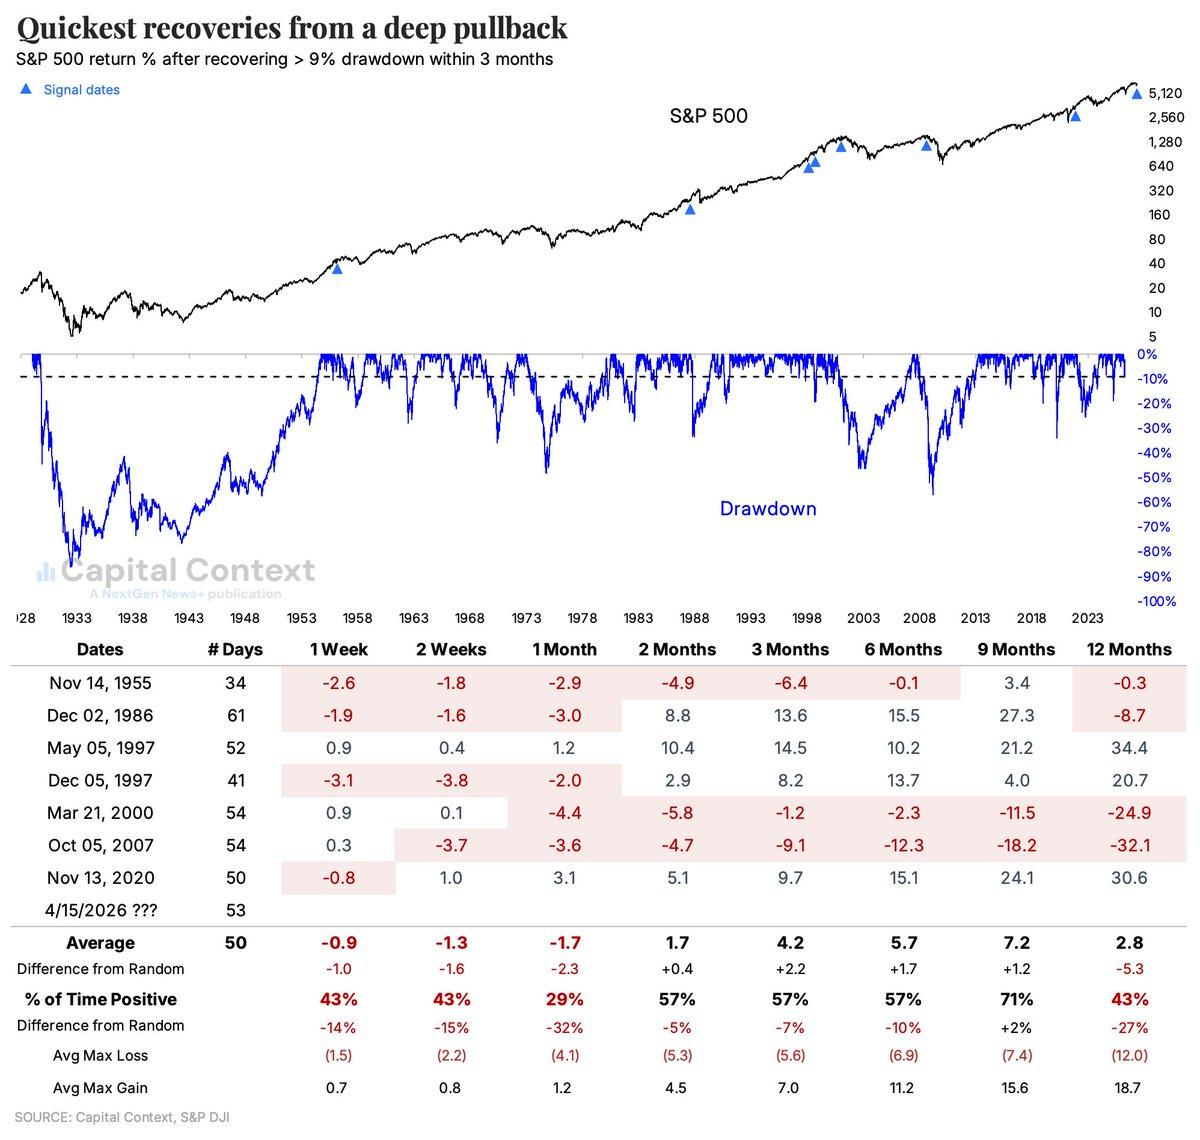
Record S&P Close Would Mark Fifth Fastest Rebound
If the S&P 500 closes at a record, it will be the 5th-quickest recovery from a deep pullback. The others weren't necessarily all-clear signs. https://t.co/RDoP06CRSs

Nasdaq Rides 10-Day Streak, Five‑Wave Bullish Momentum
The Nasdaq has completed 10 days of consecutive gains and the hourly chart shows a possible five wave advance in progress. Once complete there could be a pullback but the larger trend should remain bullish #Nasdaq #StockMarket #ElliottWave #TechnicalAnalysis #Indiacharts...

60M QQQ Call Options Set to Expire Today
QQQ $60M of Jan. 575 and March 590 calls look to be cashing out today

Uptrend Pullbacks Offer Prime Cash Deployment Opportunities
although my 50/200 $SPX model didn't quite reach that lower horizontal washout line, indicating solid intermediate-term pullback relative to long-term uptrend, the story is the same... pullbacks in uptrends are helpful for those trying to deploy cash... https://t.co/TheoptTSBK

Markets Near Record Highs as Peace Prospects Brighten
🚨 IRAN. CHINA. OIL. STOCKS. 2 MINUTES. Markets are near record highs but the US-Iran ceasefire is still up in the air, China is watching every move, and oil prices are creeping up. Here's what it all means for your portfolio 👇 📌...

Canada’s EWC Outperforms U.S. Indices Amid Market Rise
as you look at the U.S. stock market rising, don't forget those relative trends, which favour Canada $EWC, no matter U.S. equal weight $RSP or cap-weighted $SPX https://t.co/50q7XPZYxo

Snap Cuts 1,000 Jobs, Targets Profitability, Shares Climb
Snap to lay off 1,000 employees, and close 300+ roles as it targets profitability; shares rise $SNAP https://t.co/rhACOWqjNZ
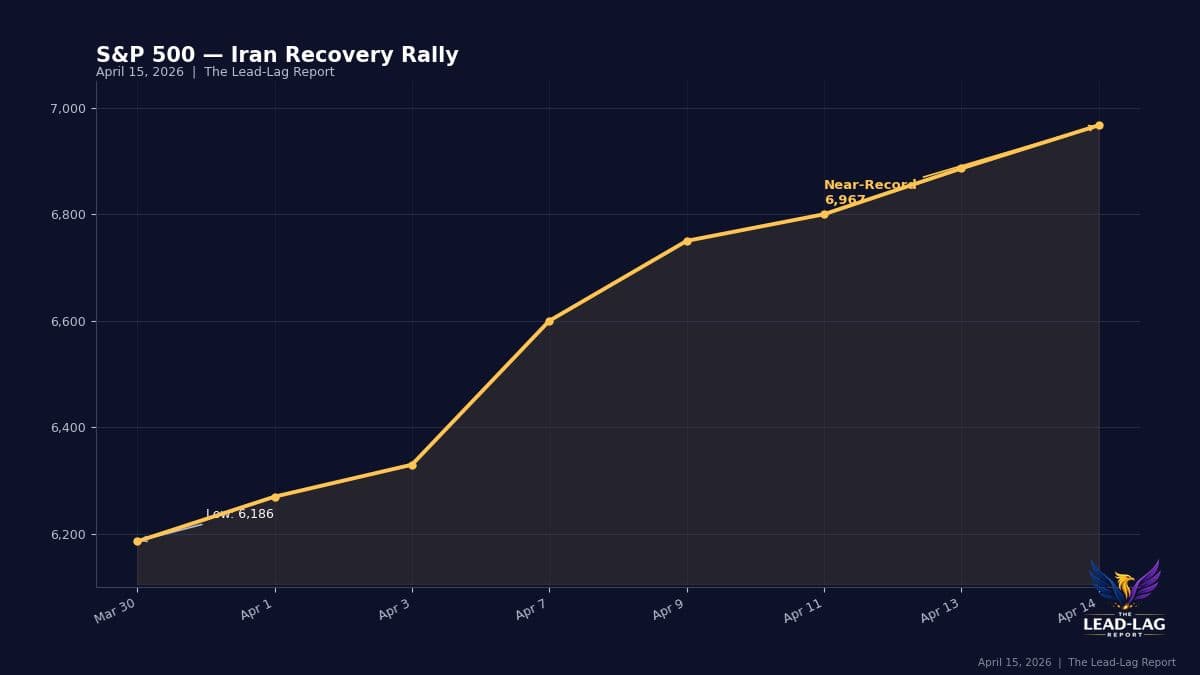
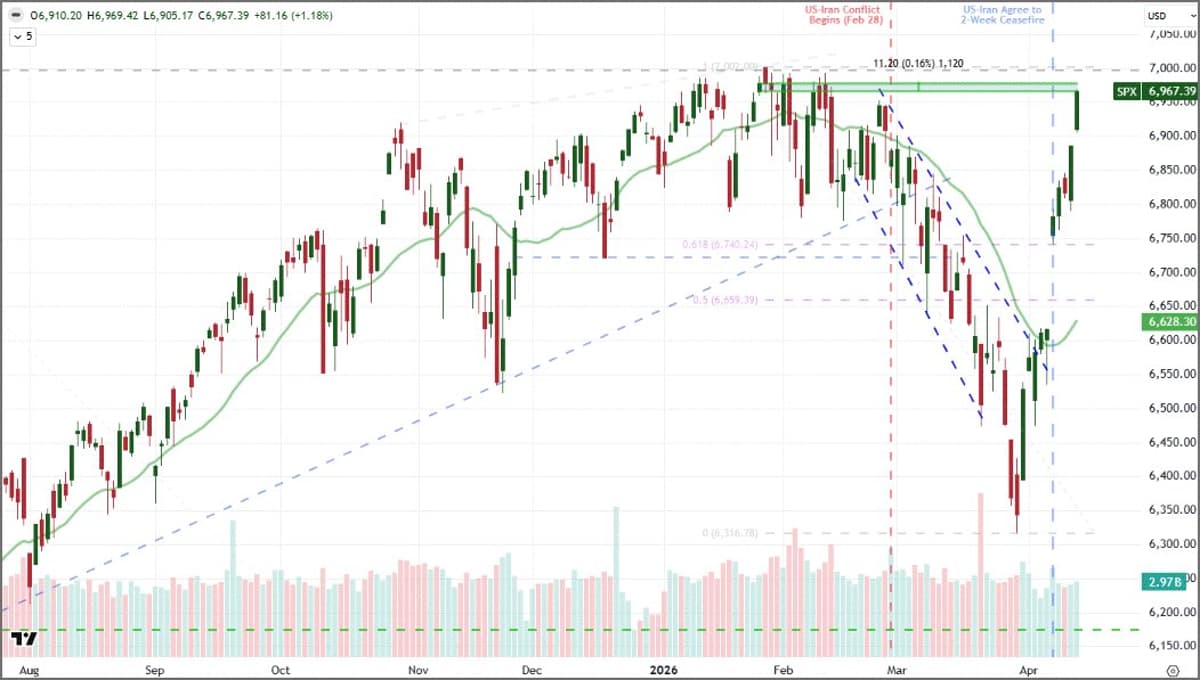
SPY Near Record as Iran Conflict Losses Vanish
$SPY closed at 6,967 on Apr 14 — just shy of an all-time record. Every loss tied to the Iran conflict has been completely erased. Markets aren't waiting for peace to be confirmed. They're pricing it in now. https://t.co/W4J7sSfitX
S&P 500 Rebounds Above Pre‑war Levels; Targets Unchanged
The S&P 500 is already back above where it was before the war started. Wall Street strategists never even changed their year-end targets. 🔒 Members-Only https://t.co/hCPHyKZhRV
Permabears Wrong: S&P Hits Record Amid Ongoing Uncertainty
After permabears said world was coming to an end a few weeks ago… S&P 500 now right at all-time record high. Nasdaq up 10 straight days… +14%. Remember, permabears panic over *everything*. They want to feel smart by calling next crash. Problem is… Nobody. Knows....

Wednesday's Stock Moves Set Tomorrow's Market Direction
JUST IN: Wednesday's key stock developments are set to influence market movements in the next trading session.
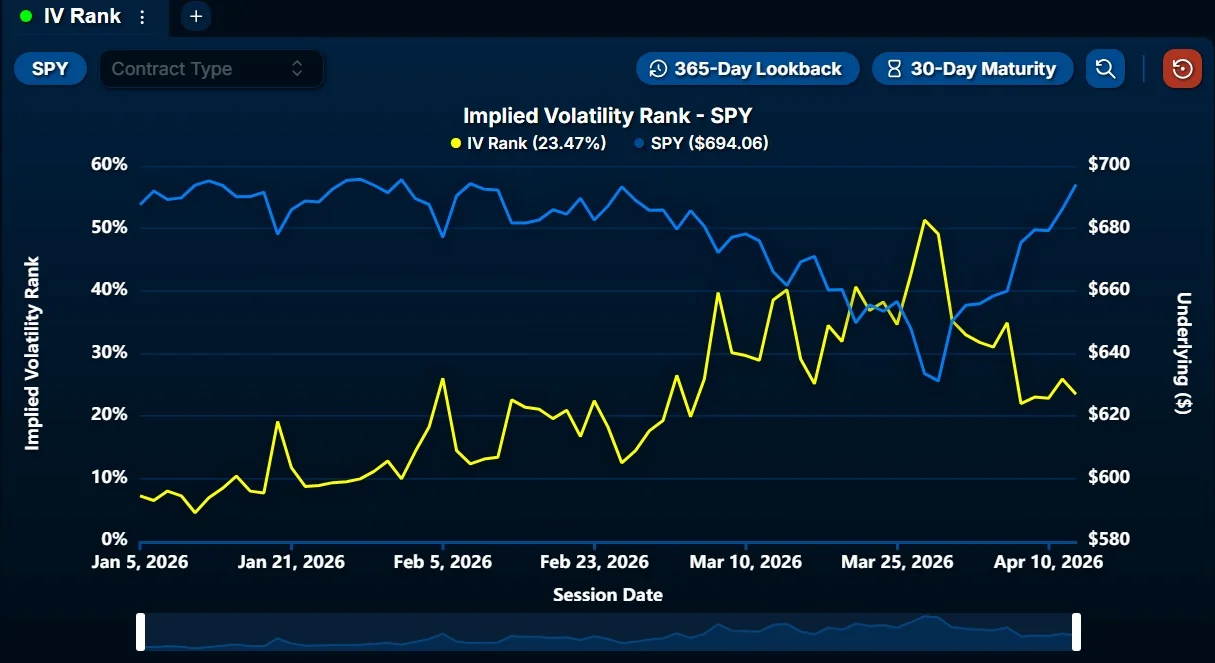
SPY Volatility Near Pre‑war Levels, Gamma Gains Focus
Implied vol on $SPY is practically back to pre-Iran war levels. As vol compresses, exogenous drivers become less dominant, and dealer hedging flows have a greater influence on price action, making gamma exposure increasingly important to monitor.

Cramer: Unfounded Fears, Stay Invested
JUST IN: Cramer says the market's biggest fears didn't materialize, so you have to stay in the game.
Wall Street Rallies on Peace Hopes, Earnings, Inflation Data
JUST IN: Major Wall Street indexes climbed, pushing the S&P 500 near its record high, as investors eyed a potential Middle East peace deal and reviewed recent bank earnings and US inflation data.

Policy Push Sparks V‑Shaped Tech Rally, Risks Lurk
Trading A Policy Intervention V-Shaped Meltup $IGV $SPX $ORCL $MSFT Policy intervention headlines, mechanical flows & short covering triggered a sharp V-shaped rally - led by tech. Momentum is strong, but risks remain that could quickly reverse the move. https://t.co/2MbhKAp47Z

S&P Near Record as Nasdaq Racks 10‑Day Streak
📊 April 14 Market Close: S&P 500 surged to 6,945 — just 55 points from its all-time high. The Nasdaq posted its 10th straight gain, the longest winning streak since 2021. Three catalysts drove today's rally: a massive PPI inflation...

S&P 500 Posts Biggest 10‑day Rally Since 2020
The S&P 500 is up 9.83% the past 10 trading days, for the best 10 day gain since coming off the COVID lows in March 2020. https://t.co/iPKDHL8E1N
S&P 500 Inches Within 0.2% of Record High
This is how far off of a record high the $SPX's close is today....less than 0.2%. You can smell that YOLO in the air again... https://t.co/46zbHTLg3m
S&P 500
#SP500 Up Candle near ATH 7002. Support 6790, 6740, 6600. RSI 61 not high. 13/21 day EMAs Bullish. Top Bollinger Band 7013. Midpoint Line 6715. Bottom Band 6425.

Transportation Index Surge Signals Strong Economy, Overlooked
The strength in the Dow Jones Transportation Index has been nothing short of spectacular. Should tell you everything you need to know about the underlying economy. Not sure why this isn’t getting more attention. $DJT $IYT $SPY $QQQ https://t.co/YmdiJSd4Qx
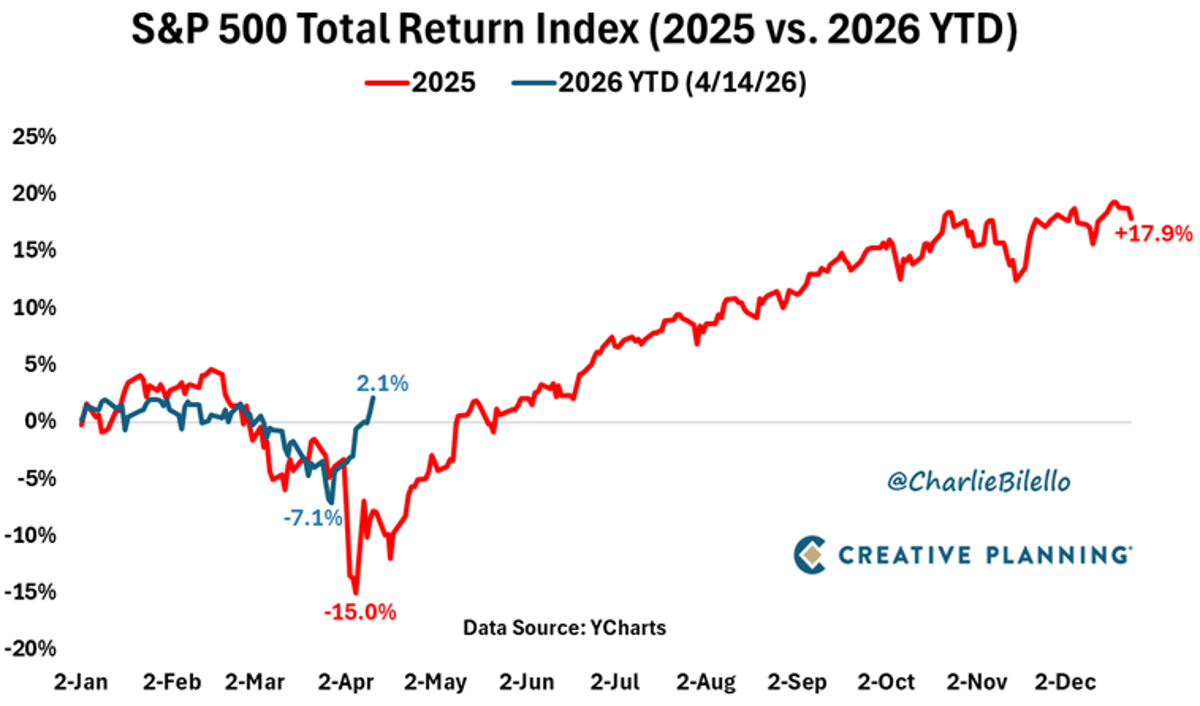
S&P 500 Total Return Hits New All‑Time High
Including dividends, the S&P 500 is now up over 2% YTD with the total return index closing at a new all-time high today. $SPX https://t.co/oE5qym7Qb6
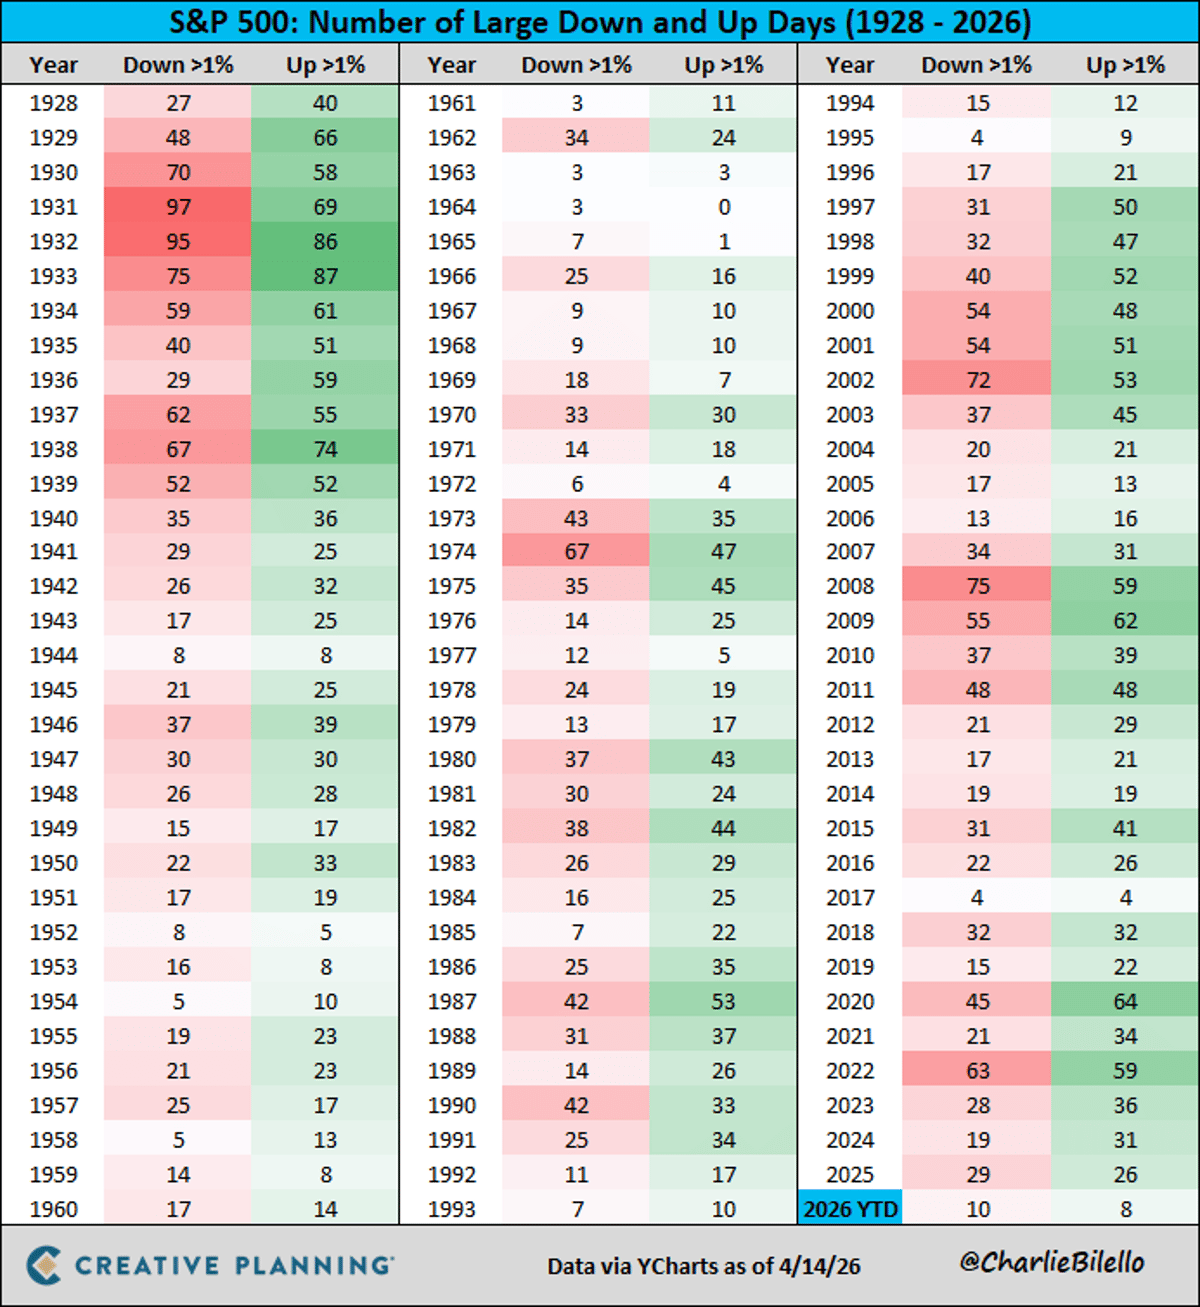
Volatility Clusters: Big Ups Follow Big Downs Near March Low
The S&P 500 rose 1.2% today, its 4th big up day (>1% gain) in the past 2 weeks. The V-shaped recovery off the March low is another reminder for investors: volatility cuts both ways and is not linear over time....
SPY 8‑MA at 676, Trim Positions
SPY 8-MA way back at 676 now, quite extended near-term along with that NYMO, not a bad time to trim, take profits, write covered calls imo, annual outlook to start the year put out SPX 6350 as the BTFD level...
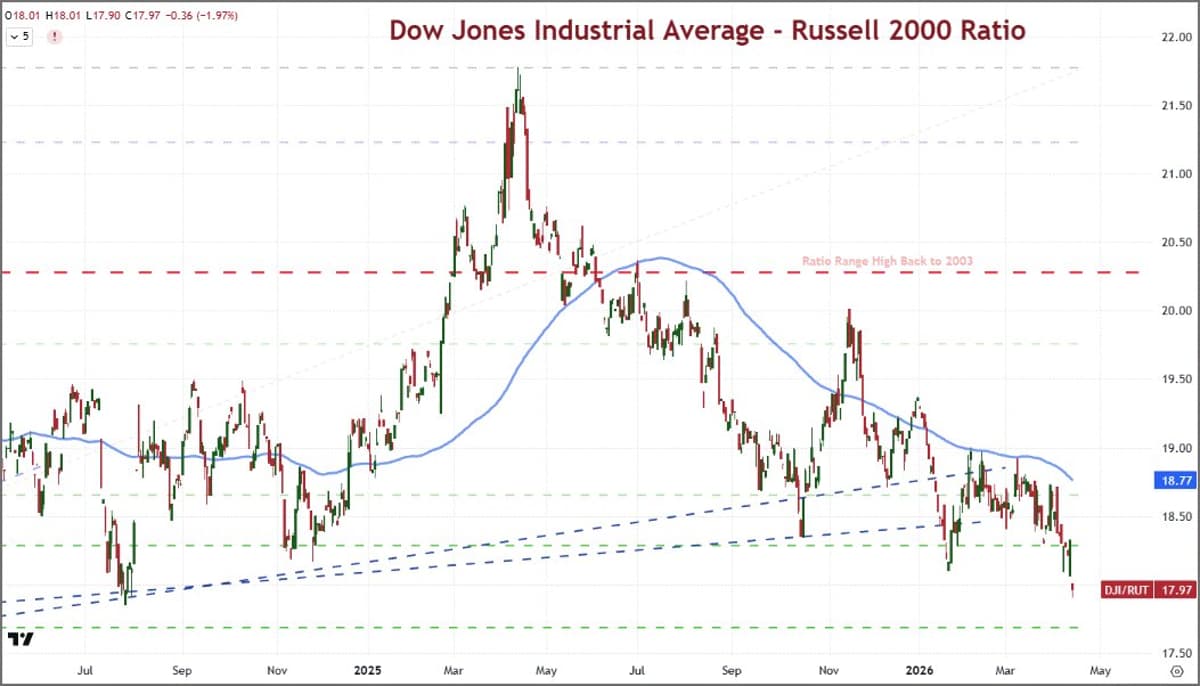
DJIA/Russell 2000 Ratio Hits Lowest Since July 2024
Something of a contrast to the 'concentration' perspective, the ratio of the DJIA to the Russell 2000 has actually extended its drop to its lowest point since July 2024. This shift suggests there is a diversification in risk appetite - but...
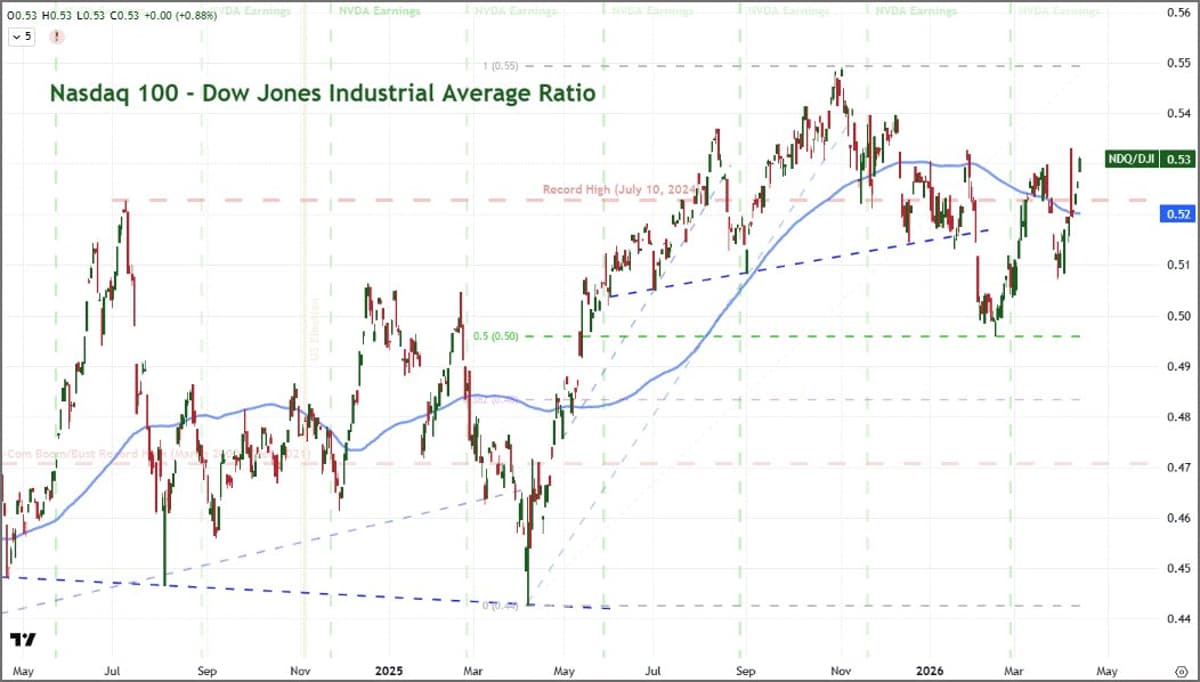
Tech Outpaces Blue Chips Amid Speculative Deal Hype
Looking behind the speculative charge fueled by the market's expectation of a deal (or TACO if you want to access uncharitably), there is a preferential skew towards tech vs other major market cap players. Here is the NDQ vs DJIA...
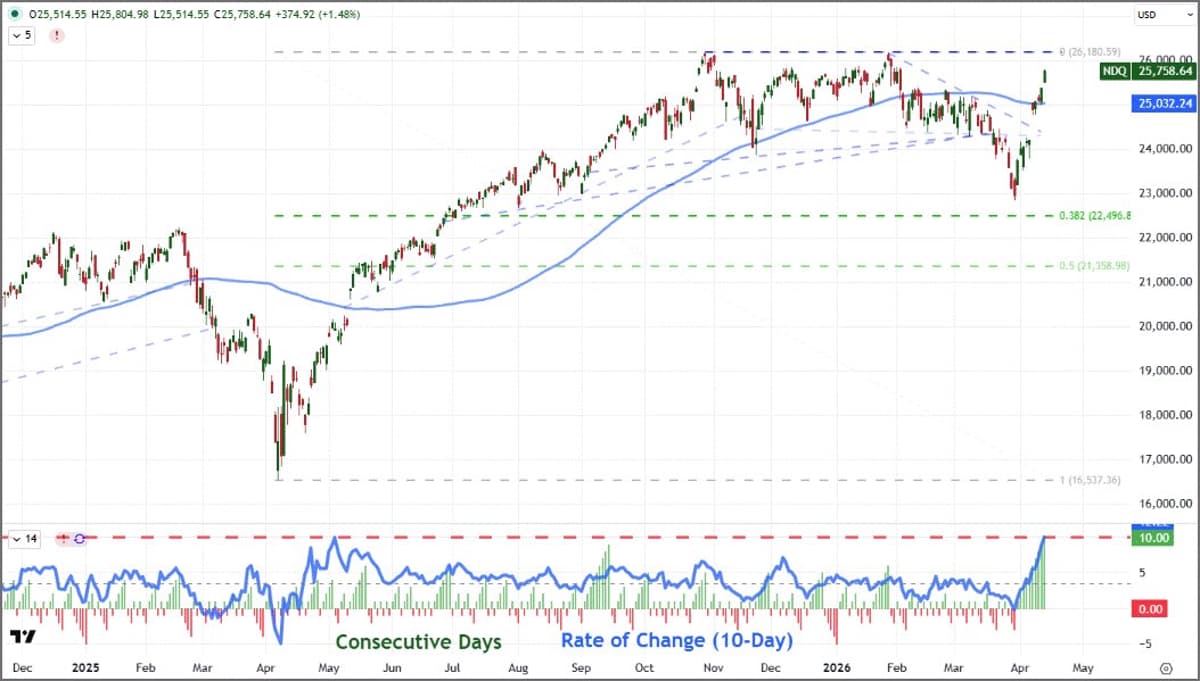
Nasdaq 100 Posts First 10-Day Streak Since 2021
The Nasdaq 100 is tearing higher... Still a little distance from its record high close - much less intraday high - but 10 consecutive days advance (first since Nov 2021) and a 12% 10-day rally. Impressive. $NDQ https://t.co/A6kmB0p8TC