
RSI Drop Trading Strategy
The RSI Drop Trading Strategy is a mean‑reversion system that targets short‑term rebounds after a sharp, oversold pullback, using the Relative Strength Index as its trigger. The method was backtested on the S&P 500 from 1995 to 2025, generating 244 trades with an 81% win ratio. It delivered a 5.1% compound annual growth rate while staying in the market only 12% of the time, and produced a profit factor of 36. The approach emphasizes rule‑based entry and exit to remove emotion from trading decisions.
Silver Day Trading
On May 14, 2026, Ashraf Laidi outlined a day‑trade strategy for silver that blends three technical‑analysis methods. All three indicators—trendline support, the 38 % Fibonacci retracement, and a former resistance now acting as support—point to $84 per ounce as a pivotal...

NASDAQ – Elliott Wave Analysis
The NASDAQ‑100 has climbed to roughly 29,500, rebounding from the April 2025 panic trough near 17,700. That drop represented about a 50 percent retracement of the C‑wave in a classic A‑B‑C correction. Since the low, the index has generated one of the...

🎯Take Profit Alert: HOOD and ASTS Cash Secured Puts
The Options Oracle trader closed two cash‑secured put positions, realizing strong returns on Robinhood (HOOD) and AST SpaceMobile (ASTS). The HOOD put generated about $200 profit, an 82.5% return on the $243 premium collected, with 18 days remaining. The ASTS...
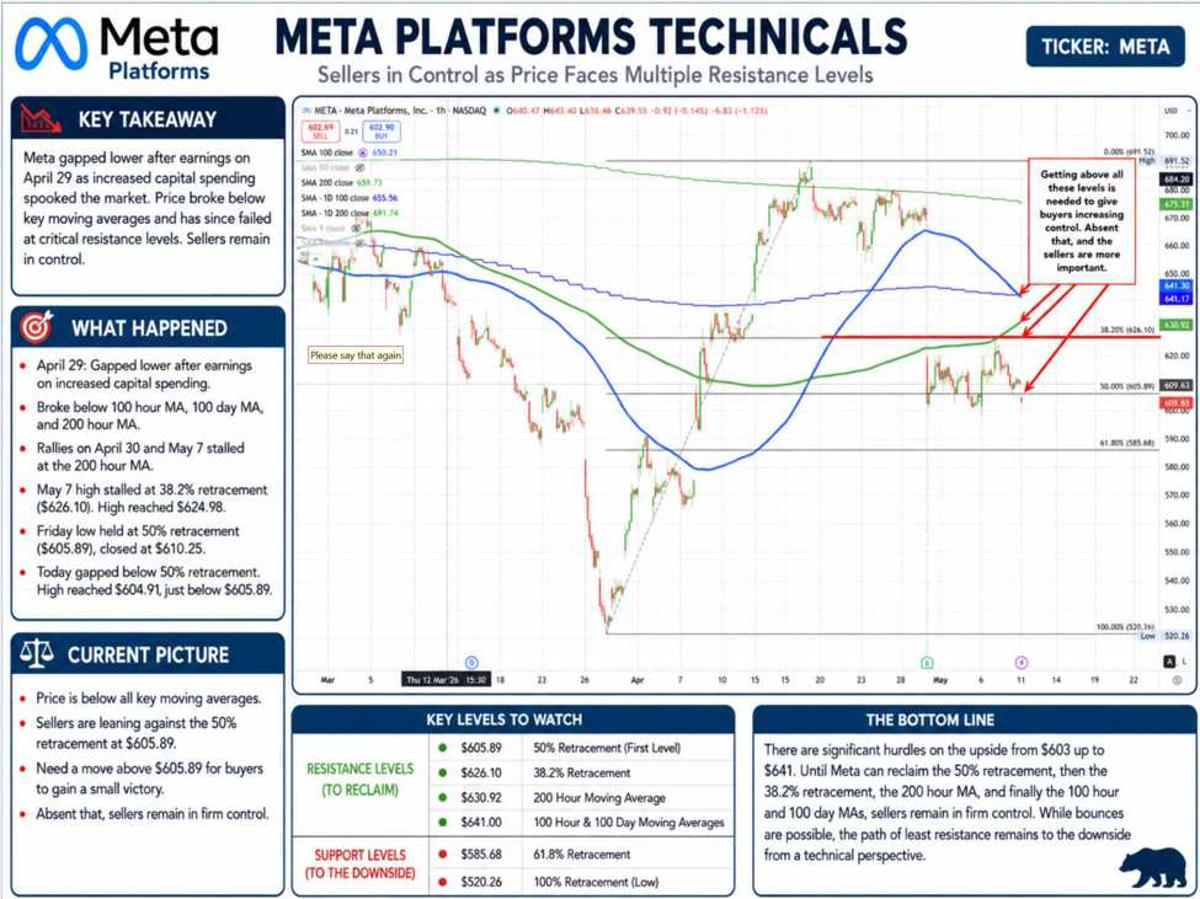
Why the Technicals for Meta Platforms Are Troubling for Investors
Meta Platforms’ shares plunged after its April 29 earnings, where the company disclosed higher capital‑spending plans that alarmed investors. The drop pushed the stock below its 100‑hour, 100‑day and 200‑hour moving averages, eroding the technical foundation. Subsequent rally attempts on April 30...
BTC - Weekly RSI Levels Now at 50
Bitcoin’s weekly Relative Strength Index (RSI) reached the neutral 50 mark as of May 11 2026, signaling a balance between bullish and bearish pressure. Analyst Paul Webborn notes that he has been positioning his portfolio since February 5 2026, using a 26‑minute multi‑timeframe Elliott Wave...

InvestingLive Academy Launches Essentials of Technical Analysis
investingLive has launched a new three‑hour masterclass, Essentials of Technical Analysis, on its ILAcademy platform. The course, taught by market analyst Giuseppe Dellamotta, covers price‑action reading, market structure, and disciplined risk management across four concise lessons. It targets retail traders...

4 Trade Ideas for NVIDIA: Bonus Idea
NVIDIA (NVDA) is trading near its all‑time high with technical indicators turning bullish: Bollinger Bands are shifting upward, RSI is in the bullish zone, and MACD is crossing higher. The stock faces immediate resistance at $217, with a measured upside...

Gold Daily Call for May 11th, 2026
Gold opened on May 11, 2026 with a gap down and is now testing support around $4,650‑$4,660 per ounce. The 4‑hour stochastic indicator is edging into oversold territory, suggesting a possible short‑term bounce toward the 50‑day moving average rather than...
Meb Faber’s Momentum and Trend-Following Strategy For Gold, Stocks, And Bonds
Meb Faber’s 2015 momentum‑and‑trend‑following model allocates across gold, equities and bonds, rebalancing monthly or quarterly based on six‑month performance. Back‑testing from 2010 through 2025 shows a compound annual growth rate of 8.7% with 92% market exposure and a modest 15%...

TMTB Weekly
The Nasdaq-100 (QQQ) has rallied for six straight weeks, nearing a 30% gain, while the Philadelphia Semiconductor Index (SOX) is up about 65% since early April. SOX’s RSI sits at 80 and it trades 55% above its 200‑day moving average,...

Indicator of the Day (Video): Pring Emerging Market Diffusion Indicator
The Pring Emerging Market Diffusion Indicator (EOD) provides a visual measure of how broadly price moves are shared across emerging‑market equities. The chart displays a black line for market diffusion and a red line for trading volume, covering the period...

Another All Time High For SPX. Where To Next Week? May 11 Plan
The S&P 500 e‑mini (ES) surged past 7400, marking another all‑time high after a classic "Failed Breakdown" at 7213. The newsletter explains that institutions use such breakdowns to trap short sellers and accumulate long positions. Recent price action confirmed the...

Elliott Wave Analysis of EURUSD – May 11th, 2026
The euro‑dollar pair climbed last week as markets priced in a possible US‑Iran peace deal, easing concerns that the Federal Reserve would need to resume aggressive rate hikes. Analysts argue the rally reflects reduced geopolitical risk rather than fundamental euro...

Elliott Wave Analysis of USDCAD – May 11th, 2026
USDCAD climbed during the first week of May 2026, pushing the pair toward the 1.3600‑1.3650 range. Analysts highlighted a key resistance level near 1.3700 that could determine the next directional move. An Elliott Wave count frames the rally as a...
Weekly S&P500 ChartStorm - 10 May 2026
Callum Thomas’s weekly ChartStorm notes that the equal‑weighted S&P 500 has stalled at a key resistance level while the cap‑weighted index is once again outperforming it. He warns that the market may be entering a blow‑off top phase, a classic late‑cycle...

Indicator of the Day (Video): DOW Swenlin Trade Oscillator – Breadth
The Dow Swenlin Trade Oscillator – Breadth (STO‑B) was highlighted as today’s market indicator. The chart spanning January 2024 to May 2026 shows STO‑B swinging sharply between positive and negative values while the S&P 500 maintains a steady upward trajectory. Such divergence suggests...

Weekly Stat Review: Weekly Winners, Losers and 52W Highs and Lows
Maj introduced a new Weekly Stat Review that will be published every Friday, featuring the top weekly winners, losers, and 52‑week highs and lows from his micro‑cap quality index platform. The tables pull from a curated universe built on a...
💡Trade Idea for Friday May 8, 2026
The author is rotating back into a stock that beat earnings but was punished by the market, using the Wheel options strategy. By selling a cash‑secured put at a strike below the current price, they aim to collect premium while...
Another Week Delivered at Elliott Wave 2.0
Elliott Wave 2.0 released 22 structured updates this week, covering macro, metals, indices and a broad set of cryptocurrency assets. The team highlighted daily signals for major coins such as Bitcoin, Ethereum, Ripple and Solana, as well as emerging altcoins...

Why Momentum Investing Has Been Struggling—And What Volatility Has to Do With It
Academic research by Haim Mozes links the surge in VIX volatility spikes to the recent underperformance of momentum investing. Over the 1994‑2024 period, spikes became more frequent and reversed twice as fast in the 2014‑2024 decade, reflecting heightened market efficiency....

Where Is Money Flowing Today?
The latest Finviz heat‑map reveals capital gravitating toward large‑cap technology and clean‑energy firms, while traditional energy and consumer staples lag behind. Green‑shaded rectangles dominate the upper‑right quadrant, indicating strong price gains in AI chipmakers, cloud software, and solar equipment. Red‑colored...

Don’t Let the Market Control Your Trades: Why Timing Matters in Trading
The article stresses that timing is a critical, often neglected, component of successful trading. It explains how overlooking scheduled economic releases, trading against prevailing trends, and holding positions into weekends can increase risk and force reactive decisions. By integrating an...

Why Backtests Decay: Regime Dependence and Crowding
A new study of 1,726 commercially marketed strategies from ten global institutions (2009‑2025) finds that backtested performance typically erodes by 2‑3% per year once the strategy goes live. The analysis shows that most of the apparent skill in backtests stems...
TMTB EOD Wrap
The QQQ index slipped 12 basis points as high‑beta momentum stocks tumbled 8%, while the broader S&P and Nasdaq fell less than 0.5%. Semiconductor names dropped 3% versus a 3% gain in software, widening the sector spread. Earnings misses from...
XRP - Anatomy of the Final Push
The article charts XRP’s price trajectory from its 2018 peak to the present, using technical analysis to map out future price targets through 2027. It argues that, despite ongoing legal battles and adoption narratives, the token is poised for one...

What’s Next for ICE and Private Prisons? Clues From 8-Ks
CoreCivic and GEO Group reported Q1 2026 earnings that were buoyed by sharply higher contracts with U.S. Immigration and Customs Enforcement (ICE). GEO Group’s stock jumped nearly 15% after it disclosed a $60 million skip‑tracing contract and expanding secure‑services work, while...

Get Grant's Bull Market Checklist — Free PDF + Daily Market Read (RB)
Quantitative analyst Grant Hawkridge has launched a free daily market briefing called The Daily Number, paired with a Bull Market Checklist PDF. The service sends subscribers a single, data‑driven statistic, a clean chart, and a concise takeaway each trading day,...
💡Trade Idea for Thursday May 7, 2026
The author proposes a cash‑secured put on a high‑momentum stock, selecting a strike well below the market price to capture premium as a buffer. The trade shows a 76% probability of the option expiring worthless and an 80% probability of...
Gold Daily Call for May 7th, 2026
Gold is rallying toward the $4,800 per ounce mark, nudging just above its 50‑day moving average of $4,799. The 4‑hour stochastic oscillator signals an overbought condition, suggesting momentum may be peaking. Traders are advised to let existing long positions run...

Indicator of the Day (Video): NYSE Intermediate Term Breadth Momentum Oscillator
The Indicator of the Day is the NYSE Intermediate Term Breadth Momentum Oscillator (ITBM), a tool that tracks the momentum of market breadth over an intermediate horizon. Between January 2024 and May 2026 the ITBM displayed a volatile pattern of sharp peaks...
TMTB Morning Wrap
ARM reported Q1 revenue of $1.49 billion, missing consensus on both license and royalty lines, sending the stock down 7%. The company disclosed AGI CPU demand now above $2 billion, yet warned that wafer and packaging capacity constraints keep FY27 revenue guidance...

Bonds Trend Lower – Precious Metals Set Up – Uranium Forms Bullish Pattern
The provided TrendInvestorPro page is a subscriber‑only portal that offers systematic trading strategies, market‑timing models, and premium content on stocks, ETFs, and commodities. No actual market data or analysis on bonds, precious metals, or uranium is presented in the publicly...

Brittle Peace, Fragile Trends: CTAs Battle April Volatility
In April the NHX CTA Index delivered a modest positive return despite divergent outcomes among its managers and sub‑strategies. Early‑month time‑series momentum plunged amid cease‑fire‑triggered trend reversals, but steadied in the second half as a strong equity rally offset flat...

#BVL046: Another Brick Off the Wall
Bitcoin finally breached the $80,000 resistance level that has defined the current bear market, marking the first sustained move above that threshold in months. The price held steady for several sessions, avoiding the rapid snap‑back that typically follows such breakouts....

Fast Money Masterclass LIVE | May 2026
All Star Charts launched the Fast Money Masterclass Live in May 2026, featuring a live countdown and a promise of 3‑ to 10‑fold returns within days. The program is presented by Steve Strazza, a former researcher at SAC Capital and Point72,...
Ethereum (ETH/USD) – Elliott Wave Analysis
The latest Elliott Wave analysis of Ethereum (ETH/USD) combines a weekly macro view with a daily micro setup. It argues that the cryptocurrency finished a prolonged corrective bear market in 2022 and is now entering the early phase of a...

Dow Reaches 50,000. There Have Been 4 Closes Above the 50K Level
The Dow Jones Industrial Average broke the 50,000 psychological barrier, closing above it for four consecutive days in early February before a sharp correction pulled it down nearly 10% to a March low of 45,166.64. Over the next 27 trading...

NASDAQ Index Traded to a New Session High. S&P and Dow Now up over 1%
The Nasdaq surged 1.58% to 25,726, hitting an intraday high of 25,741.14, while the S&P 500 rose 1.10% and the Dow gained about 1.02% near the 49,800 level. Large‑cap technology and growth stocks led the rally, with AMD and Super...
🎯Take Profit Alert: IREN and ONDS Cash Secured Puts
Trader exits two cash‑secured put positions—IREN and ONDS—after capturing the bulk of the premium. The IREN May 22 $36 put generated $200 profit (74% return) with 16 days left, while the ONDS May 8 $8.50 put earned $57 profit (68% return) with...

Where Is Money Flowing Today?
The latest Finviz treemap shows capital flowing into AI chip makers and renewable‑energy firms, while rate‑sensitive financials and consumer discretionary lag. Double‑digit percentage gains dominate the technology sector, reflecting strong earnings and continued hype around generative AI. Energy stocks benefit...

ETF Flows Are Reshaping Bitcoin’s Recovery
Bitcoin has surged back above $80,000, closing in on its 200‑day moving average, a key technical benchmark. At the same time, equity markets are recovering, reviving risk‑on sentiment that is spilling into digital assets. The article argues that the durability...

Modeling with the NAAIM Exposure Index
The piece outlines a systematic trading model that relies solely on the NAAIM Exposure Index, a weekly sentiment survey of active investment managers. The model goes long 150% of the S&P 500 when any of three index‑based conditions are met,...

Bitcoin Update
Bitcoin’s price is testing the $87,000 level, a key recovery point that analysts say could signal the start of a new upward swing. The article highlights the high‑to‑low cycle pattern, suggesting that Bitcoin may experience heightened volatility as it moves...

Stocks To Crash By 50%+, Silver To Surge Above $300/Oz? | Michael Oliver
Technical analyst Michael Oliver warns that the S&P 500’s strong April performance is a fleeting topping spike, not the start of a new bull run. He predicts a multi‑year bear market with a 50%+ decline in U.S. equities, sharply higher...
Bitcoin: "The Top Is In" - Elliott Wave Analysis
The author argues that Bitcoin’s market peak has already formed, positioning the recent price rise as a Wave B counter‑trend bounce rather than a new bullish impulse. Using Elliott Wave theory, the analysis forecasts a likely “fool’s rally” followed by a...

Indicator of the Day (Video): NYSE Advance-Decline Volume ($NYUD)
The NYSE Advance‑Decline Volume (NYUD) indicator has logged pronounced daily swings from May 2024 through May 2026, reflecting heightened market breadth volatility. Despite the turbulence, the NYSE Composite Index ($NYA) has maintained a steady upward trajectory over the same period. The chart...

Struggling to Read the Market? Here’s How to Predict Stock and Forex Moves
The article explains how traders can improve predictions in stocks and forex by leveraging financial data. It outlines key data types—historical prices, volume, economic indicators, and earnings reports—and shows how they inform market analysis. It also highlights specific strategies such...
Silver Daily Call for May 5th, 2026
Silver briefly met the upside target suggested by an inverted head‑and‑shoulders formation, but the metal quickly retreated below the neckline, resuming a sideways consolidation. The price action remains choppy and trendless, mirroring gold’s similar behavior. A new 4‑hour stochastic buy...
The Ultimo Effect In Stocks
The "Ultimo Effect" describes a recurring tendency for equity markets to drift higher during the last few trading days of a month and the first few days of the following month. A backtest on the S&P 500, entering long positions on...