
Another Week Delivered at Elliott Wave 2.0
Elliott Wave 2.0 released 17 structured crypto analyses this week, covering assets from Bitcoin to Solana. Each update provides wave counts, validation levels, target prices and risk‑managed positioning. The service emphasizes a disciplined, non‑speculative process that prioritizes market structure over short‑term noise. Paul Webborn highlights the consistency of the approach as its competitive edge.

A Trend-Following Strategy for the S&P 500
A simple trend‑following rule—buy the S&P 500 when prices rise and exit when they fall—has endured for decades. A backtest from 1960 to present shows the method generated a 6% annual return while being invested only 65% of the time, delivering...
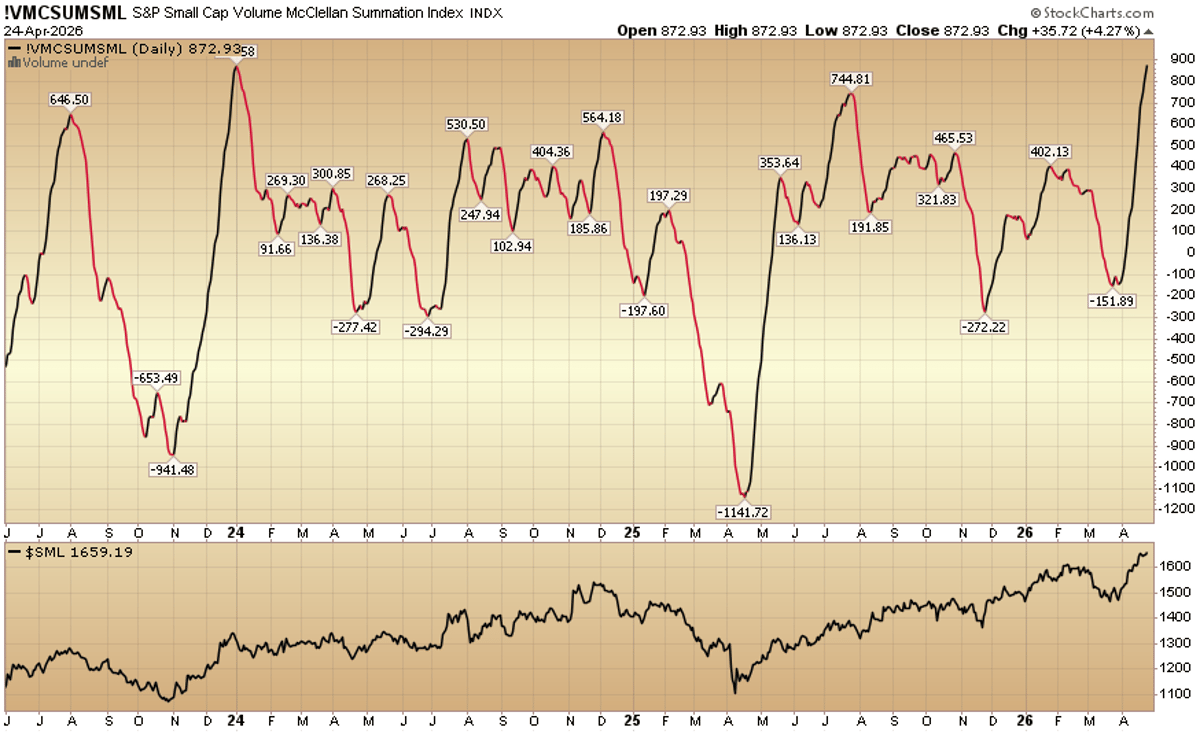
Indicator of the Day (Video): S&P Small Cap Volume Summation Index
The S&P Small Cap Volume Summation Index, also known as the McClellan Summation Index for small‑cap stocks, aggregates net advancing versus declining volume across the S&P SmallCap 600. A chart from HedgeFundTips shows the index fluctuating between modest highs and...

Dispersion Trading Using Principal Component Analysis
Dispersion trading leverages statistical arbitrage by using options on a select group of stocks rather than the whole index. The authors applied Principal Component Analysis to the S&P 500, creating a replicating option basket of as few as five securities. Their...

Tomorrow I'm Walking Through the Entire Swing & Algo System
Arun Bau will host a free 90‑minute live session on April 26, walking participants through his complete swing‑trading system, the accompanying algorithmic hedge, and a preview of the upcoming Algo Marketplace. He will demonstrate a scanner that narrows 500+ stocks...
Larry Connors %B Strategy: A Simple Mean Reversion Edge Explained
Larry Connors' %B strategy leverages the Bollinger Bands %B indicator to capture short‑term mean‑reversion moves in stocks that are in a long‑term uptrend. The rule set calls for buying when %B falls below zero, indicating an oversold condition, and exiting...

Here's What This Week's Signal Table Looks Like
The firm releases a weekly signal dashboard to paid subscribers, featuring four intermarket ratios—Lumber/Gold, Copper/Gold, High Yield/Treasuries, and Utilities/S&P 500—each evaluated over a 13‑week trend. Each ratio receives a directional reading that feeds into a composite signal indicating overall market risk...

A Full Week Of Coil For SPX. Do We Trend Next Week? April 27 Pan
Over the past month the S&P 500 e‑mini (ES) has posted a steep upside rally, with each minor dip quickly bought up. The author attributes the move to a classic "failed breakdown" pattern, where institutions accumulate during sharp, short‑lived drops...

Consus Ag Consulting Afternoon Wrap Up
Futures slipped after mixed overnight trading, led by wheat losses as technical profit taking intensified. Corn and soybeans also fell on May options expiration, while drought in the West weighed on wheat but supported planting progress for corn and soy....

🎯Take Profit Alert: CORZ Cash Secured Put
Trader closed a cash‑secured put on Core Scientific Inc. (ticker CORZ) with a $15.5 strike, collecting $87 in premium and realizing a $78 profit after seven days. The position captured 89.66% of the premium, indicating the stock stayed well above...
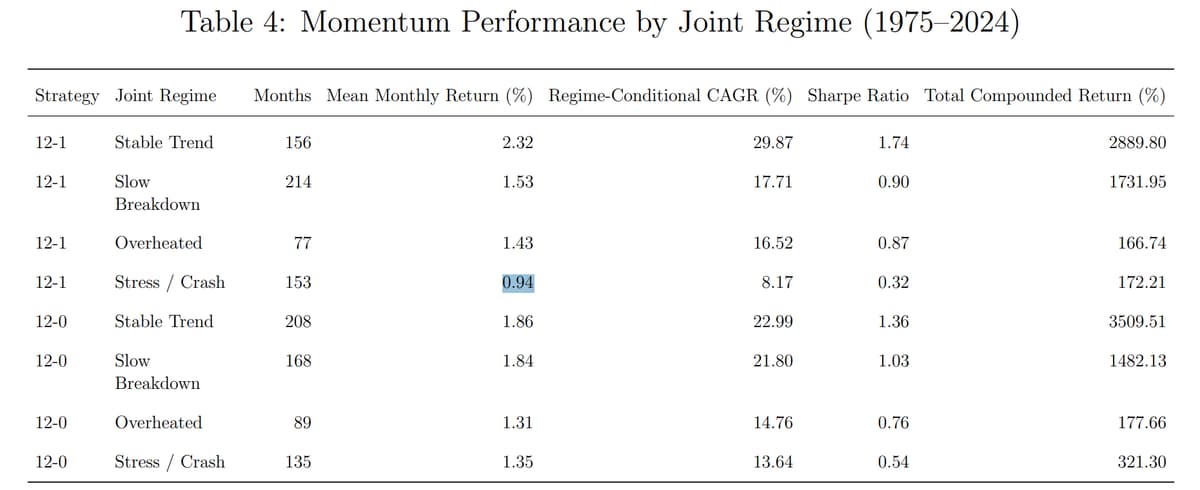
The Skip-Month Mystery: What Last Month’s Returns Are Really Telling You
A new study of 48 industry portfolios from 1975‑2024 questions the long‑standing “skip‑month” rule in momentum investing. By comparing a 12‑1 strategy that excludes the most recent month with a 12‑0 strategy that includes it, the research finds that the...
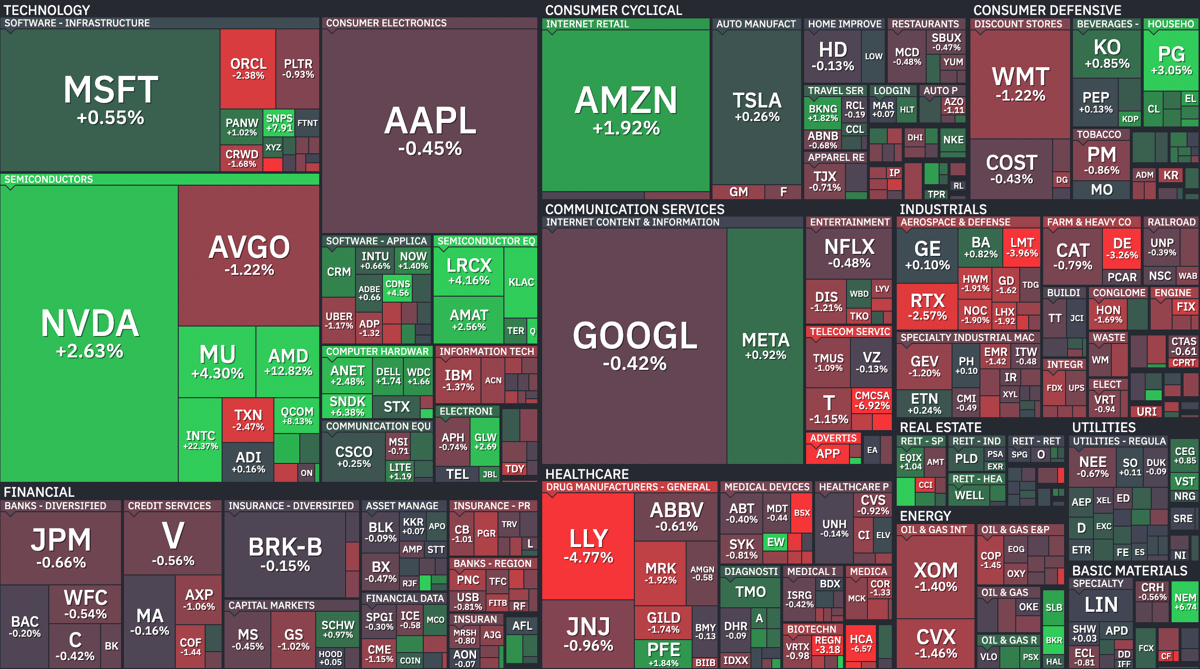
Where Is Money Flowing Today?
Finviz’s latest heat map shows capital gravitating toward mega‑cap tech stocks, with Nvidia, Apple and Microsoft posting the strongest gains. The AI‑driven semiconductor rally lifted Nvidia about 3%, while Apple and Microsoft each rose over 2% on robust earnings. In...
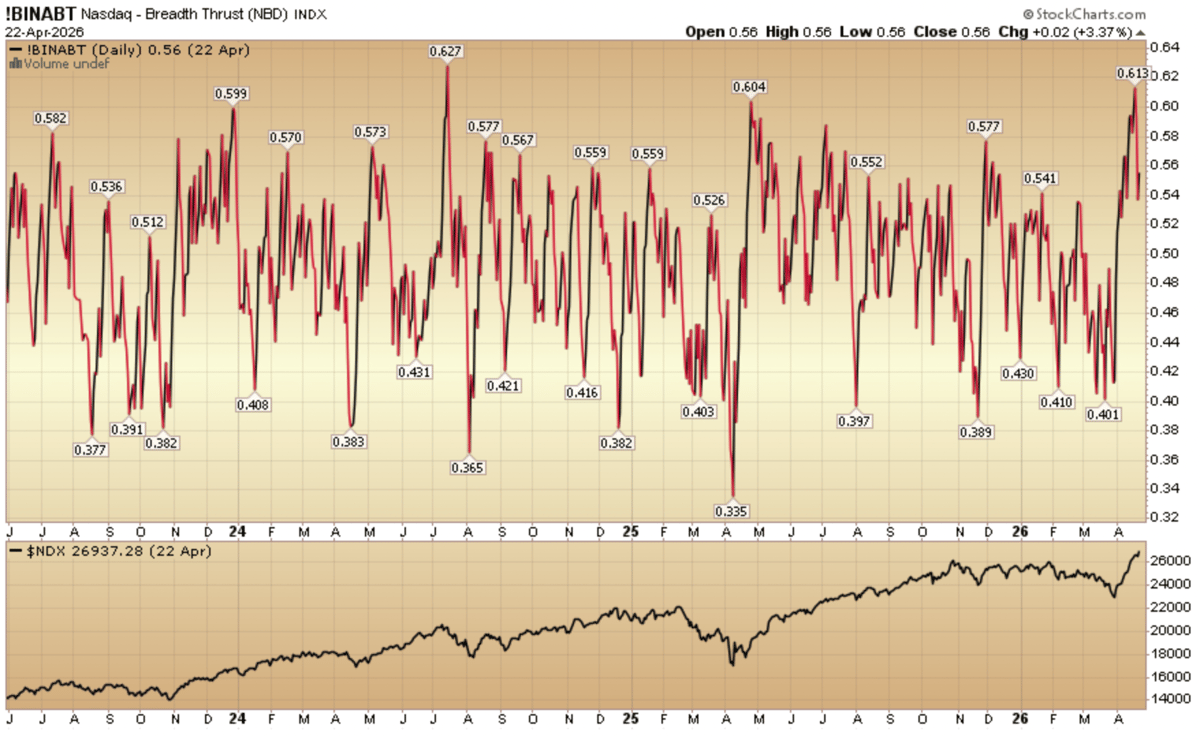
Indicator of the Day (Video): Nasdaq – Breadth Thrust
The Hedge Fund Tips brief spotlights the Nasdaq Breadth Thrust (NBD) indicator, pairing it with a dual‑chart that tracks the metric against the Nasdaq Composite from August 2023 through April 2026. Breadth Thrust gauges the ratio of advancing to declining Nasdaq stocks,...

Gold Daily Call for April 24th, 2026
Gold prices continued a choppy, sideways-to‑slightly‑lower pattern on April 24, 2026, as the metal entered a corrective phase. The market appears to be establishing a floor rather than launching a deep sell‑off, with momentum clearly fading. Trading data shows a...

Stocks Out of Fuel
Equity markets are hitting a critical resistance level as the price rally loses steam. The inflows that propelled recent gains are fading, leaving the market increasingly dependent on speculative buying. Positioning has become crowded, creating a fragile environment where a...

Decoding April 23 Market Drop: Hero’s $2 Billion Delta Shift, Trace Map Insights, and Strategic Options Flow Analysis
On April 23 the S&P 500 slipped about 1.2%, a move anchored by a $2 billion delta shift in options on the ticker HERO. SpotGamma’s trace‑map visualized a surge of put buying at key resistance levels, signaling aggressive bearish positioning. The flow...
🎯Take Profit Alert: IREN Cash Secured Put
A trader closed a -2 May 8 $29 cash‑secured put on IREN after capturing 84.58% of the $240 premium, realizing a $203 profit with 15 days left to expiration. The underlying stock moved well above the strike, rendering the put deep...
![Hedge-Fund Meme-Stock Short-Squeeze Queen Avis Budget [CAR] Implodes by 72% in 26 Hours](https://hixhlmpcokxhartfkpyi.supabase.co/storage/v1/object/public/images/thumbnails/b638a186b625756cebd28ddc098bddd8.webp)
Hedge-Fund Meme-Stock Short-Squeeze Queen Avis Budget [CAR] Implodes by 72% in 26 Hours
Avis Budget Group, a traditional car‑rental firm, saw its stock explode 770% from $97 to $847 between early March and April 23, only to tumble 72% in roughly 26 hours, settling around $229. The surge was driven by two hedge...
💡Trade Idea for Thursday, April 23, 2026
A trader proposes selling a put option just below a historically strong support level, aiming to collect premium while the stock remains above that zone. The trade boasts a 74% probability of worthlessness (POW) and a 78% probability of profit...
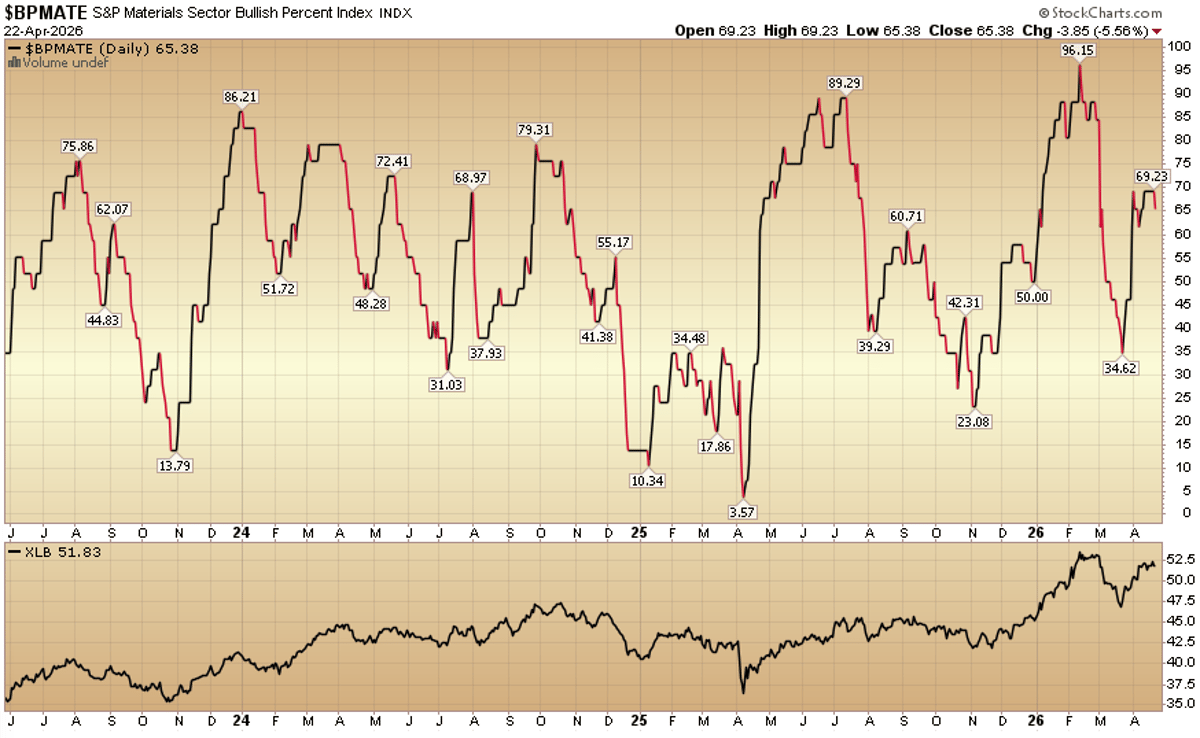
Indicator of the Day (Video): Bullish Percent Materials
The article spotlights the Materials Sector Bullish Percent Index (BPMATE), which has shown a volatile swing from January 2024 through April 2026. BPMATE measures the percentage of materials stocks trading above their 200‑day moving average, offering a breadth gauge for the sector....

Bearish Setups in Bonds – Gold Follows Bonds – Bitcoin Hits Bearish Setup Zone
The latest market commentary highlights bearish setups across three major asset classes. U.S. Treasury yields are climbing, signaling a downtrend in bonds. Gold is tracking the bond weakness, slipping lower as investors lose confidence in safe‑haven demand. Bitcoin has entered...
Bitcoin Momentum Strategy
A backtest of a simple Bitcoin momentum strategy covering 2015‑2026 shows the model generated 257 trades with an average 2% gain per trade. Each position was held roughly three days, delivering a 44% annualized return and a striking 321% risk‑adjusted...
Chart of the Week - Bitcoin & Software
The latest Weekly ChartStorm chart shows Bitcoin and software stocks halting their steep declines and beginning to exhibit bullish technical signals. After price resets of roughly 50% for Bitcoin and over 35% for software equities, both assets have found firm...

Systematic Funds Drive Record $86 Billion Equity Buying Spree as Algorithms Reassert Market Dominance
Systematic and trend‑following funds poured an estimated $86 billion into global equities over the past week, creating one of the largest short‑term buying waves on record. The surge was driven by technical breakouts, falling volatility and easing geopolitical tensions, which triggered...

TMTB EOD Wrap
The QQQ ETF rose 1.7% to fresh all‑time highs as AI‑driven enthusiasm fuels market momentum. Semiconductors outperformed, gaining roughly 3%, while software lagged after disappointing earnings from ServiceNow and IBM. Texas Instruments surged 10% following better‑than‑expected results and guidance, contrasting...
XRP - Prepare Now or Regret Later
In a blog post dated April 22, 2026, Paul Webborn urges XRP investors to position themselves before an anticipated breakout. He notes that Bitcoin continues to dominate market sentiment, which could constrain XRP’s short‑term moves. Webborn announces a detailed multi‑timeframe...
💡Trade Idea for Wednesday, April 22, 2026
Edward Corona proposes a wheel‑strategy trade for April 22, 2026, selling a cash‑secured put that offers a 3.56% premium over 30 days, which translates to roughly a 53% annualized return. If the stock falls, the put may be assigned, allowing the trader to...
Regime Classification Framework for Mean-Reverting and Trending Markets
The paper introduces a regime‑classification framework that labels markets as mean‑reverting or trending, using return thresholds of 0.5%, 0.75% and 1% on SPY, QQQ, DIA and IWM from 2000‑2024. Three machine‑learning models—Random Forest, Neural Network (MLP) and XGBoost—are tested with...
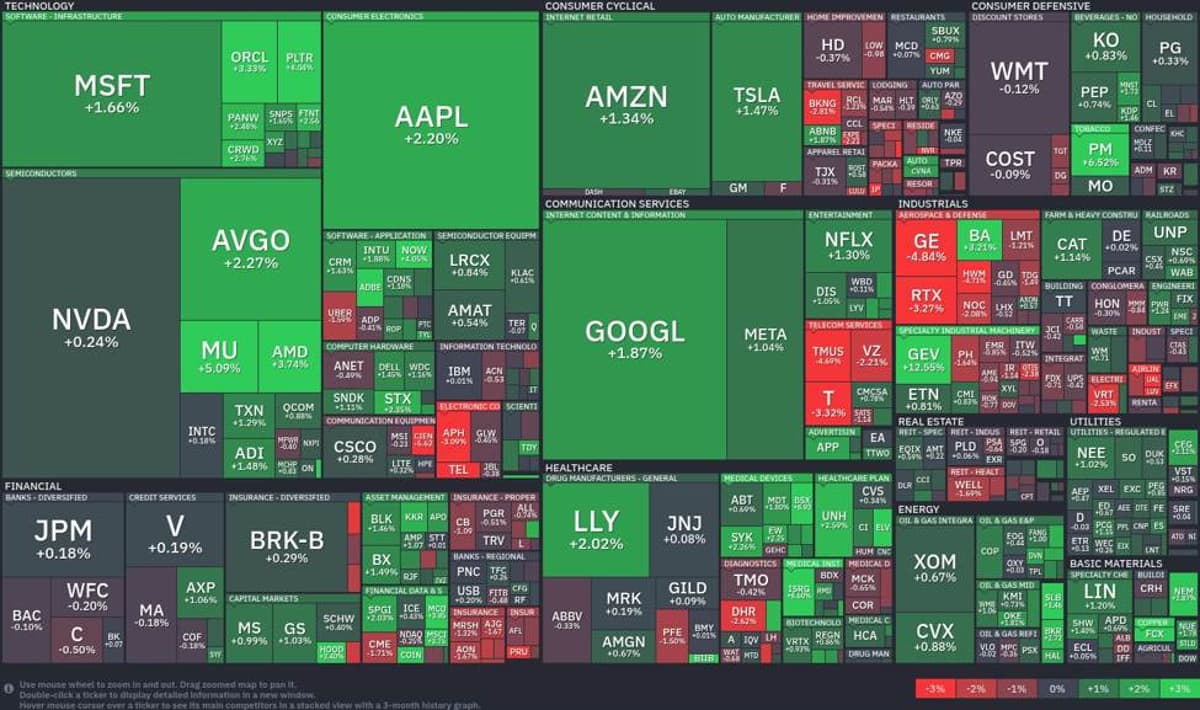
Tech Giants Surge as Semiconductors Lead a Bullish Wave
Tech and consumer‑cyclical stocks led a broad market uplift, with semiconductors at the forefront. Micron jumped 5.09% and AMD rose 3.74%, while Apple gained 2.20% on strong sales outlooks. Big‑tech giants Microsoft and Alphabet each added around 1.7%, and Amazon...
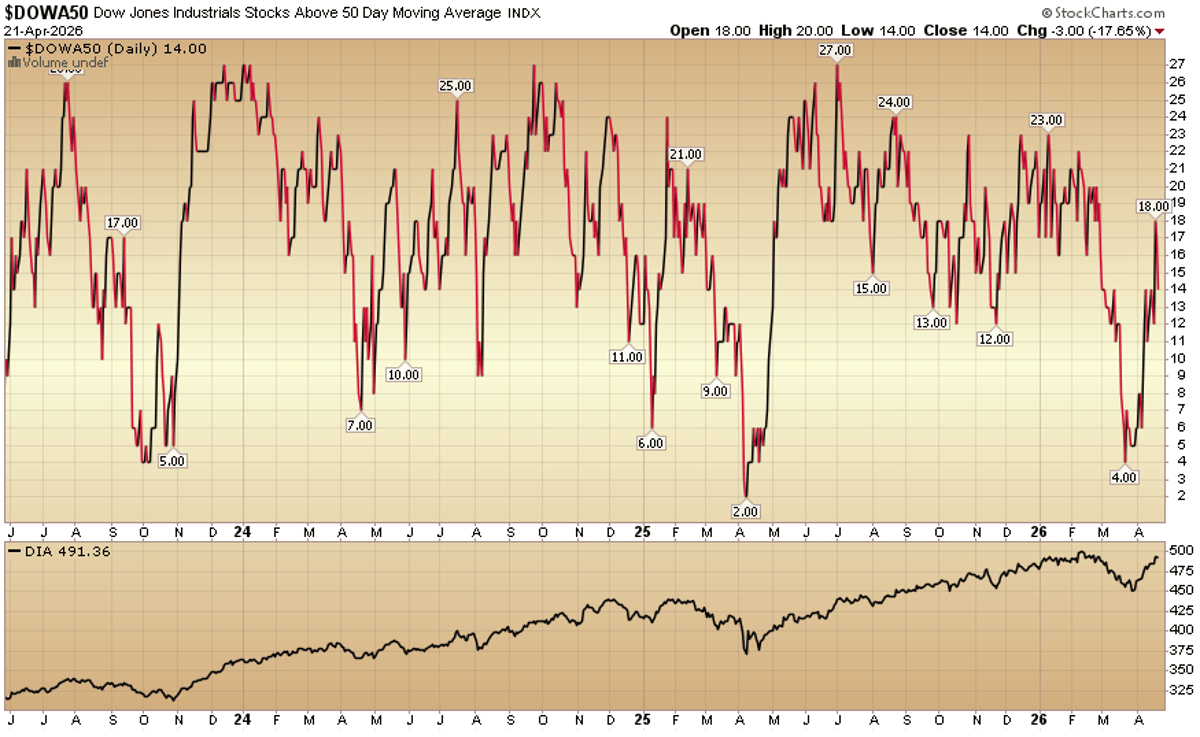
Indicator of the Day (Video): Dow Jones Industrials Stocks Above 50 Day MA
The Dow Jones Industrial Average (DJIA) has risen above its 50‑day simple moving average, a technical signal often interpreted as bullish momentum. The crossover occurred amid a broader rally in industrial stocks, with the index trading near 491 points. Analysts...
🎯Covered Call Trade Management Alert
Edward Corona’s Options Oracle alerts subscribers to a new covered‑call position on Kratos Defense & Security Solutions (KTOS). He sells one May 15, 2026, $83 call for a $2.13 per‑share premium, netting $212.50 in income. The trade is positioned to capture upside...

Bitcoin Climbs to the Highest Since Early February
Bitcoin surged past the $65,000‑$66,000 zone, marking its highest level since early February and hinting at a potential breakout toward the $90,000 resistance line. The rally follows a series of higher lows and higher highs that suggest sustained upward momentum,...

Elliott Wave Update of USDCAD – April 22nd, 2026
The USDCAD pair has slipped for the third consecutive week, hovering around the 1.3600 level. Elliott Wave analysts note that this support zone remains intact, but a decisive break could trigger further downside. Market participants are watching for a bearish...

Elliott Wave Update of EURUSD – April 22nd, 2026
The latest Elliott Wave updates show divergent market dynamics as of April 22‑26, 2026. WTI crude oil is rallying on renewed fears that the US‑Iran cease‑fire may collapse, while Bitcoin has logged a fourth straight weekly gain, positioning it for a double‑digit...

An Interesting Setup in Copper & Silver
The author’s Synthetic Silver Price Index (SSPI) ties copper to silver, confirming that silver’s long‑term bull market remains intact despite a January correction. Copper recently broke out of an ascending triangle, a classic bullish pattern, reinforcing the uptrend. Because the...

10 Oversold Tech Stocks to Buy According to Analysts
Analysts have identified ten oversold tech stocks that have dropped at least 35% in the last three months but show an average upside of 35% or more. The article spotlights Klarna Group’s new buy‑now‑pay‑later integration with Aven Hospitality and Yext’s...

Green Lights, One Yellow
The S&P 500 surged 4.5% this week, closing at 7,126.05 – its highest level since January – driven by strong Q1 earnings and optimism around the U.S.-Iran ceasefire. Three of the four proprietary signals (Beta Rotation, Treasury Rotation, and the...

This Isn't Trading. It's Theft From Your Retirement.
The post alleges that Donald Trump’s public statements and policy moves in 2025‑2026 triggered massive, precisely timed trades that enriched insiders while wiping out trillions in market value. Notable examples include a $500 million crude‑oil futures dump before a cease‑fire announcement,...
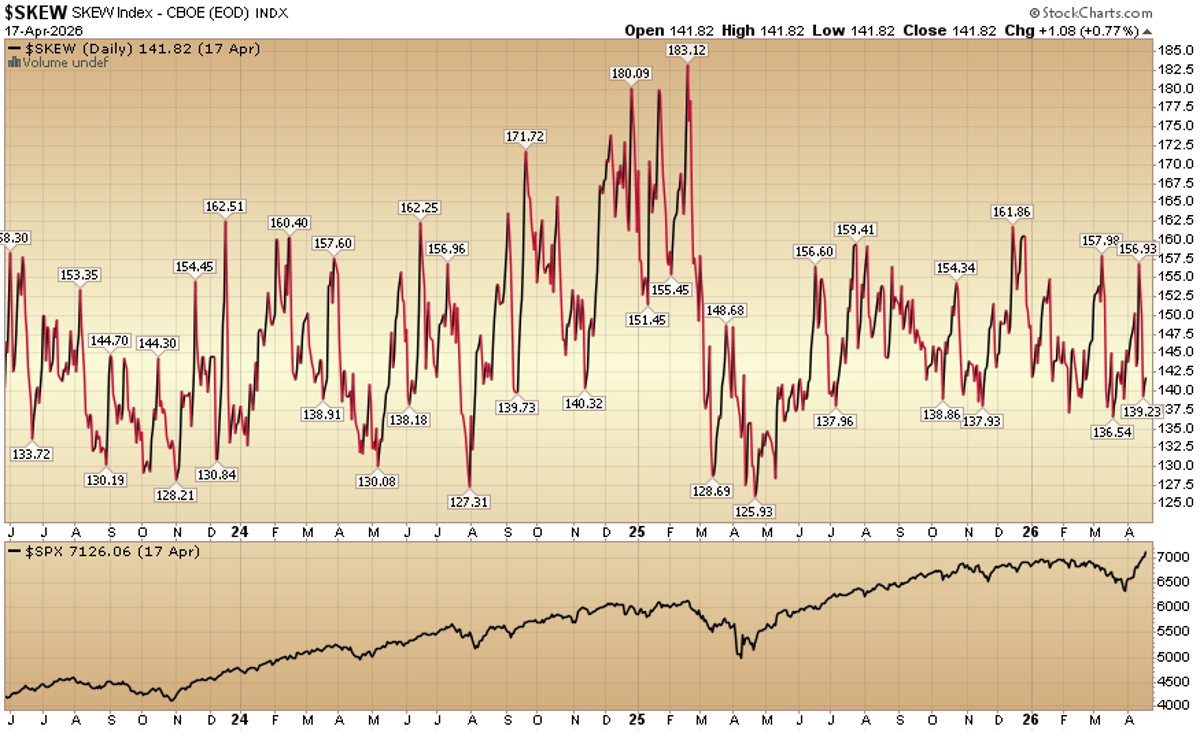
Indicator of the Day (Video): CBOE Skew Index
The CBOE Skew Index, a gauge of tail‑risk pricing in the options market, is currently swinging between 125 and 185 while the S&P 500 continues its upward trajectory. The index’s sharp fluctuations suggest that investors are demanding higher premiums for downside...

RaveDAO: Watch, Don’t Touch. Not Even with Chump Change.
RaveDAO (RAVE) token rocketed from $0.25 to $27.94—a 10,800% gain—in just two weeks before crashing 95% in under 24 hours. On‑chain analysis revealed that roughly 90% of the token’s one‑billion supply sits in three wallets linked to the project team,...
Bollinger Band Squeeze Trading Strategy
The Bollinger Band Squeeze strategy exploits periods of unusually low volatility, identified by narrowed upper and lower bands, to anticipate large price moves. Traders wait for a breakout beyond the bands, often confirming with volume or momentum, and then enter...

Is the Market or Trump the Crazier?
The latest market chatter pits a wildly volatile tech sector against former President Donald Trump’s erratic public statements. Tech stocks have surged and slumped on thin fundamentals, with AI‑driven valuations soaring despite mixed earnings. Simultaneously, Trump’s unpredictable commentary on policy...

MAJOR BANKS PREDICT SILVER PRICE EXPLOSION: The Sentiment Reset, the Unsolvable Deficit, the Byproduct Trap, the Historic Demand Stack, &...
Silver has settled into a tight $70‑$80 range, creating a solid technical base after a parabolic rally. The sideways action reset market sentiment, flushing out speculative hands and leaving a coiled chart ready for a breakout. Physical fundamentals are tightening,...
🎯 Covered Call Trade Management Alert For $HIMS
Trader Edward Corona reports that his covered calls on Hims & Hers (HIMS) expired worthless, allowing him to retain the full premium. With the stock posting another strong green day, he is re‑entering the wheel by selling a new call...
💡Trade Idea for Monday, April 20, 2026
A trader recommends a short‑dated put on a stock that’s trending higher but has pulled back, offering a clean entry before upcoming earnings. The position is placed well below the current price, targeting premium collection with a 73% probability of...
4 Trade Ideas for Citigroup: Bonus Idea
Citigroup (C) is trading near $132.18, just below a key resistance level at $132.50 and still needs to break $90 to recover 38.2% of its post‑crisis decline. Technicals are bullish, with RSI deep in the over‑bought zone and a rising...

I Bought FIX at $380. It's Up 330%. Here's Why I'm Still Not Selling
In April 2025 the author bought Comfort Systems USA (FIX) at $380 after a market sell‑off in AI‑related infrastructure stocks. Over the next twelve months FIX surged to $1,637, delivering a 330% return while the S&P 500 rose about 12%...

Beyond the Momentum - Selling the Greed
U.S. equity markets surged for a third straight week, with the S&P 500, Nasdaq Composite and Russell 2000 all posting new all‑time highs. The Nasdaq logged a 13‑session winning streak, its longest run since 1992, while crude oil prices plunged...
Is The Death Cross The Kiss of Death?
A Death Cross occurs when the 50‑day moving average falls below the 200‑day average, a signal often linked to bearish market expectations. The article backtests the S&P 500 from 1960 onward, finding only 33 Death Cross events with an average...

The “Super Bowl of Earnings” Is Here: Why Hedge Funds Are Pushing Exposure to the Edge Ahead of a Defining...
Wall Street is gearing up for what’s being dubbed the “Super Bowl of Earnings,” as nearly 43% of the S&P 500 by market cap will report results in the final week of April. Hedge funds such as Citadel, Millennium and...