
5 Trade Ideas for Monday: Agilent, CIENA, Dollar General, Fedex and Champion Homes
The latest trade note highlights five equities—Agilent Technologies, Ciena, Dollar General, FedEx and Champion Homes—each positioned near key technical resistance levels as of Monday, April 20, 2026. Agilent, Ciena and FedEx all display bullish RSI readings and positive MACD momentum, suggesting a potential breakout. Dollar General is breaking short‑term resistance despite a neutral RSI and negative MACD, while Champion Homes is rounding a pullback with RSI climbing above the midline. The author ties these setups to a broader market rally driven by a post‑options‑expiration boost and improving macro sentiment.

📅 Weekly Schedule - This Week’s Elliott Wave Video Updates
Elliott Wave 2.0 announced a new Asset Request Service offering five weekly slots at $100 per asset, expanding its structured analysis beyond the core video updates. The weekly video schedule details daily crypto coverage, while the firm reiterates its disciplined,...
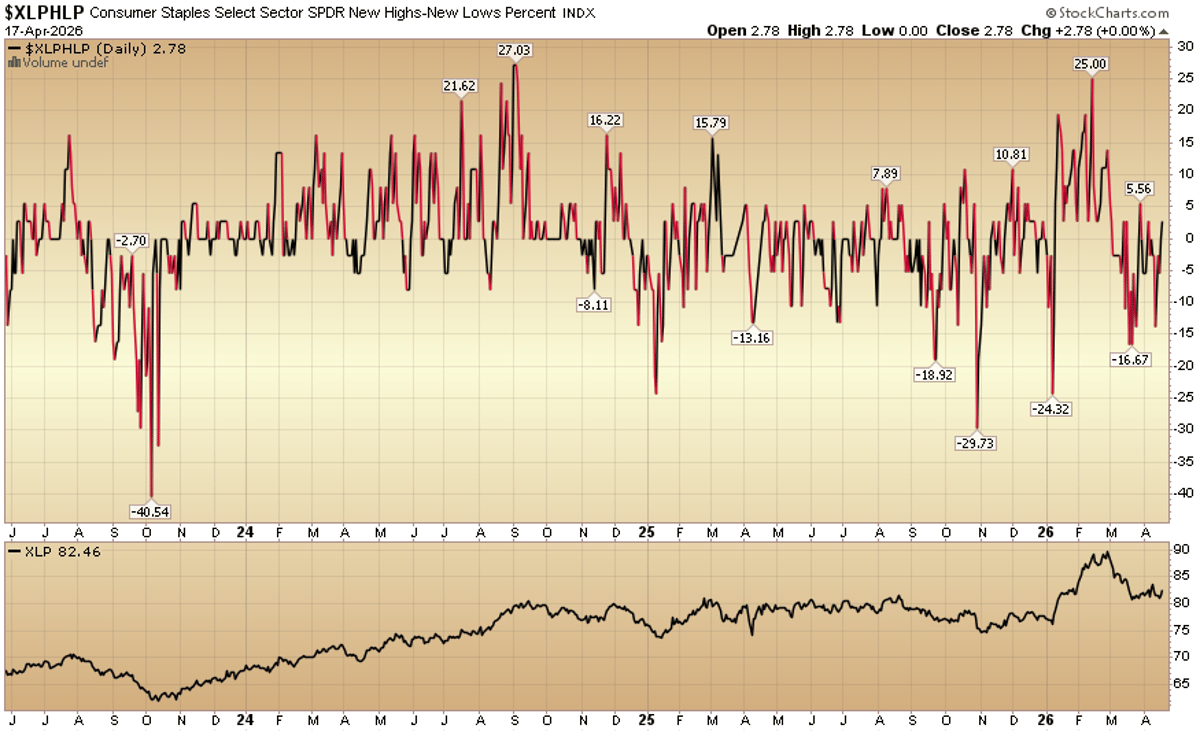
Indicator of the Day (Video): Consumer Staples New High New Low %
The daily "New Highs minus New Lows" percentage for the Consumer Staples Select Sector SPDR (XLP) has been tracked from July 2023 through May 2026. The chart shows the breadth of the sector, highlighting periods when more stocks hit fresh 52‑week highs...

🎬 Netflix ($NFLX) Deep Dive
Netflix posted a strong quarter, with revenue surpassing forecasts, solid subscriber growth, record engagement levels, and clear pricing power. Despite the upbeat results, the stock slumped nearly 10% in one session. The sell‑off reflects investor worries about future subscriber momentum...

Weekly S&P500 ChartStorm - 19 April 2026
The S&P 500 rebounded to fresh all‑time highs after a modest sub‑10% dip, signaling a "healthy correction" rather than a deep bear market. Q1 saw hedge funds dramatically trim long positions and increase shorts, pushing the longs‑vs‑shorts ratio to its lowest...
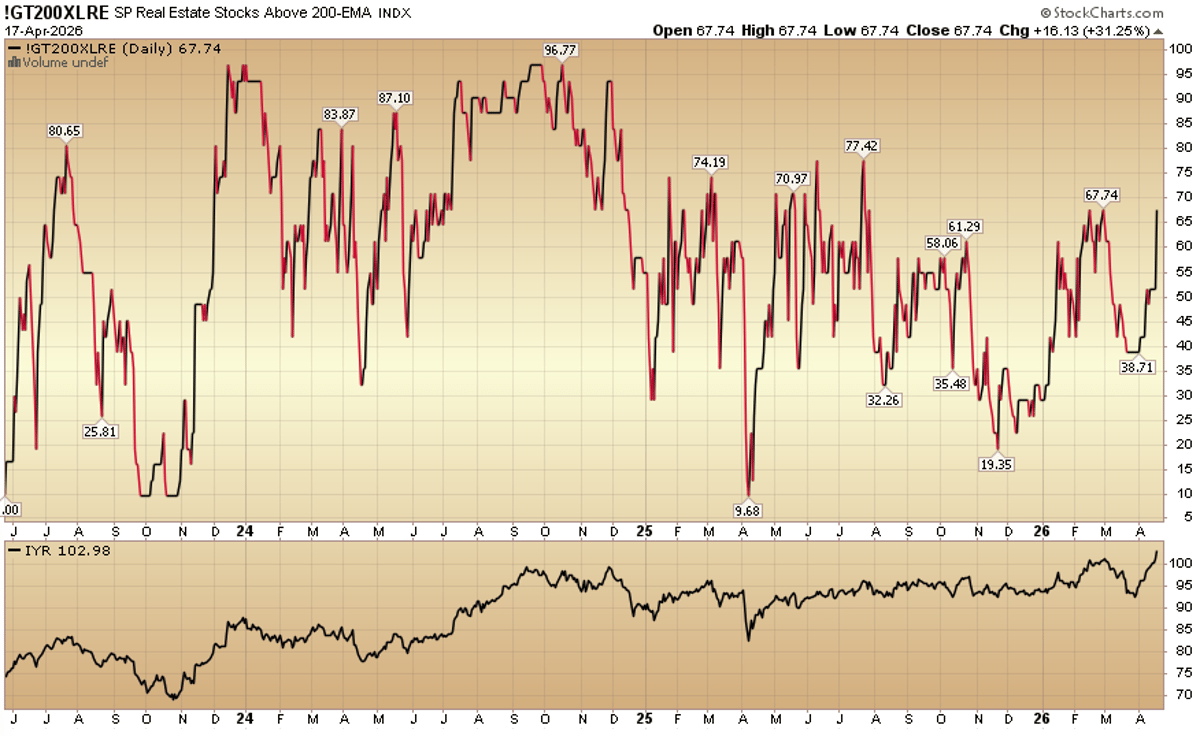
Indicator of the Day (Video): S&P Real Estate Stocks Above 200 EMA
The S&P Real Estate Index breached its 200‑day exponential moving average on April 17, 2026, signaling a technical shift toward bullish momentum. The crossing suggests that the sector may experience a sustained price rally, as the 200‑EMA is widely watched...
📊 Weekly Market Wrap 4/17/2026
The U.S. equity market posted a robust week ending April 17, with the S&P 500 up 4.5%, Nasdaq climbing 6.8% and the DJIA gaining 3.2%. The rally was driven by a cascade of macro events: easing geopolitical tensions lowered oil...

Investing Update: I Told You So
The S&P 500 and Nasdaq each closed at record highs, the Nasdaq logging its longest 13‑day winning streak since 1992. From the March 30 lows, the S&P 500 surged 13% in just 14 trading sessions, while the Russell 2000 led major...

Consecutive Down Days Strategy
The article outlines a rules‑based "consecutive down days" strategy that buys stocks after short‑term weakness within a longer‑term uptrend and sells into overbought conditions. Backtests on the semiconductor ETF SMH show 121 trades with a 1.5% average gain, 78% win...

3 Numbers of Oil & JPY
Ashraf Laidi’s latest market note ties three oil‑related numbers to a specific date and uses them to justify a short USD/JPY position, targeting the 157.70 level. The trade, still valid for readers who receive the note late, reflects his inter‑market view...
Another Week Delivered at Elliott Wave 2.0
The blog promotes Elliott Wave 2.0, a subscription‑style analysis that delivers more than 50 structured wave updates each month across macro, metals, indices, stocks and multiple crypto categories. Each weekday the team publishes disciplined signals for assets such as BTC, ETH,...
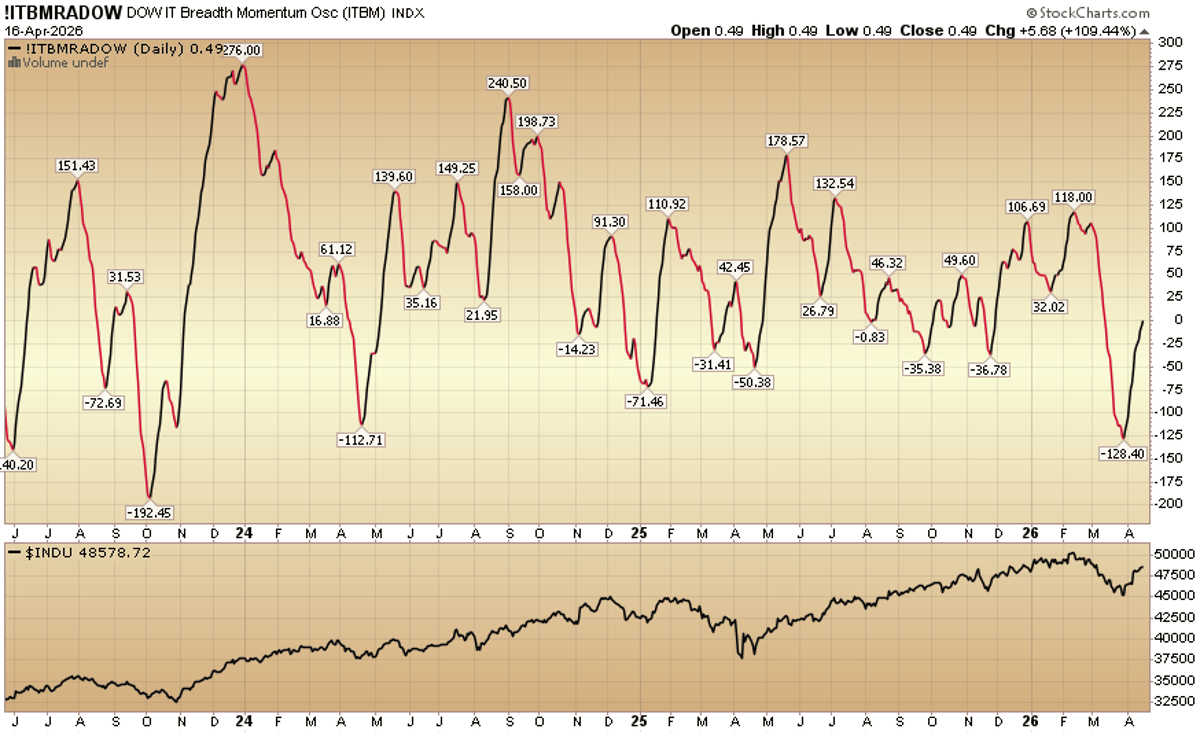
Indicator of the Day (Video): DOW Intermediate Term Breadth Momentum Oscillator
The article spotlights the DOW Intermediate Term Breadth Momentum Oscillator (ITBM) as today’s Indicator of the Day, pairing its line chart with the S&P 500 from April 2024 through April 2026. The oscillator gauges the momentum of market breadth over an intermediate horizon,...

KOSPI -0.55%: Semiconductor Derisking and Rotational Seeding
On April 17 foreign investors sold roughly KRW 1.35 billion ($978 million) of Korean semiconductor stocks, a move amplified by a weaker won and rising local yields. Simultaneously they placed KRW 267.5 billion ($193 million) into less‑exposed names such as Samsung SDI, Koh Young and...

The Cost of Missing One Signal
In September 2025 three of the four primary intermarket signals turned risk‑off, and the Lumber/Gold ratio had already signaled a slowdown. Paid subscribers received the signal in real time, allowing them to shift into defensive assets before the broader market reacted....

Gold Daily Call for April 17th, 2026
Gold is trading sideways in a narrow band, with the key resistance at USD 4,805 and support at USD 4,780. A decisive break above the resistance could lift the price toward USD 4,830‑4,845 and eventually the 50‑day moving average near USD 4,892. Conversely, a...
What Is The Turn of The Month Effect In Stocks?
The Turn of the Month (Ultimo) effect is a market anomaly where S&P 500 stocks tend to rise during the last five trading days of a month and the first three days of the next. Following a simple rule—buy at the...
![[RE-SEND] 4 Green Days This Week For SPX. Can It Close Up With 5? April 17 Plan](/cdn-cgi/image/width=1200,quality=75,format=auto,fit=cover/https://substackcdn.com/image/fetch/$s_!CQcs!,w_256,c_limit,f_auto,q_auto:good,fl_progressive:steep/https%3A%2F%2Fbucketeer-e05bbc84-baa3-437e-9518-adb32be77984.s3.amazonaws.com%2Fpublic%2Fimages%2F8b003827-c0d7-41e5-9f3c-34abd02bf083_198x198.png)
[RE-SEND] 4 Green Days This Week For SPX. Can It Close Up With 5? April 17 Plan
The S&P 500 e‑mini (ES) has surged roughly 700 points in the past two weeks, marking one of the strongest short‑term rallies in years. The author attributes the move to a classic "Failed Breakdown" pattern, where institutions dump the contract,...
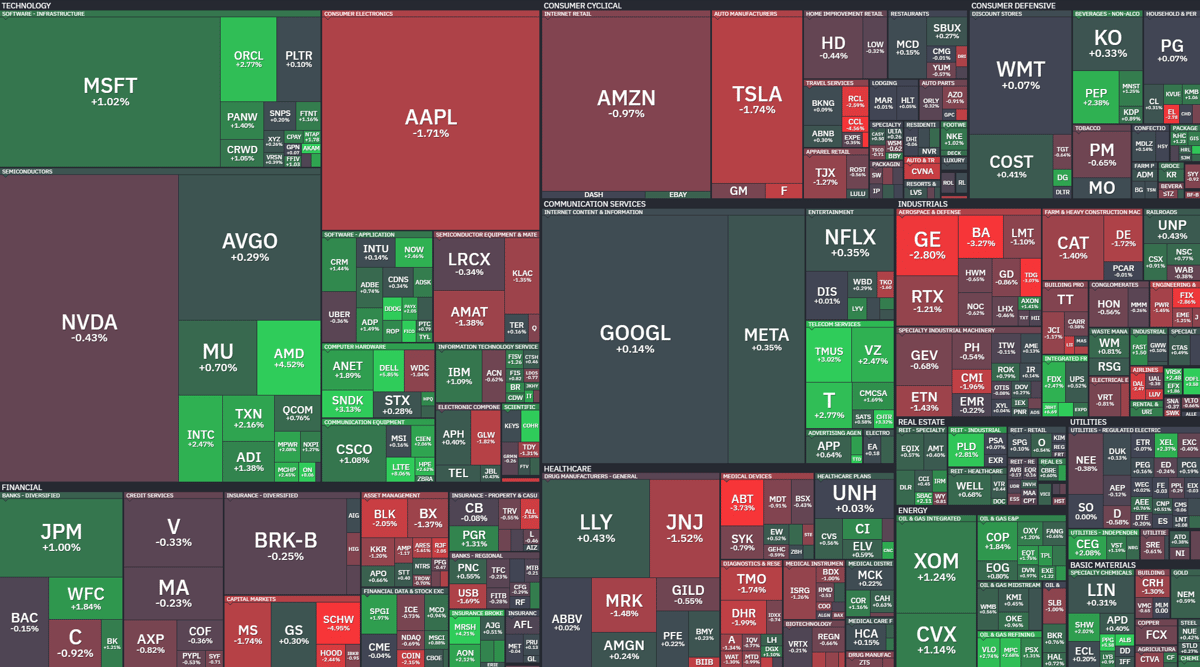
Where Is Money Flowing Today?
Finviz’s intraday heatmap shows capital gravitating toward technology and consumer‑discretionary stocks, while energy, utilities and several small‑cap names lag behind. The visualization highlights a pronounced rally in mega‑caps such as Apple and Microsoft, contrasted with broad weakness in commodity‑linked equities....

TMTB Morning Wrap
TSMC posted first‑quarter 2026 revenue of $35.9 bn, up 6.4% sequentially and slightly above its own guidance, while gross margin surged to 66.2%, outpacing the 63‑65% target. Advanced process technologies (3‑nm, 5‑nm, 7‑nm) accounted for 74% of wafer revenue, driven by...
Conviction Asymmetry: Simultaneous Co-Directional Flow Architecture
The article introduces "Conviction Asymmetry," a market signal that emerges when a single participant class simultaneously buys equities and index futures, with futures notional exceeding equity notional, creating a synthetic long exposure. A real‑time case on April 16, 2026 shows...

Cup Half Full as Tech Comes Back – AI, Semis, Biotech and Clean Energy Lead
The latest equity‑ETF roundup shows technology‑driven themes rebounding after a volatile year. AI‑focused funds, semiconductor ETFs, biotech and clean‑energy vehicles posted the strongest gains, lifting the overall cup‑half‑full sentiment. Investor inflows into these sectors surged, while broader market breadth remained...

After 5 Months, the Nasdaq Finally Hits a New Record High Amid US-Iran Deal Optimism
The Nasdaq Composite surged to a fresh all‑time high, its first record in five months, as optimism grew around a potential US‑Iran peace framework. Traders cite the rally that began in early April and the market’s repricing of growth expectations...

Silver Is Breaking Out
Silver has broken above the descending trend line of a recent triangle pattern, confirming a bullish shift after its correction from a $121 peak in late January. The metal remains above its upward‑sloping 200‑day moving average, indicating sustained momentum. Analysts...
TMTB EOD Wrap
The Nasdaq‑100 ETF (QQQ) surged 1.4% to a fresh all‑time closing high, putting the index up roughly 15% since the start of the month. The rally has broadened beyond growth‑heavy names, pulling in traditionally lagging tech stocks such as Nvidia,...
NASDAQ vs BTC
A recent analysis overlays Bitcoin (BTC) on the Nasdaq, showing a tight correlation since 2019, especially around market lows. The author notes that Nasdaq lows on March 30‑31 historically precede Bitcoin bottoms, suggesting BTC may have already formed its low. The...
Silver Daily Call for April 15th, 2026
Silver surged to $81.02 after a Friday gap‑down, then retreated to $78.24 as traders digested the move. Technical indicators now show an overbought sell signal, pointing to a short‑term consolidation phase. Analysts keep the $83 upside target in view, but...

Get Breakout Multiplier | Annual Upgrade
Breakout Multiplier is offering its current monthly members an exclusive annual upgrade at a 50% discount, reducing the price from $4,995 to $2,495 and saving $2,500. The annual plan includes uninterrupted access to all breakout alerts, Steve Strazza’s Volatility Squeeze Engine...
💡Trade Idea for Wednesday, April 15, 2026
A trader shares a systematic wheel trade idea for Wednesday, April 15, 2026, recommending the sale of a deep out‑of‑the‑money put near a recent support base. The put is positioned well below the current price to collect premium while limiting...

Indicator of the Day (Video): Nasdaq Stocks Above 200 Day MA
The daily Nasdaq breadth indicator measures the percentage of Nasdaq‑listed stocks trading above their 200‑day moving average. From January 2024 through April 2026 the metric has mirrored the Nasdaq‑100 index, rising during market rallies and falling in downturns. The chart shows a...

Update: Price Action Dynamics
Price Action Lab released an update titled “Price Action Dynamics,” featuring a quantitative analysis and forward‑looking forecast for the S&P 500 index. The post, published on April 15, 2026, is gated behind the firm’s Premium Articles subscription, limiting full access to paying members....
S&P 500 Futures – Elliott Wave Perspective
The latest Elliott Wave analysis of S&P 500 E‑mini futures shows the market entrenched in an impulsive structure within a long‑term rising channel. According to the chart, price is now in the final stages of a multi‑year Wave 5, the culmination of...
Bollinger Band Breakout Strategy
A backtest of a Bollinger Bands breakout system on the S&P 500 from 1960 to present shows the portfolio rising from roughly $100,000 to $3.68 million. The strategy buys when the close closes above the upper band and sells when it falls...
ELLIOTT WAVE ANALYSIS: ETHEREUM
The blog applies Elliott Wave theory to Ethereum’s weekly chart, identifying a five‑wave impulse that began at the June 2022 bear‑market low. Wave 1 concluded in late 2022, sparking the crypto’s first recovery leg, while Wave 2 served as a corrective pullback. The analysis...
🎯Take Profit Alert HOOD. HUT, OKLO Cash Secured Puts
A trader announced the closure of three cash‑secured put positions on Robinhood (HOOD), Hut 8 Corp (HUT) and Oklo (OKLO) after capturing 76.67%, 94.19% and 78.24% of the premiums respectively. Each option moved deep in‑the‑money, making further upside limited while...

Get The Breakout Blueprint Report — TT
The Breakout Blueprint Report is a free download promoting Steve Strazza’s Breakout Multiplier System, which claims to generate 10x+ breakouts by identifying price squeezes. The system reportedly delivered 22 trades with triple‑digit returns in 2026, including a 6,000% gain on...

Easy Money Earnings Trades Replay | April 2026
The Beat Report released a replay of its "Easy Money Earnings Trades" strategy, promising 3‑10× returns by exploiting earnings‑season price spikes. The offering is led by Steve Strazza, a former CPA and hedge‑fund accountant turned independent technical analyst. The replay...

Bitcoin Bounces Back Above $74K
Bitcoin surged back above $74,000 on April 13, closing at $74,484 after a dip to $70,588, marking a 5.5% intraday gain. The rally was fueled by strong buying pressure and a volume spike exceeding $52 billion, coinciding with a brief US‑Iran...
MACD Histogram Strategy Backtest
A backtest of a MACD‑Histogram trading rule applied to the QQQ ETF from 2000 to 2026 shows the system still performs well after 14 years. The model executed 124 trades, delivering an average 1.3% gain per trade and roughly 6%...
What My Proprietary Indicator Says About Silver
The author revisits his Synthetic Silver Price Index (SSPI), a proprietary tool built from gold and copper data, to gauge silver's trajectory. The SSPI’s 200‑day moving average remains upward‑sloping, indicating an ongoing uptrend despite a two‑month pullback. Both the SSPI...

Mastering Zero DTE with Altos Trading: Unveiling the Golden One Day Options Trade and Market Insights
Altos Trading unveiled a systematic "Golden One Day" options play that targets zero‑days‑to‑expiration (Zero DTE) contracts. The strategy combines high‑probability entry signals with tight risk controls, aiming to capture daily market volatility while limiting capital exposure. Altos provides members with...
🎯 Take Profit Alert On XYZ and RCAT Cash Secured Puts
Options trader Edward Corona announced the closure of two cash‑secured put positions—Block Inc (XYZ) and Red Cat Holdings (RCAT). The XYZ put, entered on April 24 with a $54 strike, collected $130 in premium and realized a $106.50 profit, representing 81.9%...

The Many Facets of Stock Momentum: Distinguishing Factor and Stock Components
The paper by Gerard and Jehl demonstrates a durable, stock‑specific momentum component that stems from price reactions around earnings announcements, distinct from traditional factor‑driven momentum. By isolating returns in short windows surrounding each firm’s earnings over the prior year, the...

Indicator of the Day (Video): Equity Put Call Ratio 10 DMA
The daily Equity Put/Call Ratio 10‑day moving average (DMA) was highlighted as the Indicator of the Day, accompanied by a chart spanning April 2024 to April 2026 alongside the S&P 500. The DMA smooths volatile daily ratios, offering a clearer view of market...

4 Trade Ideas for Alphabet: Bonus Idea
Alphabet (GOOGL) is trading just above its 50‑day SMA with resistance levels at $320, $327, $338 and $349 and support near $310. The RSI has climbed into bullish territory and the MACD is positive, though the stock has not yet...
Buy Weakness, Win Big: The 5-Day Low Trading Strategy
The article presents a systematic 5‑day low mean‑reversion strategy for the S&P 500 (SPY) that buys when the price hits its lowest level over the prior five trading days. A backtest from 1993 to present shows 414 trades, 305 winners, and...

Sophisticated Trading Strategies Through Automation and Real-Time Feeds
Financial institutions are accelerating a shift to cloud‑native, API‑driven architectures to support real‑time intelligence and automation. BBVA partnered with Bloomberg and AWS to rebuild its volatility‑marking system in the cloud, while Singapore‑based dtcpay leverages automated stablecoin‑fiat swaps across Asia. Executives...

The Signal that Called the September Rotation
The article spotlights the September breakdown of the Lumber/Gold ratio as a leading signal that foreshadowed a broader equity roll‑over. This inter‑market indicator, tracked for over two decades, has consistently signaled shifts in growth expectations before mainstream gauges like the...

Weekly Market Report: Peak AI
Price Action Lab’s weekly market report, titled “Peak AI,” details the performance of its tactical ensemble (WRE) and strategic allocation (PALSA) versus the SPY ETF. The WRE posted a 2.7% weekly gain and a 60.2% cumulative return since 2022, outpacing...

Vol Street Journal™ :: Episode 21
Episode 21 of the Vol Street Journal examines whether the recent volatility crush is losing momentum and its implications for equity markets. The host highlights an “undervixing” technical state, noting that implied volatility is unlikely to fall further unless individual...
One Simple Momentum Strategy Using 4 ETFs
A straightforward momentum rotation across four liquid ETFs—SPY, EEM, TLT and EFA—selects the asset with the strongest 10‑month performance each month. The back‑test delivers an annualized return of 9.2%, a 61% win rate, a 26% maximum drawdown and a profit...