
Hedge Fund Trade Tip (PIN) – Position Idea Notification
The Hedge Fund Trade Tip (PIN) post shares a line‑graph chart that tracks an unnamed asset from June through March, revealing a steady decline through December, a brief rally in February, and a sharp drop in March. The visual is the only publicly visible element; the underlying analysis and position recommendation are hidden behind a membership login. Such Position Idea Notifications are routinely used by hedge‑fund analysts to signal short‑term directional bets to subscribers. While the exact trade idea isn’t disclosed, the chart alone suggests heightened volatility and a potential reversal opportunity.

A Strong Start to May Has Often Been Followed by a Short-Term Dip
May often begins with a rally in the S&P 500, but historical data shows that the optimism is short‑lived. Since 1987, the index has risen on the first trading day of May 25 times, and in 17 of those instances (about...

TMTB Morning Wrap
The TMTB Morning Wrap notes a broad market lift, with the QQQ index up 15 basis points and oil gaining 3% as the U.S. begins "Project Freedom" to escort neutral ships amid Iran tensions. Asian tech equities surged, led by...

The Short-Term Path For Gold Gets Messier
The author notes that after a two‑year rally, gold’s short‑term trajectory has become erratic, highlighted by a $50 drop despite fresh geopolitical tension involving Iran. While technical levels around $5,000 per ounce were previously seen as profit‑taking zones, the long‑term...

KOSPI Surges +5.12%: Two Stocks Built This Number
South Korean equities jumped 5.12% as foreign investors poured roughly $2.1 billion into the market, with 98.8% of net buying concentrated in SK Hynix and Samsung Electronics. The inflows validated an AI‑memory demand thesis, while a Hormuz‑related oil supply shock prevented...

4 Trade Ideas for AIG: Bonus Idea
American International Group (AIG) is testing a key resistance zone around $79.50‑$80.25 as its RSI climbs into bullish territory and the MACD line flips upward. The insurer’s stock trades with a 2.54% annual dividend yield and a low 1.4% short‑interest...

Bear Flag Break
The author argues that the current bear market phase is the toughest, as the classic bear‑flag pattern on Bitcoin is nearing a breakdown near the $80,000 level. While bullish sentiment is rising, fresh cash inflows are likely to generate another...

Bitcoin Price Analysis Today: Daily Order Flow Turns Bullish as BTC Tests $80k Acceptance
Bitcoin is hovering near $80,328, marking a 2.25% intraday gain as the daily candle remains early. Order‑flow data shows buyers controlling 61.8% of volume and a positive delta of +23.5%, while the point of control (POC) has migrated upward to...

Counting Down to Silver’s Next Major Breakout
The author contends that silver is not in a busted bubble but in the early phase of a decade‑long bull market. A weekly COMEX chart reveals a triangle consolidation that historically precedes continuation rallies. A decisive breakout above the $121...

Quiet Indices, Roaring Stocks: The Volatility Dispersion Trade
Robust earnings from the Magnificent Seven and semiconductor leaders have propelled the S&P 500 and Nasdaq to fresh highs while index implied volatility fell to a three‑month low. In contrast, single‑stock volatility remains elevated, creating a pronounced dispersion between index and...

Indicator of the Day (Video): Pring Bottom Fisher Indicator
The Pring Bottom Fisher Indicator, a technical gauge of bottom‑fishing buying pressure, displayed a highly volatile pattern from May 2024 through May 2026, swinging between positive and negative readings. During the same period the S&P 500 index maintained a generally upward trajectory, creating...

Multiple Days Up And Multiple Days Down Trading Strategy
Larry Connors’ Multiple Days Up and Multiple Days Down strategy exploits short‑term market overreactions by trading against clusters of consecutive gains or losses. The method was backtested on the SPY ETF, generating 267 trades with a 75% win ratio and...

Pen and Tell Her (2 of 4)
Tim Knight’s second installment of the "Bear Pen" series showcases ten equity charts that he deems ripe for short‑selling. The gallery highlights classic technical formations—cup‑and‑handle, rounding tops and bottoms, and other pattern cues—across a mix of consumer, tech, and commodity‑linked...

Indicator of the Day (Video): NYSE High Low Oscillator
The Indicator of the Day highlights the NYSE High Low Oscillator, a momentum tool that tracks the difference between daily highs and lows on the NYSE Composite. The chart spans June 2024 to April 2026, showing the oscillator swinging between –15,000 and...
Short Strategy for Chinese Stocks (FXI)
A systematic short‑position strategy targets the iShares China Large‑Cap ETF (FXI) from the U.S. market close to the next open. Over 765 trades, the model generated an average gain of 0.1% per trade, a 50% win ratio, and a 2.7%...

How This Week’s Premium Top 10 Performed, May 1, 2026
The Dragonfly Capital Premium service reported its weekly Top 10 performance for the week ending May 1, 2026. Eight of the ten recommended trades were active, with two closed at breakeven, one yielding a gain and another a loss. The equal‑weight portfolio slipped...

SPX Closes At Major ATHs. Pullback Next Week, or More Upside Ahead? May 4th Plan
The S&P 500 e‑mini (ES) surged to new all‑time highs after a classic "failed breakdown" at the 7,137 level, a pattern institutions use to accumulate positions. The index fell sharply to 7,132 on earnings news, trapped short sellers, and rebounded...

🎯Take Profit Alert: WYFI Cash Secured Put
The author closed a May 15 $12.50 cash‑secured put on WhiteFiber Inc. (WYFI) after collecting $340 in premium and realizing roughly $230 profit, a 67% return on the premium with 15 days left. The remaining $110 value would require tying up...

Rethinking Trend Following: Optimal Regime-Dependent Allocation
A new paper separates regime detection from position sizing, deriving Sharpe‑optimal weights for each market state. Applying the framework to two‑ and four‑regime specifications lifts out‑of‑sample Sharpe ratios from 0.208 to 0.506 and from 0.496 to 0.628, respectively, across 18...
💡Trade Idea for Friday May 1, 2026
After a solid earnings beat, the stock retreated, creating a buying opportunity for the author. They initiated an out‑of‑the‑money put spread with a strike below the current price, targeting premium income. The trade carries a 76% probability of worthlessness and...

Using the PPO to Define Trend and Aroon to Identity Breakouts After Corrections
Arthur Hill, CMT, outlines a two‑indicator system that uses the Percentage Price Oscillator (PPO) to confirm a long‑term uptrend and the Aroon indicator to time short‑term breakouts after pullbacks. He notes that the S&P 500 (SPY), Nasdaq 100 (QQQ) and Russell 2000 (IWM)...

Aroon Setups and Signals for 5 ETFs, Include a Commodity ETF
TrendInvestorPro has released a new systematic trading package that provides Aroon‑based setups for five exchange‑traded funds, one of which tracks a commodity index. The service bundles the signals with momentum scores, video tutorials, and a market‑timing model. Access requires a...

5 Stocks Delivering Eye-Popping Gains
Lightwave Logic Inc. (LWLG) surged 16.67% on Thursday, closing at $13.72 as AI‑driven growth sentiment lifted high‑performance chip makers. The jump mirrored broader market gains, with the Dow and S&P 500 up over 1% and the Nasdaq up 0.89%. Lightwave announced...

Sell in May ……….
The author warns that the traditional "sell in May" adage is especially relevant this year as oil prices are poised to break $150 per barrel and could climb to $200‑$250 in the coming months. Inflation in the United States is...

Glick's Picks $7 Confirmation | May 2026
Kenny Glick is launching a $7, 30‑day subscription called Glick’s Picks that delivers one daily trade idea—including entry, stop‑loss and target—starting tomorrow morning. Subscribers receive a welcome email with instructions to whitelist the sender and are invited to a live...

Update on Gold Stocks & Breadth Indicators
The Daily Gold update flags the VanEck Vectors Junior Gold Miners ETF (GDXJ) as oversold according to a suite of breadth indicators. Technical analysis pinpoints primary support around $30 and secondary support near $27 per share. The report links the...
Gold & Silver Volatility Has Plunged
Founder Bob Coleman highlighted that the CBOE Gold ETF Volatility Index (GVZ) and the CBOE Silver ETF Volatility Index (SVZ) have fallen sharply from their early‑year peaks. The drop brings both indexes close to their 200‑day moving averages, a technical...

PDT Rule Reversal Reg | May 2026
The SEC voted on April 14, 2026 to overturn the 2001 Pattern Day Trader (PDT) rule, allowing retail investors to day‑trade with as little as $2,000. Veteran trader Kenny "The Warlock" Glick is hosting a free live webinar on May...
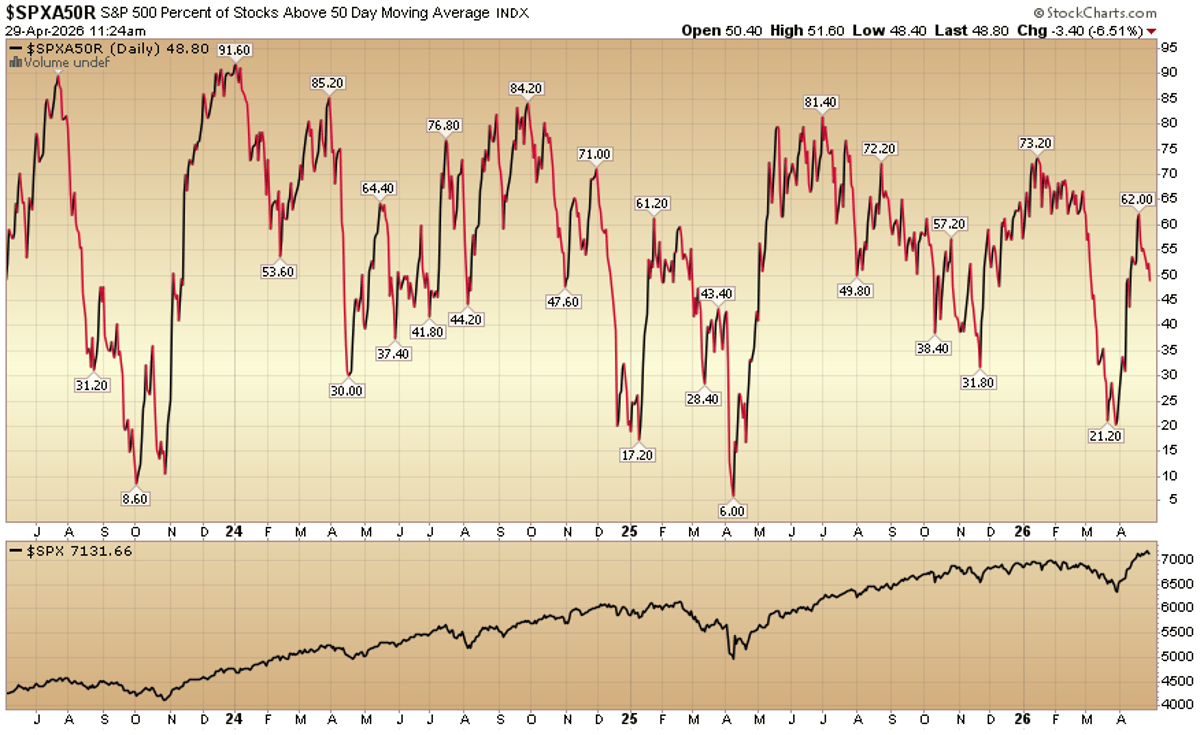
Indicator of the Day (Video): S&P 500 Percent Above 50-Day SMA
The Indicator of the Day highlights the percentage of S&P 500 stocks trading above their 50‑day simple moving average (SMA). The chart tracks this breadth metric from January 2024 through April 2026, showing a series of peaks and troughs that mirror overall market...
💡Trade Idea for Wednesday April 29, 2026
The analyst revisits a stock that previously yielded a successful earnings‑driven trade, entering after a sharp pullback. By selling an out‑of‑the‑money put, the position targets a 71% probability of worthlessness and a 77% probability of profit. The premium collected provides...
TMTB Morning Wrap
Seagate Technology (STX) posted a blockbuster Q3, with revenue up 44% year‑over‑year to $3.11 billion and non‑GAAP EPS of $4.10, far exceeding Street estimates. The company raised its full‑year outlook, guiding Q4 revenue of $3.45 billion and EPS of $5.00, implying a...

FOMC LIVE Reg | April 2026
On April 29, 2026, Stock Market TV will host a free live trading webcast at 3 PM ET, covering the day’s heavy earnings calendar and Federal Reserve news. The session will dissect earnings from Microsoft, Alphabet, Meta and Amazon, which together represent a sizable...

AGNCM Vs. AGNCP: The Market Messed Up
A market anomaly has emerged where AGNCM is trading above its counterpart AGNCP, despite identical share structures. AGNCM’s current spread is 4.332% while AGNCP’s is 4.697%, creating a 9‑cent‑per‑share annual dividend advantage for AGNCP. Normally, the higher‑yielding AGNCP commands a...

How to Trade the Vanna Rally: Profiting When Volatility Drops
The article explains the Vanna rally, a market move where a drop in implied volatility forces options dealers to buy S&P futures, pushing the index higher regardless of fundamentals. It outlines a four‑step process: identify a short‑Vanna regime via SpotGamma’s...

Vanna and Charm Explained: The Hidden Greeks Driving Market Rallies
Vanna and Charm are second‑order options Greeks that capture how an option’s delta shifts with changes in implied volatility and the passage of time. In the S&P 500, a short‑Vanna environment forces market makers to buy futures as volatility drops, creating...

5 Stocks with the Most Predictable Earnings IV Crush
The article identifies NVIDIA, Tesla, Netflix, Apple and Amazon as the five stocks that consistently experience the sharp post‑earnings implied volatility (IV) collapse known as an IV crush. These high‑growth and consumer‑staple giants see option premiums inflate dramatically ahead of...
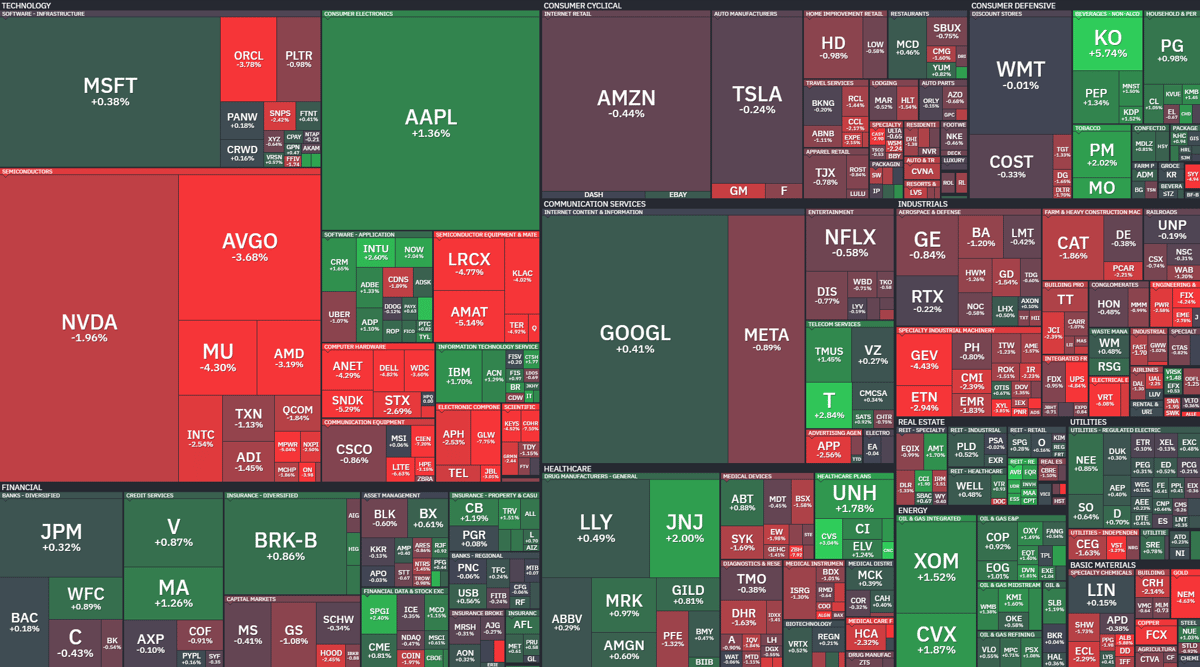
Where Is Money Flowing Today?
Today's Finviz heatmap shows capital gravitating toward AI and semiconductor firms, with Nvidia and AMD posting double‑digit gains. Renewable energy names such as NextEra Energy and Enphase Energy also attracted inflows, reflecting continued policy support. In contrast, traditional defensive utilities...

Is Nonlinear Momentum the Answer?
Researchers led by Tobias Moskowitz introduced a nonlinear momentum model that down‑weights extreme past returns, aiming to reduce momentum crashes. Back‑tested Sharpe ratios generally exceed those of the traditional 12‑month linear momentum strategy, especially for shorter look‑back windows and during...
Where Metals & Miners Stand Now
Precious metals and mining stocks have moved from early‑year volatility into a quieter consolidation phase, signaling a healthier market rhythm. Gold remains in a robust uptrend, confirmed by an upward‑sloping 200‑day moving average that shows no technical damage. The Williams %R...
TMTB EOD Wrap
The Nasdaq‑100 (QQQ) edged higher as oil rose and yields ticked up, while semiconductor stocks saw mixed moves. Nvidia (NVDA) jumped 4% after renewed optimism around OpenAI’s ChatGPT 5.5 and news that TSMC’s 3nm capacity is higher than expected. In...
🎯Covered Call Trade Management Alert: SERV
Trader Edward Corona reports that his covered call on Serve Robotics (SERV) expired worthless last Friday. He is now initiating a new covered call with a $13.5 strike, $0.19 premium, and a May 22, 2026 expiration. The trade is positioned...
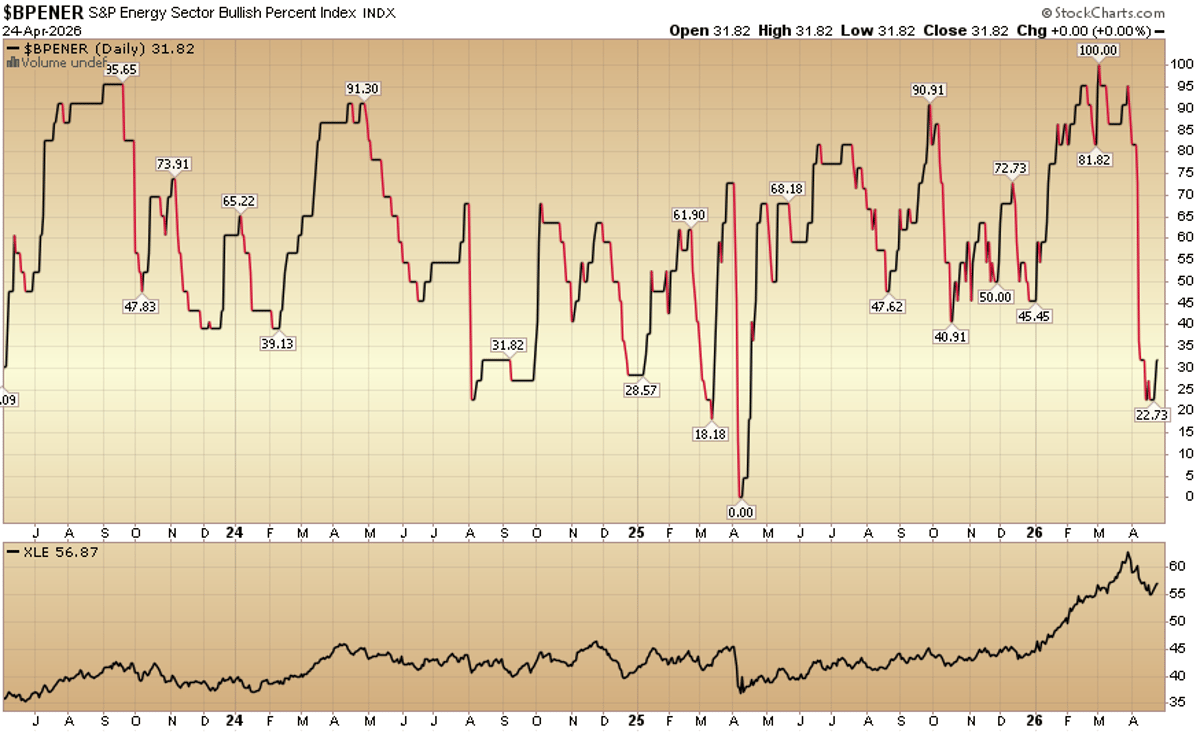
Indicator of the Day (Video): Bullish Percent Energy
Hedge Fund Tips highlighted the Bullish Percent Energy indicator, showing the S&P Energy sector’s bullish‑percent line alongside the XLE ETF performance chart. The metric measures the proportion of energy stocks trading above their 200‑day moving average, offering a breadth gauge...
TMTB Morning Wrap
OpenAI is teaming with MediaTek and Qualcomm, with Luxshare as the exclusive system‑on‑chip partner, to launch AI‑powered smartphone processors slated for mass production in 2028. AMD received a downgrade to Market Perform as intensified competition from Intel and Nvidia, coupled...

4 Trade Ideas for MetLife: Bonus Idea
MetLife (NYSE: MET) is trading around $77.70 and approaching key resistance at $78.25, with bullish momentum indicated by a rising RSI and positive MACD. Short interest remains modest at 2.3%, and the stock carries a 2.92% annual dividend yield after its...
KOSPI Surges +2.15%: Semiconductor Earnings Concentration Drives All-Time High
The KOSPI jumped 2.15% to an all‑time high as semiconductor earnings from Intel, Samsung and SK Hynix sparked a concentrated rally. Samsung (25.45% weight) and SK Hynix (17.19% weight) together drove 72.8% of the index’s gain, accounting for roughly $1.3 billion of foreign...

Oil Prices Continue to Rise Amid the US-Iran Stalemate; Iran Awaits US Blockade Removal
Oil prices kept climbing as the US‑Iran deadlock deepened, with crude trading above the $93 per barrel resistance. Iran signaled it would reopen the Strait of Hormuz once the US lifts its maritime blockade, while President Trump insists on a...
RSI 30 50 Strategy for Beginners
The RSI 30‑50 strategy repurposes the Relative Strength Index as a pull‑back entry tool rather than a reversal signal. Traders first confirm a bullish trend—typically price above a rising 200‑day moving average—then wait for the RSI to dip into the...
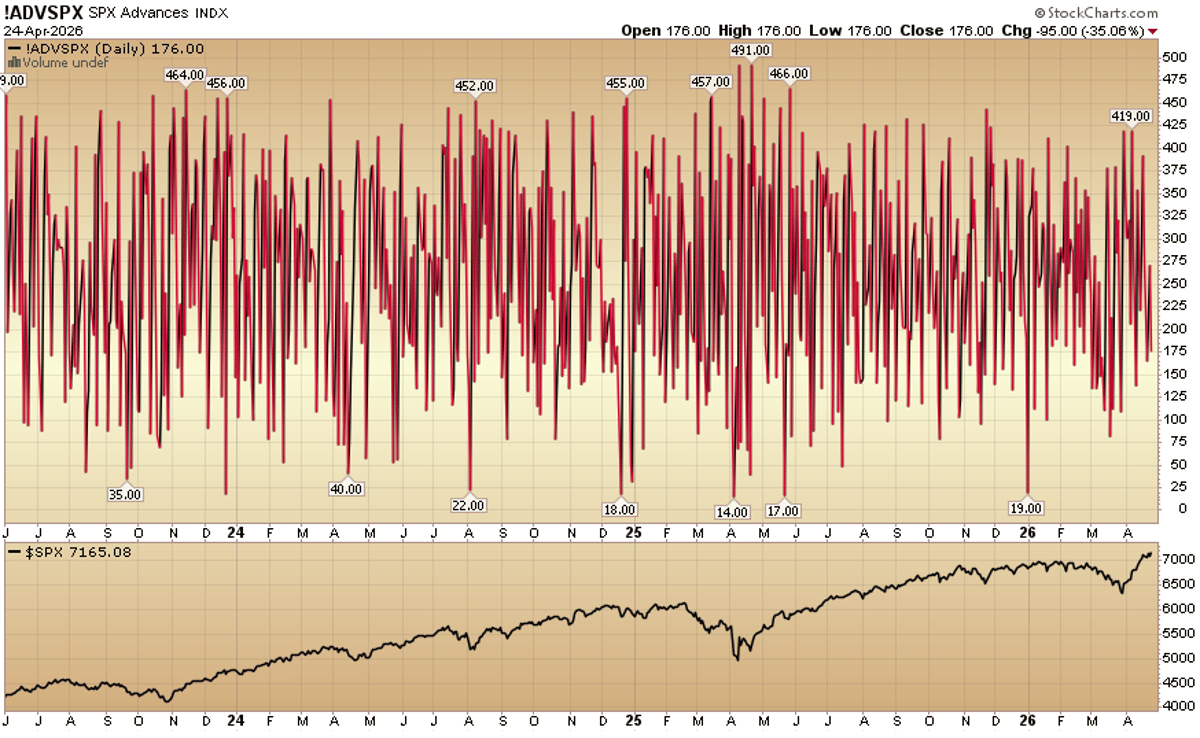
Indicator of the Day (Video): S&P 500 Advances
Hedge Fund Tips released its daily "Indicator of the Day" video focusing on S&P 500 Advances. The accompanying chart tracks the Advancing/Declining Index (ADVSPX) alongside the S&P 500 from April 2024 through April 2026, showing a clear upward trajectory in market breadth. Rising ADVSPX...

Overnight vs Daytime Returns in Sector ETFs
A new study of SPY and nine sector ETFs from 1999‑2025 finds that overnight returns generate a strong, exploitable momentum, while daytime returns are weak or negative. A simple long‑only overnight strategy (Strategy #1) outperformed buy‑and‑hold in every ETF, delivering...

Another Week Delivered at Elliott Wave 2.0
Elliott Wave 2.0 released 17 structured crypto analyses this week, covering assets from Bitcoin to Solana. Each update provides wave counts, validation levels, target prices and risk‑managed positioning. The service emphasizes a disciplined, non‑speculative process that prioritizes market structure over short‑term...