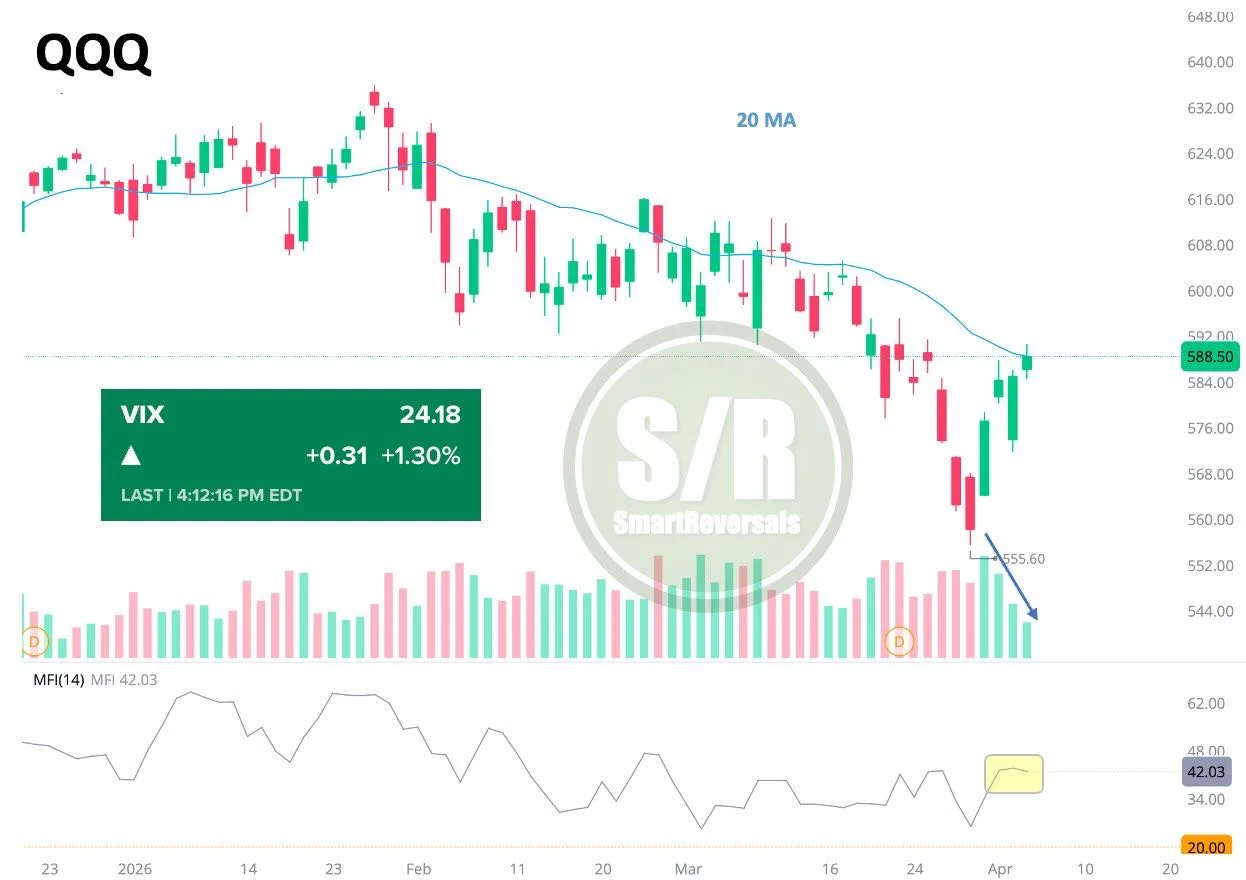
QQQ Holds, VIX Spikes Amid Iran Tension Risks
QQQ: +0.6%, not bad for Black Monday. Anyway, the price must stay resilient reclaiming levels. The 20DMA acted as resistance today. The setup is open to escalations in Iran with the daily volume and Money Flow both diverging from the rally. #VIX jumped amplifying caution. #NDX

Macro Volatility Returns: Inflation Threats and Earnings
Stabilization Into A Trap 💫Searching For A Bottom 💫Another Trump Ultimatum 💫Mechanical Flows Waiting For Gamma Flip 💫The New Macro-Driven Volatility Regime 💫Earnings - Opportunity or As Good As It Gets 💫The Week Ahead: Inflation Threatens https://t.co/Y1dcSGIrPf
US Stock Trading Slows; Oil Prices Surge to New Highs
Slowest full-day volume (for US Stocks) of the year while Oil is ripping a new one to new highs again tonight - no worries

SPY Hits Lowest Volume Since Feb, Down 60%
SPY closed with just ~36M shares traded, about 60% below average and the lowest volume since February of last year.

ISM Services Data Reveals Hidden Stagflation Amid Rally
The S&P 500 rose for a fourth straight day. Markets rallied on ceasefire hope. But the ISM Services report just delivered the clearest stagflation signal since 2022 and nobody noticed. Prices Paid surged to 70.7%. Employment contracted to 45.2%. Service...

SPX Straddles Trendline: Bullish Signals Mixed
Some technical ambiguity from Monday's $SPX performance. The index is above its short/medium term trend channel resistance and the 20-day SMA. Alternatively, still below a zone of resistance around 6,630/20 and the 200-SMA on lowest volume since Dec 31st. Bullish or not?...

S&P Near 200‑Day MA, Downward Move Expected
$SPX - 4th up day in a row and approaching the 200 day MA. The most likely scenario is hitting the 200 DMA and then turning down again for another down leg. Obviously, a ceasefire agreement with Iran will probably...
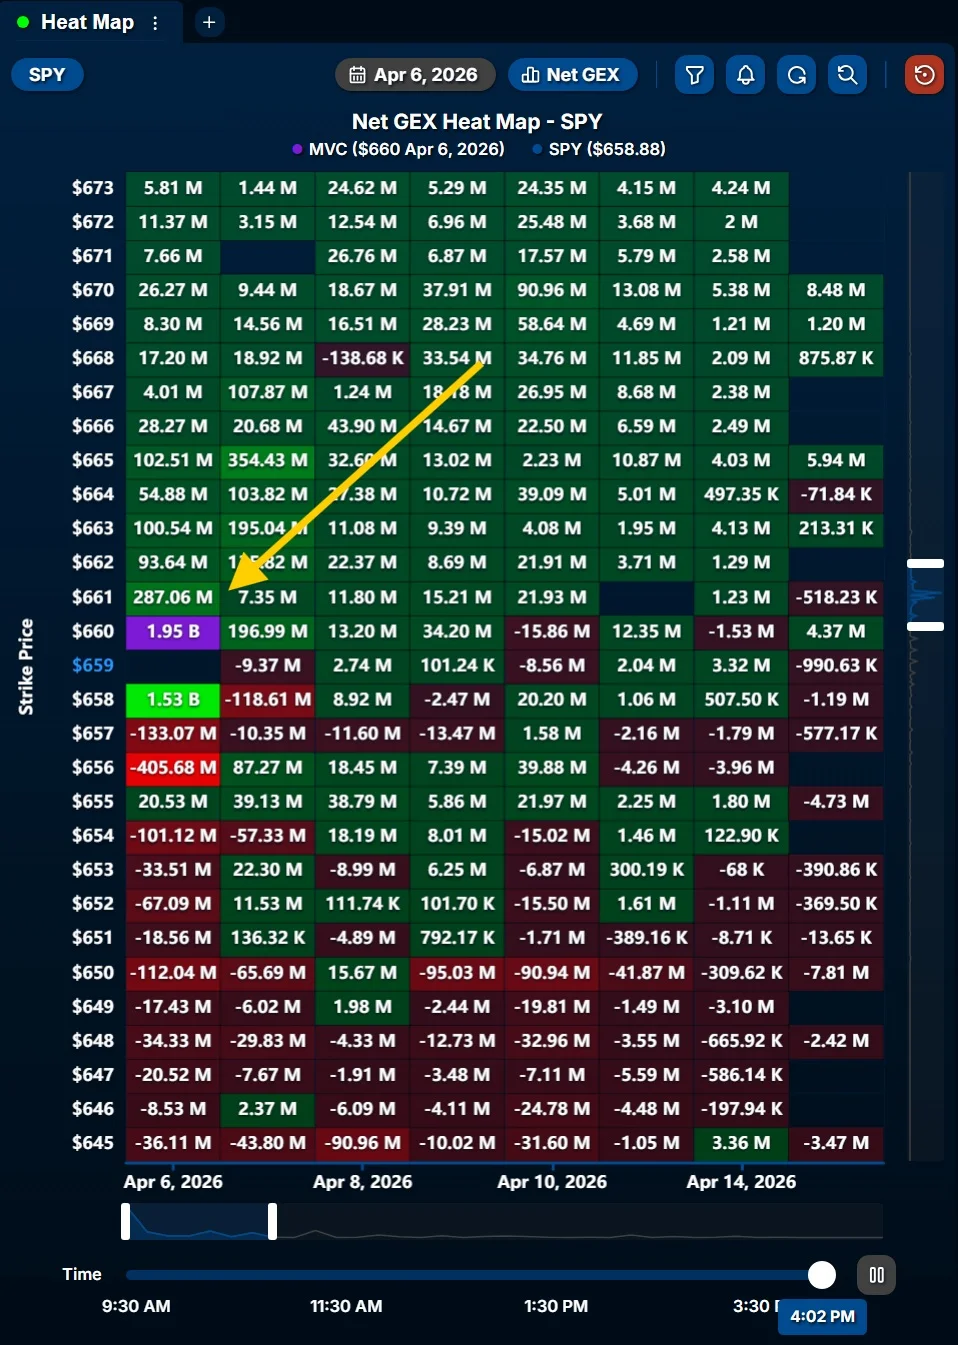
SPY Holds $5 Range; MVC at $660, Exposure at $658
We spent the whole day in the $5 range we identified earlier on $SPY. $660 remains the MVC, and there's quite a bit of positive exposure at $658. Pretty much the same analysis as this morning...

S&P 500 Stalls in Doji, Bullish MACD Amid Bearish EMAs
#SP500 doji Candle and Sideways. Resistance 6651, 6754, 6845. Support 6474, 6400, 6316. MACD Bullish. RSI 45 near Neutral. 13/21 day EMAs Bearish. Top Bollinger Band 6703. Midpoint Line 6522. Bottom Band 6341.

S&P 500 Posts First
S&P 500 first 3-day winning streak since mid-Feb.. still below the 200-day sma... but above the 200-day ema https://t.co/2husJVCbEJ

Key Nasdaq100 and Gold Levels Predicted Upcoming News
Gave the key levels on Nasdaq100 and gold and the "news followed" 2 days later https://t.co/xWV7xbQUXI

S&P Stalled: Need New Highs, T‑Bills Offer Certainty
Re: the S&P 500, what a mess. A primary uptrend can't resume until new ATH's. A downtrend can't emerge until < 6,316. Not jumping above last week's high today is a bit ominous. T-Bill & chill looks pretty to me - paying...
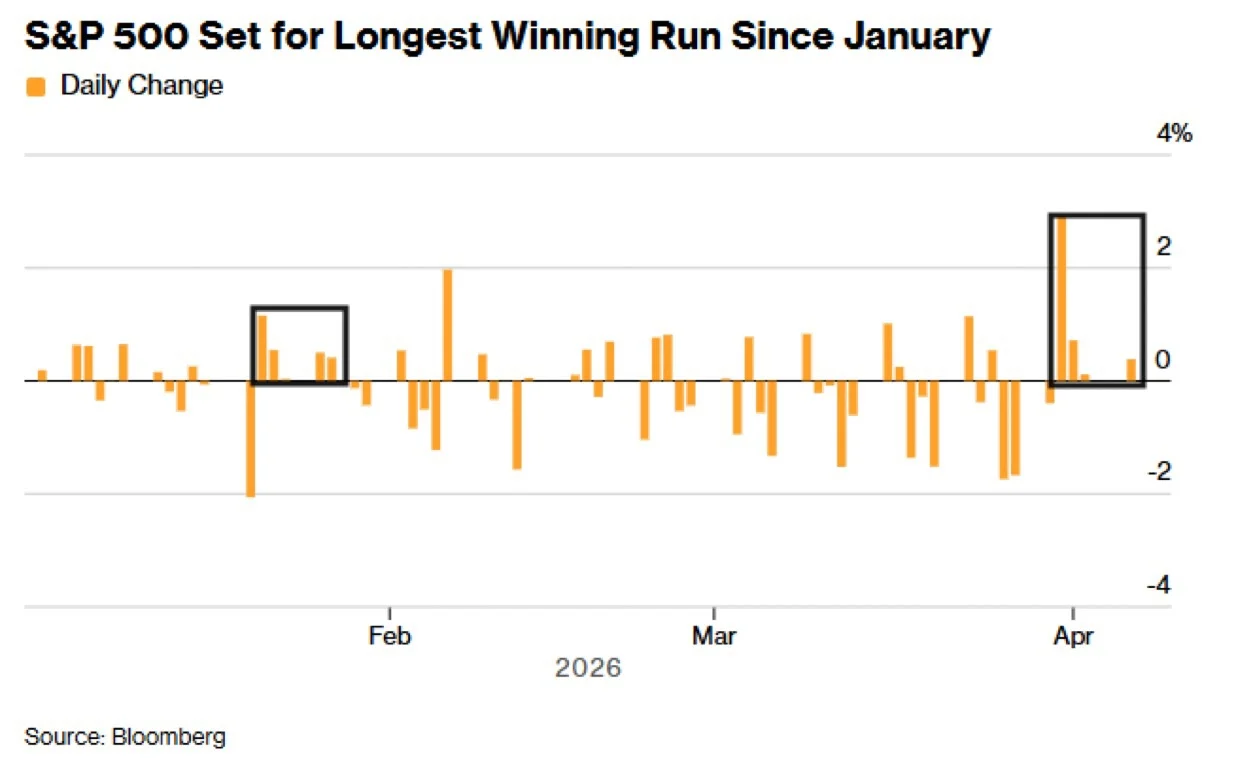
SPX Eyes Fourth Consecutive Green Day, Longest Since Jan
If the SPX can hold in the green, it will be a fourth straight day, the longest stretch since a 5-day run Jan 21-27th.

J.P. Morgan Sets $145 Target for Tesla
This is the J.P. Morgan analyst who just put a $145 price target on $TSLA btw https://t.co/4MYZZS8Zsm

Dow Breaks Channel Resistance, Lacks Momentum Amid Thin Liquidity
The Dow has moved through the resistance of the past 6-week descending trend channel, but it hasn't really gained traction on the break. Thinned liquidity has undermined any productivity from the break itself. Currently stuck between a very narrow 200 and...

TRACE Flags Ceiling as S&P Rally Stalls at 6,650
Market rips, TRACE flags the ceiling. On March 23, the S&P’s sharp rally in the morning stalled out at heavy resistance near SPX 6,650. TRACE + HIRO showed dealer selling taking hold, and the market faded lower. Join us April 9th...

Profitable Russell 2000 Stocks Outperform Non‑Profits YTD
Within Russell 2000, profitable stocks continue to significantly outperform non-profitable ones YTD … opposite last year when non-profitable was +20% and profitable was +10%

QQQ and SPY Near 20‑Day SMA, Hinting Bottom
both the $QQQ and $SPY flirting with the 20 day SMA's. early. A close over would be add to the case for a bottom last week.

QQQ Tests 20‑Day MA Amid Iran Deal Hopes
$QQQ Daily. Early test for Nasdaq of 20-day moving average on hopes for some kind of Iran deal. Also remains below 200-day m.a.. Oil staying firm, too. https://t.co/HSiCYzXfhZ

Six of Eleven GIC Sectors Beat S&P 500 This Year
most (6/11) of the GICs sectors are outperforming the S&P 500 $SPX itself this year... #SectorWatch https://t.co/T69n5wObOT
Q3’s Top Performer Isn’t Tech, Chart Shows
CHART OF THE DAY: Quad 3 Has a Winner - And It's Not Tech https://t.co/J5odr45xlt via @hedgeye

Market Fell without Expanding New Highs on SPX
quite simply, we just didn't see an expansion of highs as the market fell... $SPX https://t.co/G95i8hvEF5

Breadth Signals Bounce, Structure Confirms Bear Rally
Breadth is screaming a bounce, but structure says bear-market rally. Zor's Daily View — April 6, 2026 ☑️ Breadth: ALL green. Short + medium term. ☑️ Swing Posture: RISK ON (STRONG) ⚠️ Market Regime: BEARISH (NASDAQ + SPY) 🟢 IWM: Only index with BULLISH regime Transition...

S&P Short‑Range Oscillator Nears Neutral After Oversold Stretch
The S&P Short Range Oscillator is approaching neutral after being oversold for several days -0.52% vs. -1.53%. $SPY @jimcramer @tomkeene @lisaabramowicz1 @ferrotv @business @SquawkCNBC @BeckyQuick @carlquintanilla @pisani

SPX Futures Rise Amid Mixed Global Markets; Trim Positions
Mixed markets around the World as the news flow remains fluid. $spx futures +25 after a volatile evening. Keep moving ur feet as Friday gave a little confidence when weakness was absorbed even with strong oil. The daily has a...
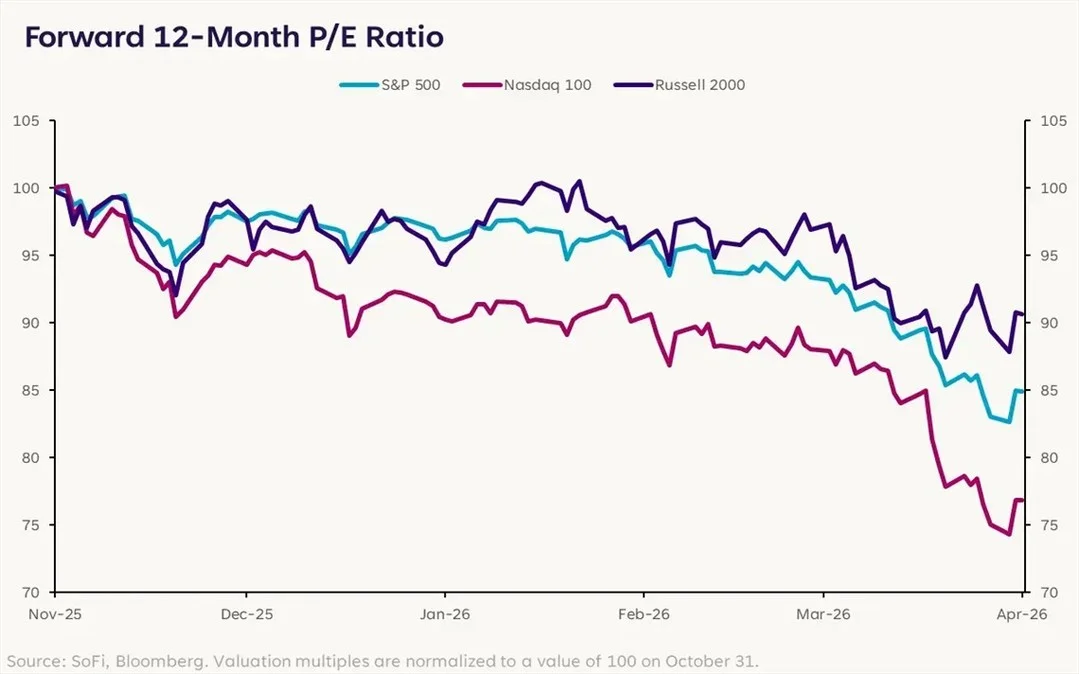
Nasdaq 100 P/E Drops 23%, Russell 2000 Lags
"The Nasdaq 100’s forward price-to-earnings ratio (P/E) has compressed by 23% since the highs at the end of October, while the Russell 2000 P/E has only compressed by 9%." -Liz Thomas, SoFi

Futures Hold Steady; Market Near Volatile Bottom
$NDX $SPX futures holding steady despite the ramp up in rhetoric over the weekend is a good sign. The stock market is severely washed out, we may get a retest or a marginal new low but on watch for a...

S&P 500 Valuation Drops as Earnings Surge, Recession Fears Unfounded
The S&P 500's valuation multiple fell 18% while forward earnings climbed to a record high. The market priced in recession fears that analysts never shared. 🔒 Members-Only https://t.co/nsxnGQf0yN
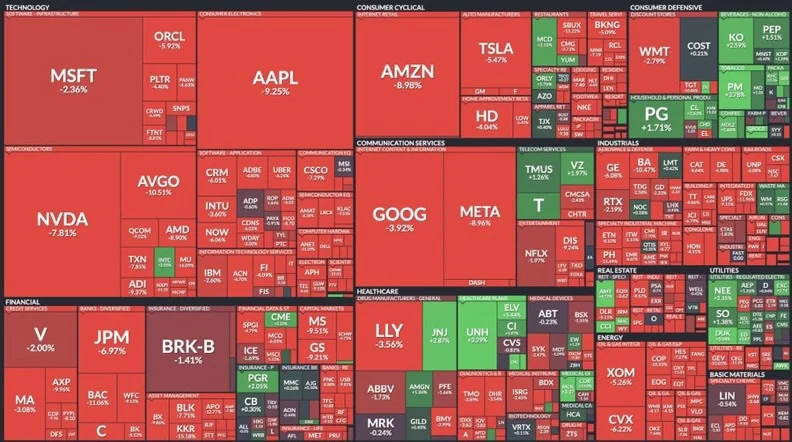
U.S. Stocks Plunge Following Liberation Day Tariffs
This is what the 🇺🇸 stock market looked like on April 3rd, 2025 the day after the Liberation Day tariffs were announced

US Chemical Stocks Surge 6% Amid Gulf Crude Squeeze
U.S. chemical producers like Dow are outperforming the S&P 500, with shares up about ~6%, as access to Persian Gulf crude (a key ingredient for plastics) tightens due to the Iran war

Value Stocks Lose Safe‑Haven Status Amid Market Turbulence
JUST IN: Value stocks, a key refuge from this year's market turbulence, are now at risk.

SPY Faces Three Paths: Bounce, New Lows, or V‑Bottom
Should be a very active/fluid week. First weekly chart is mine. We did see the first reflex oversold bounce. Seems like two/three scenarios going around. 1) One more move to $spy $674 area in the next week or...

S&P 500 Equity Risk Premium Hits Two-Year High
The S&P 500's equity risk premium is at a 2-year high.. even with higher TIPS yields @wisdomtreefunds https://t.co/T5y4c7SbGO

Extreme Bearish Sentiment Triggers Relief Rally, Signals Bottom
SPX: Over the last 30 years, we have seen this level of bearish sentiment (55%) only a few times. Relief rallies have followed without fail; even when those rallies were short-lived A major bottom materialized few weeks after. #SPY #QQQ #NVDA...

Energy Outperforms; Health Care and Staples Decline
Energy leads on the 1m, 3m, 6m zooms... Health Care & Staples have turned south recently @wisdomtreefunds https://t.co/vqQWQ5SYQV

Weekly S&P500 Chart
Weekly S&P500 ChartStorm https://t.co/JX6lIxWqjy This week: investor sentiment, economic sentiment, seasonality and studies, longs vs shorts, tech sentiment, big tech value, AI output, deadlines, global equity technicals... https://t.co/lTyVXrCwOe
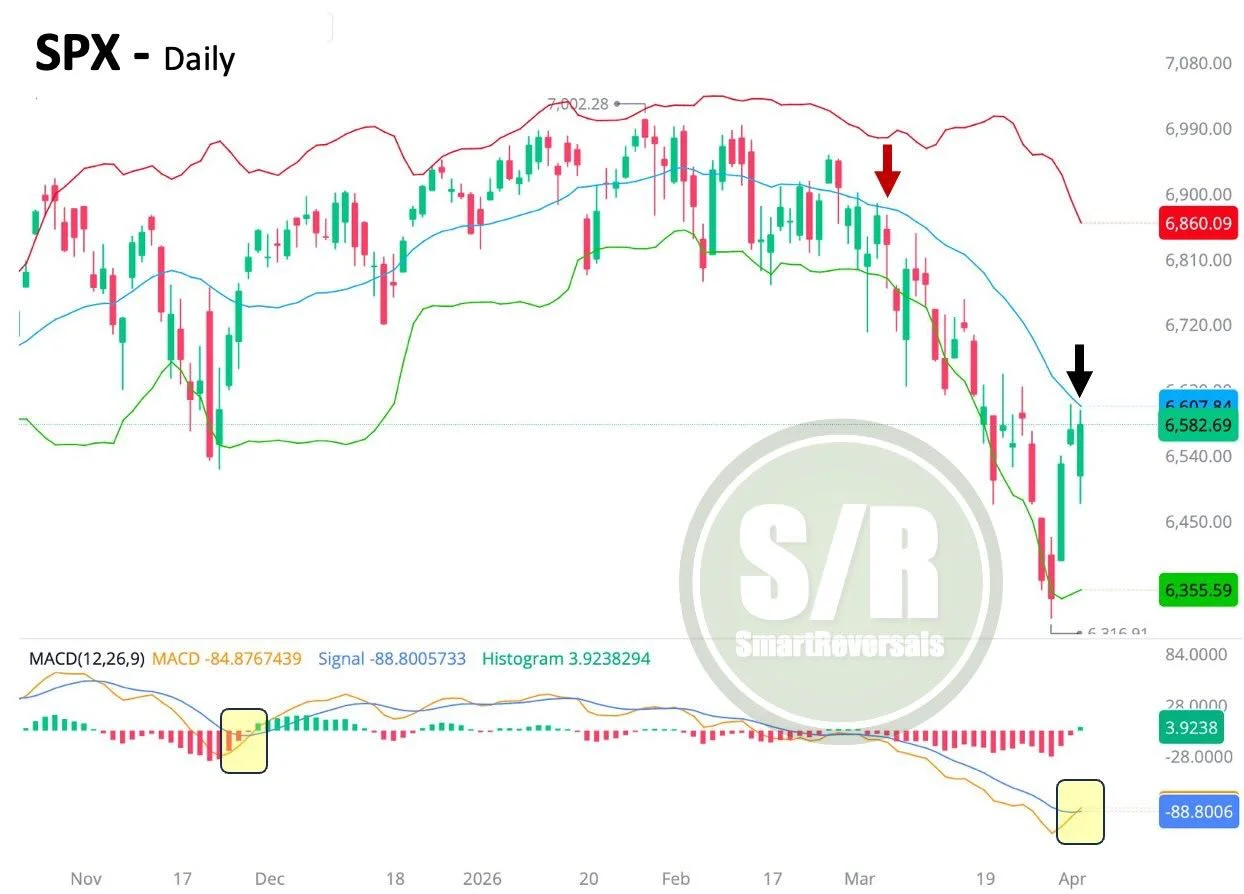
SPX MACD Cross Signals Potential Rally Above 20‑DMA
SPX: The bounce on Thursday completed a MACD cross that is worth watching even if there is a red opening this Monday. The new hurdle is the 20DMA, not touched for a month. Consolidation is likely, but even bear market...

US and International Stocks Record Third‑Worst Year Start
US vs international stocks.. still the 3rd-worst start to a year in the last 30 @augurinfinity $SPY $VEU https://t.co/bv48hVPlK9

Market Pauses After Hedge Burn, Awaiting Next Fuel
The market caught its breath this week, burned off some hedges and worked off oversold conditions, now we'll see how much fuel is left in the tank. We discuss in this week's episode. $SPY $QQQ $USO $XLE $VIX Watch here: https://t.co/pQRRTne2Ml https://t.co/NonzTIzPU0

Dragonfly Capital Forecasts This Week's Market Direction
Dragonfly Capital - What to expect from the stock market this week https://t.co/nYa6prRwe3 $SPY $IWM $QQQ $GLD $TLT and more https://t.co/XAP8Q37TwX
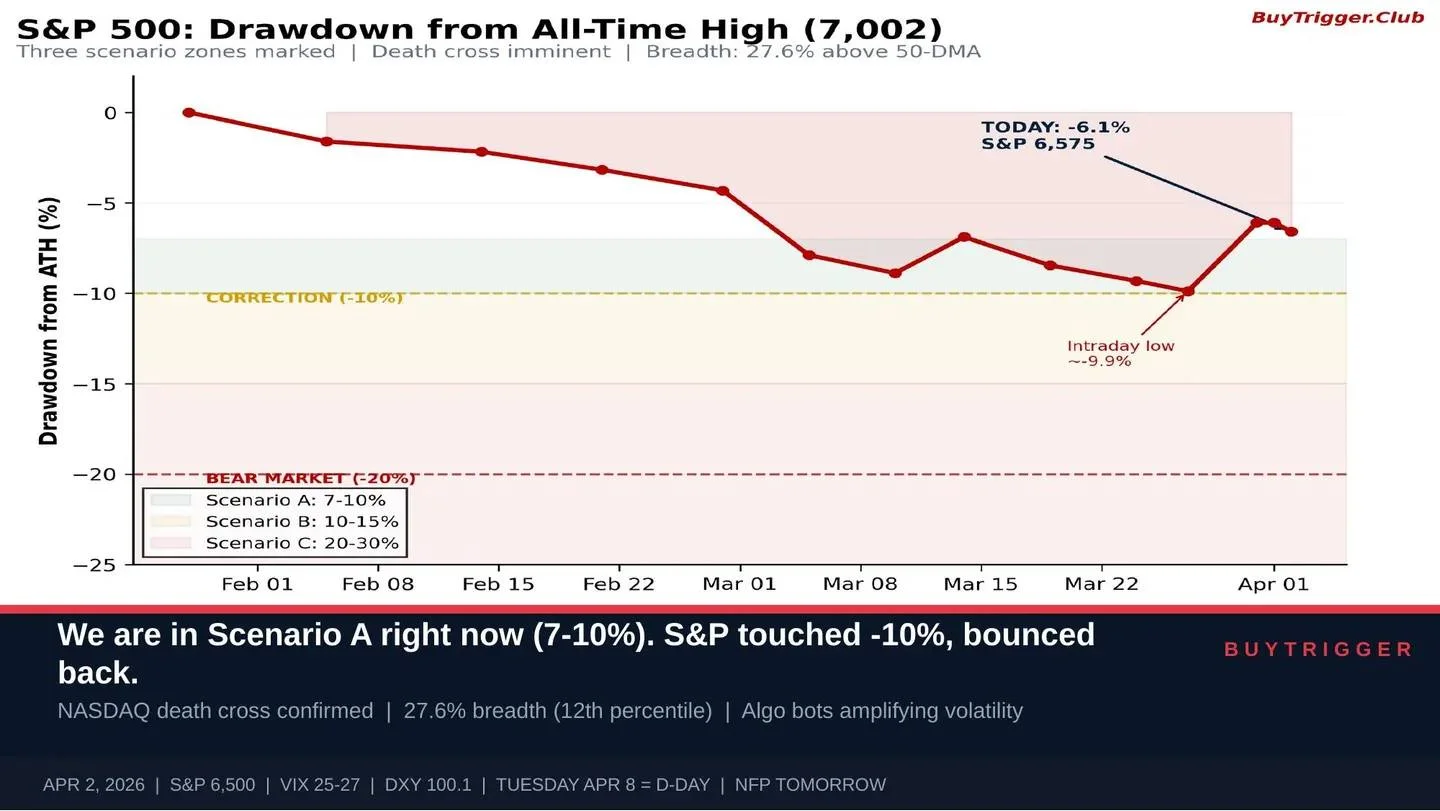
Market Near Bottom: Death Cross, Only 27% Above 50‑Day Avg
S&P down 7-8% from the January high. We touched -10% on March 27th and bounced. NASDAQ death cross confirmed. Only 27.6% of stocks above their 50-day average. We're in Scenario A. For now. https://open.substack.com/pub/dralexkoh/p/is-the-market-bottomed-in

US Jobs Data Fuels Dollar Rise, Stocks and Bonds Dip
Stocks and bonds may fall again while the dollar gains after deceptively upbeat US jobs data. #NFP #Stocks #Dollar #Macro #Trading #IranWar https://t.co/bSlTNo7Fkg

Tech Giants Face 20%‑Plus Slumps From 52‑Week Peaks
Current Mag 7+ drawdowns from 52wk highs... $NVDA -16% $GOOGL -16% $MSFT -33% $AAPL -11% $AMZN -19% $META -28% $TSLA -28% $AVGO -24% $ORCL -58% $CRM -37% $NFLX -26% $AMD -19% $PLTR -28% $MU -22% $IBM -24% $V $MA $AXP -20% $LLY -17% @finviz_com https://t.co/ll0K5GSWGx

Wall Street Rebounds; Jobs Surge, but Geopolitics Loom
Wall Street snapped its 5-week losing streak this week. S&P 500 +3.4%, Nasdaq +4.4%, Dow +3%. First positive week since the Iran war began. Then on Good Friday, a bombshell: 178,000 jobs added in March — triple the 59,000 expected....

Volatility Surge Highlights S&P Momentum and Value Shift
With volatility picking up, it is a great time to check back in with @StocktonKatie. We take a look at what the charts are saying about: • S&P 500 momentum • Mag 7 leadership • The shift to value • Gold and oil trends https://t.co/dn9QritHPV

Relief Rally Fades: Volatility Favors Small, Active Strategies
Markets staged a relief rally this week, but let's not get too comfortable. Two-way volatility favors smaller size and active management. We discuss where we see opportunity in this week's video. $SPY $QQQ $USO $SMH $XLB https://t.co/0IDPYxFYrM

Top 10 S&P 500 Stocks' P/E Drops to 23
The 10 largest S&P 500 stocks' P/E has fallen to 23.0x.. it was above 30 just a few months ago JPMAM https://t.co/MthUHSpayR

SPX Below 10‑Month MA Signals Potential Further Decline
$SPX - Closed below the 10 month MA. Going back to 2009 3 cases didn't have any further downside or only marginal further downside: 2011, 2015 and 2023, but in 2011 and 2015 the drawdown had already been at least...

SPX Hits 6300, Neutral FY26 Valuation Band
$SPX Pretty interesting 6300 found buyers, my Neutral Valuation Band level for FY26 (roll to FY27 as enter 2H26) https://t.co/Z3ppbki8g5
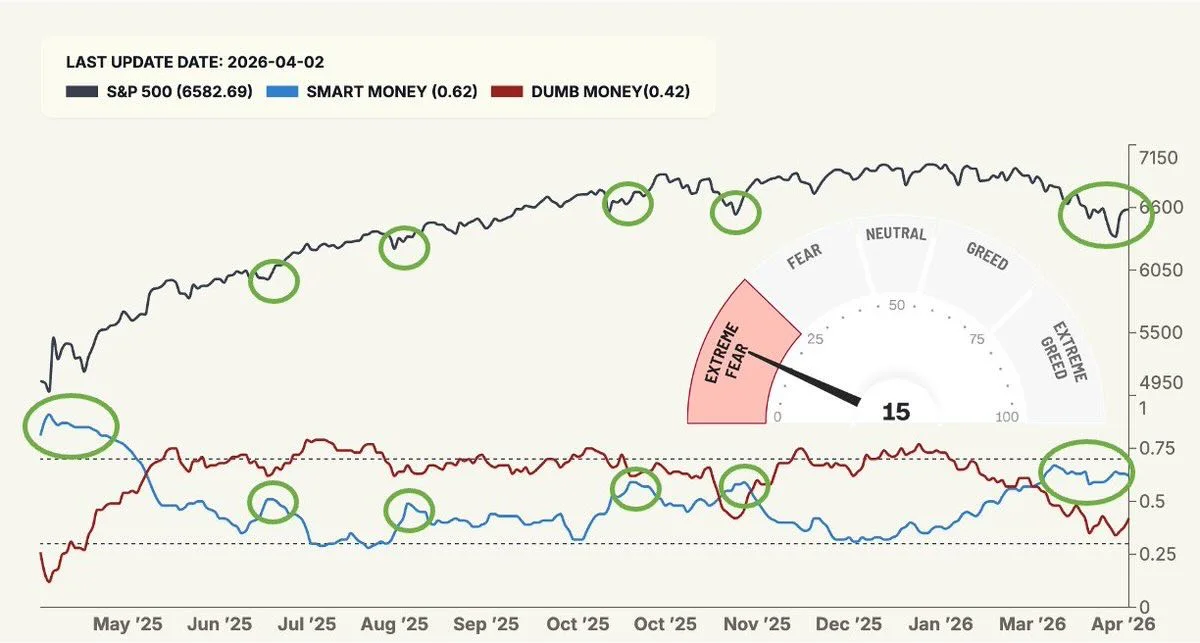
Smart Money Optimism Sparks Potential SPY Bounce
#SPX: Smart money confidence is optimistic while dumb money is neutral. The Fear & Greed Index continues at Extreme Fear. Green circles highlight increase in smart money confidence and bullish moves that followed. The bounce could have more fuel. $SPY