
Payroll Surge and Falling Unemployment Boost Bull Market
Good sign supporting the bull market U.S. Nonfarm Payrolls Jump 178K in March, Beating Expectations as Unemployment Falls to 4.3%

Equity Futures Slip Ahead of Jobs Data Release
Equity futures a little lower ahead of jobs report... they'll trade until 915am ET https://t.co/x9qe4wyzJv

Buy Signal Returns as S&P 500 Drops 9%
The S&P 500 just pulled back 9.1% from its record high. Sentiment indicators are flashing the same buy signal that nailed the bottom last April. 🔒 Members-Only https://t.co/GcAng779YL

US Stocks Rebound as Middle East Tensions Ease
JUST IN: US stocks finished mixed, bouncing back from early losses as Middle East diplomacy eased tensions sparked by Trump's threats on Iran before the holiday weekend.

SPY Holds $645; Early Long Entries Low‑Pain
$spy Daily. I try and simplify it. The level was $645 and it held. Didn’t gov much pain if u added to some long in the first 15-30-60 minutes https://t.co/2rNgNrybJI

Markets Rise Amid Volatility; Seize Long-Term Opportunities
Despite the volatility this week: $SPX +3.4%, $DJIA +3% and $CCMP +4.5%. Solid econ data as well. Volatility is expected to continue until war ends but if you wait for certainty you will miss some great LT...
S&P Flat as Oil Jumps 10%—Unexpected Loss
SPX flat with Oil +10% wasn't not on my bingo card. An L for me.

Homebuilder Stocks Falter, Signaling Economic Weakness
$XHB Daily. Homebuilder (& home construction in $ITB ETF) stocks remain weak, rejected at 20-day m.a. today (orange line). Long-term looking like major tops, too. Poor sign for economy/consumer https://t.co/bZnRRpRU33

SPX Bounce Success Isn’t Tied to 200‑day Average
The $SPX doesn’t need to immediately reclaim the 200-day moving average for this to qualify as a successful bounce attempt. In fact, the reflexive move off the lows over the last few days is NOT the most important part—these sharp...

March S&P Divergence Raises Concerns Ahead of Strong April
The $SPX closed out March with a clear contrast to the average performance of the month historically (past 75 years). April has averaged the second best month of the year over that time frame. If we deviate again from that...

S&P 500 Mirrors Intraday Treasury Yield Swings
$SPX is tracking intraday peaks and troughs in Treasury yields very closely as macro correlations remain elevated #fairleadstrategies https://t.co/9bi1kaFWxh

Tracking QQQ and SPY Weekly High‑Low Ranges
$QQQ this weeks recent high 587.74, recent low 555.60 $SPY this weeks high 658.52, low 629.28. Levels I am watching

SPX Rallies but Remains Under 20‑day Bearish Trend
We have some whiplash on time frames: the $SPX closed out its worst month in 12, we had the best single-day rally in 10 months Tuesday and the week is currently on pace to be the strongest in 17. All...

SPY Holds at 645, Most #630Club Picks Turn Green
$spy $645 held and most names we went over in the #630club went green. Nice tactical morning. Cooler heads prevail

TRACE Reloaded Reveals Hidden Pressure Behind S&P 500 Moves
There’s a code behind today’s market, and you’re ready to see it. The TRACE Reloaded event on April 9th uncovers the hidden pressure driving support, resistance, and volatility in the S&P 500, with more precision than ever before: https://t.co/hA4hvasgi0

SPY Bounces Near 5-Day MA, Market Uncertain
So we got the first half-hour bounce, the $SPY BOUNCED near the 5-day ma. Now what? https://t.co/Ya4nZJd5CG

Call Volume Spikes Align with QQQ, NVDA, Quantum Rally
Seems noteworthy that median daily call volumes traded across US exchanges peaked in October along with: $QQQ, $NVDA, Quantum computing stocks ($QBTS, $IONQ, $RGTI), $PLTR (a couple days into November, but still), and Goldman Sachs’ “retail favorites” index. https://t.co/oPZuFod0Gx

Equity Volatility Undervalued as Futures Slide 1.5%
The equity vol is still asleep relative to the oil move. The 0DTE SPX straddle is just $55 (85 bps). Futures are down 1.5% overnight. Something ain't right. https://t.co/kmBuM66ebE

POTUS Speech Sours Market Sentiment Before Extended Holiday
POTUS's address deflated hope, sending ripples across the capital markets as positions adjusted ahead of what will be a long holiday for many beginning tomorrow and extending through Monday. Damage control by US today? See https://t.co/O5f5DvtTFW https://t.co/GYMWErQvSW

Scott Redler’s Live Premarket Update Highlights
⏰ Scott Redler’s #630club - LIVE Premarket Stock Market Update ➡️ Free VIP List Newsletter: https://t.co/EW4O2nc6Yl $NVDA $TSLA $IBIT $SNDK https://t.co/WZ7YtFpIR6

War‑End News Sparks S&P Rally, Oil Surge
The S&P 500 just rallied on news the war will end soon. Oil jumped $4 and stock futures fell 0.8%. 🔒 Members-Only https://t.co/6xmtarJB5C

Markets Remain Fearful, SPY Faces Resistance Ahead
Market stays fearful and uncertain after Trump's comments. $SPY at key resistance. HTF charts still showing weakness. Tomorrow could be volatile with markets not being open on Friday.

Markets Surge on Trump Iran Claim, yet It's Just Headlines
Markets rallied again Wednesday — S&P +0.75%, Nasdaq +1.24% — on hopes Trump's Iran ceasefire claim is real. But Iran's Foreign Ministry called it "false." Oil fell below $100. Energy stocks got crushed (-3.74%). Tech led. Two straight up days...

SPX Targets 6,650 Upside, 6,400 Downside Tomorrow
Based on closing SPX positions, it looks like 6,650 is best case upside for tomorrow. Downside open to 6,400. GL https://t.co/o3MdAytDAn

S&P Barely Down 4% Despite Multiple Crises
The S&P is down less than 4% in 2026. This is despite a war, an oil spike, extreme levels of anxiety about AI disrupting every industry on earth, rising interest rates, private credit worries, and big tech companies moving either...

Green S&P Sectors Led by XLI
current S&P sectors of the 11 9 are green lead by $XLI $XLK and $XLB

Crucial Final Half‑hour After SPY Rally, Retreat
Feels like an important final half hour here.. given yesterday's rally and this afternoon's retreat $SPY @stockcharts https://t.co/87IFBBks6S
Markets Already Factored In Trump’s 9 PM Speech
Trump speaks at 9PM. SPX +3%, VIX near lows, oil <100… What’s already priced in?

Growth Stocks Lag as NDX Hits Resistance, Breadth Weak
A number of growth stocks not participating in today's Day 2 short-covering rally in the indices. Normally, breadth is very strong at the start of a durable advance. $NDX $QQQ now bumping against overhead resistance (November-low), next few days will...

GOOGL Daily Chart Updated: 65‑Minute Outlook Preview
$GOOGL daily chart updated. The 65 min with some education and what I see coming next. https://t.co/QSkUPVCFqw
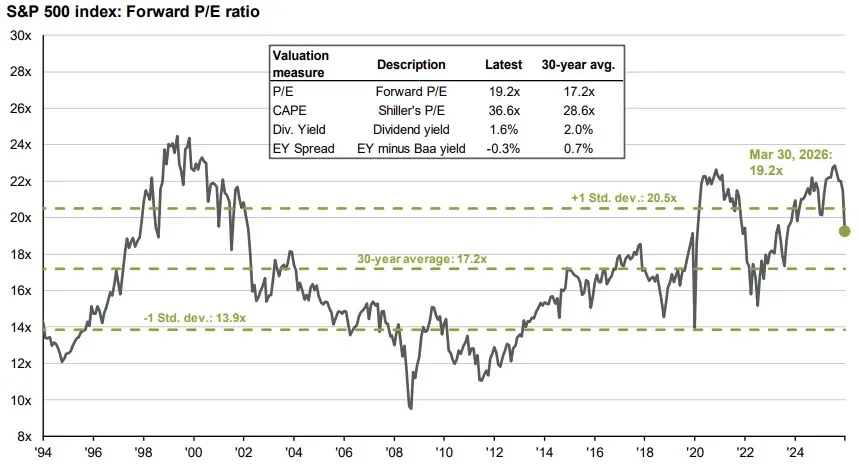
S&P Forward P/E 19.2x; 8 Cheap Growth Stocks
The Forward P/E for the S&P 500 is now sitting at just 19.2x. 🧵Here are 8 stocks trading even lower with double digit earnings growth:

30 Best Daily Charts Spark Fresh Ideas
Appreciate making the @dailychartbook report last night. I've said this many times, but it is simply one of the best places to get 30 of the best charts each day. Every time I read it I learn something and get...

Gap Fill Speed Reveals Underlying Trend Strength
$SPY would have to decline to 651.54 and $QQQ to 578.64 to fill this morning’s potential breakaway gaps, and $QQQ has now filled last Thursday’s gap. (No fooling…) How quickly the gaps get filled -- if at all – gives...

Rising Input Costs Push Index Up, Inflation Near 4%
This index "has now risen by nearly 20 points in just two months, as higher energy prices have come amid rising costs of other raw materials. On past form, it now looks consistent with headline inflation rising to 4% in...

Market Nears Support, Yet No Oversold Signals
How far do we go down? No one knows of course, but the weekly chart shows that we are approaching the previous peak of 6127. That should act as support, as well as the rising trendline. However, the percentage of...

Mag 7 Slump Drags S&P; Breadth Still Not
The Mag 7 are now leading the way down, which means that the cap-weighted S&P 500 is following suit. The M7 peaked last October and is down 17% from that high. That’s almost twice as much as the S&P 500....

Market Stress Unites Cap and Equal‑Weighted S&P 500
During times of market stress, correlations tend to converge to 1, and that is the case now within the equity markets. The chart below shows that the S&P 500 cap-weighted index is suffering the same fate as the equal-weighted index....

Fundamentals Strong, S&P 2026 Target 7100 Signals 9% Gain
"Although sentiment has soured, fundamentals have remained resilient. S&P 500 2026 earnings estimates rose 2% in March, pushing consensus growth expectations up to 17% YoY. At the same time, the S&P 500's forward PE sits ~15% below its recent peak...
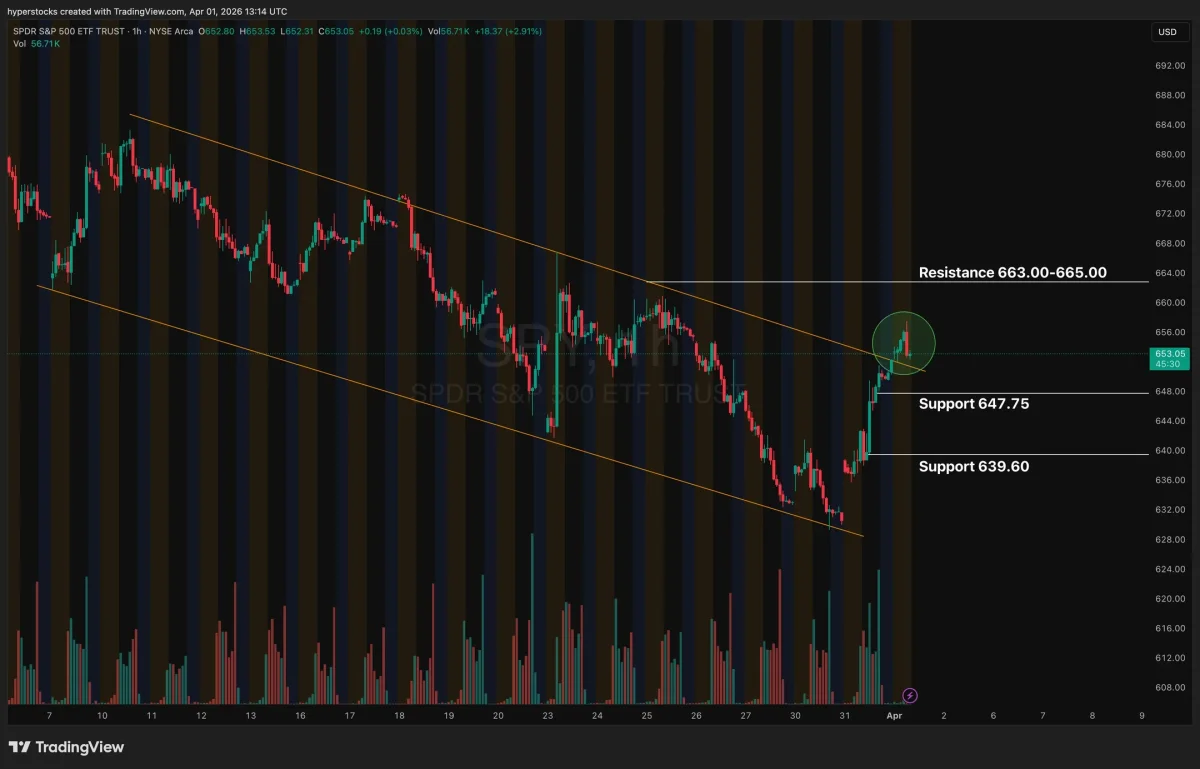
SPY Breaks Out, Eyes 665 After Sideways Phase
$SPY kicking off the new month AND quarter with a breakout above its multi-week consolidation channel. Watch for sideways action before an attempt to break through 665.00.

S&P Quarterly Chart Shows No Clear Uptrend
S&P 500 $SPX quarterly chart... remind me again why you don't think stocks are in an uptrend? https://t.co/7HYe4z8jog

Higher Open Fades Near VWAP; Downtrend Still Intact
Markets are higher this morning but pulling back a bit right now and at the overnight VWAP ⚫️. Let's see how the anchor from yesterdays news is handled 🟣 if there is further weakness. Keep in mind the 5 sma...

Watch Key Levels for Macro‑Driven Risk‑Off Moves
Here’s is my🔥 #stickynote for April 1, 2026: Macro-heavy session with data + Fed speakers — watching for risk-off tone and reaction to key levels 👀 🧠 Macro Focus: Oil strength + macro catalysts could keep pressure on equities. Expect moves driven by...

Pre‑Market Outlook: Short Leash, Drop Laggards, Dollar‑Driven Moves
(PREMIUM) The Lyons Share Daily Pre-Market Outlook & Charts videos for 4/1/2025 are up: https://t.co/lSmWM5IZh8 Today's Themes: 1) SHORT Leash 2) Lose The LAGGARDS 3) DOLLAR Driver Among markets covered: $SPX $NDX $VIX $SMH $XLB $XLE $GDX $EEM $EFA $GLD $SLV $ETH...

Model Signals New Equity Buy as VIX Drops
my S&P 500 $SPX vs. volatility $VIX model fired another buy signal for equities yesterday as it settled... https://t.co/3FNpIhBqkB

Beyond Meat Shares Plunge; CEO Blames U.S. Culture
Beyond Meat tumbles as CEO blames American society for its business struggles after issuing weak sales outlook https://t.co/YX9hzenK9z $BYND https://t.co/btUu0uOuGM

SPX Breaks 6427, Eyes 6553 with 6705 Target
$SPX clearing 6427 to see 6553 and futures +45 for follow-through. Now it’s trim and trail, with 6595–6620 as the next resistance that can pause the tape. The bigger “grudge match” spot is closer to 6705ish, but we’ll see how...

US Stock Volatility May Ignite Recovery Amid Deflation
A Lose-Lose? Crude Spike vs. Buried Equity Volatility - Subdued US stock market volatility may have found a worthy spark for recovery, with deflationary implications. US stock-market capitalization was down about $6 trillion year to date to March 30, representing...

Indices Slip Below 10‑Month Average, Market Regime Shifts
The 10-month trend just broke... @JC_ParetsX S&P 500, Dow, and Nasdaq 100 all closed below their 10-month moving average... Below this moving average the game changes. 👉 https://t.co/TpNVplzM2d https://t.co/gpvGkc0c2p

US Equities Modestly up, Japan ETF Leads Gains
$SPY +0.4% $IWM +0.5% $EWJ +2.5% $EEM +0.5% $TLT +0.2% $USO -2.5% $IBIT +1.1% $GLD +0.7% https://t.co/vAMCPhUunR

Nasdaq Ends Q1 Upbeat Despite 7% YTD Decline
Tech savvy Nasdaq Composite index closes the 1st calendar quarter of 2026 on an upbeat note after going sideways for most of past 3 months; year-to-date, Nasdaq Composite has been down 7.11%. https://t.co/t4IdP3uYzK