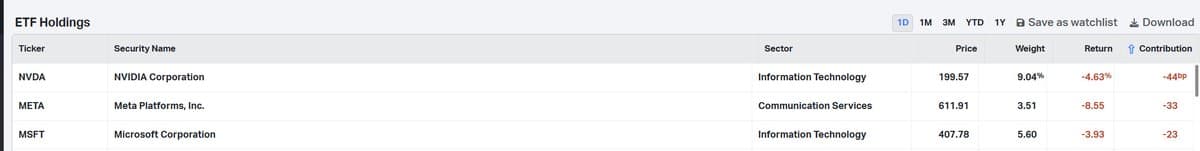
QQQ Climbs 0.9% as Non‑big‑tech Rallies 2%
the $QQQ was +0.9% today... $NVDA $META $MSFT detracted -1% from that number, leaving the other 97 tickers +2% on the day... h/t @KoyfinCharts https://t.co/xpa4W104Sd
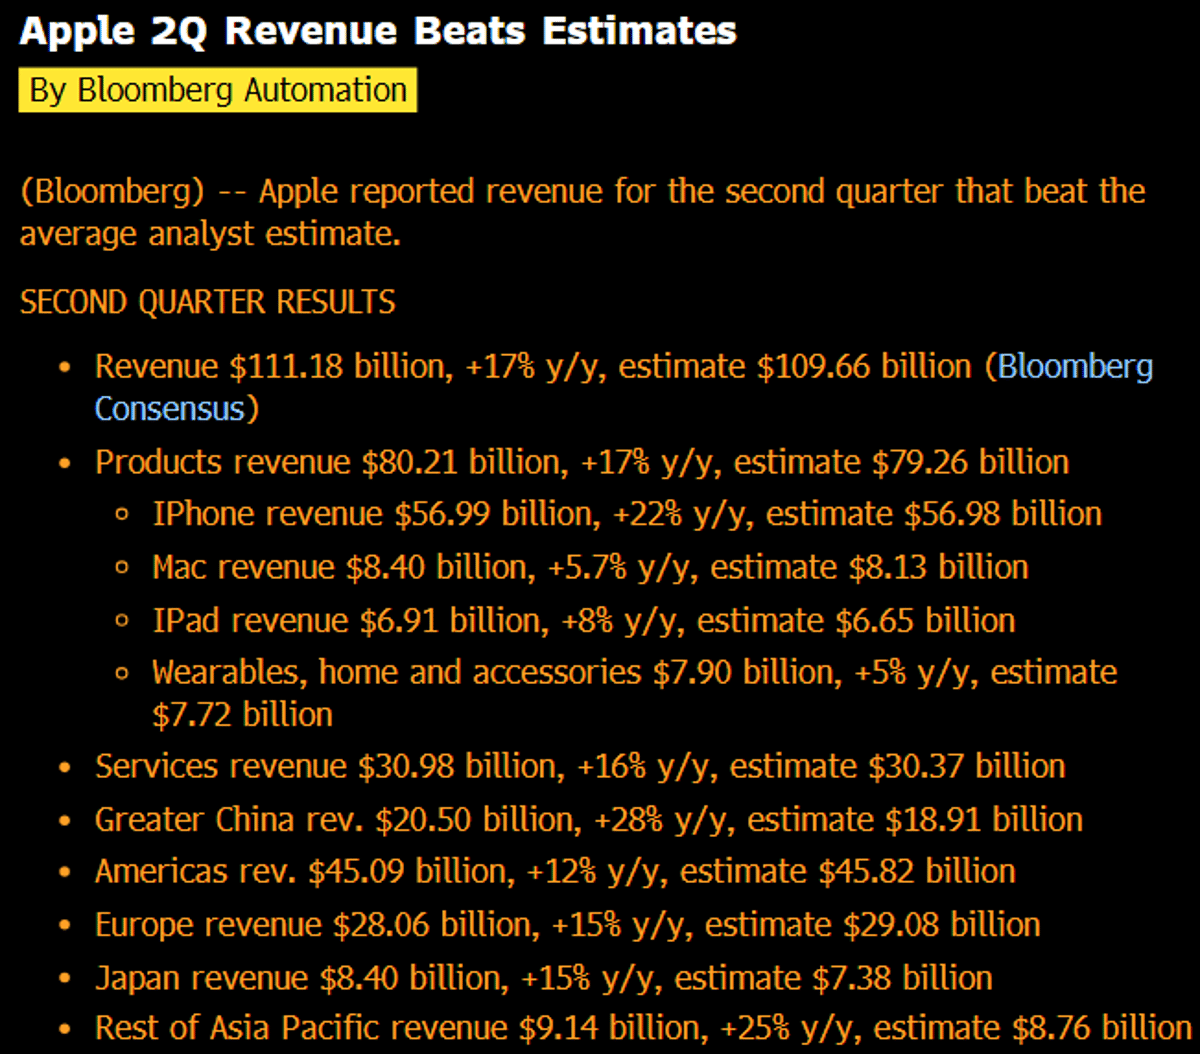
SPY Hits ATH as Apple Posts $111B Revenue Beat
$SPY closes at ATH and then Apple just reported quarterly revenue of $111b that beat analysts' estimates.. nice breakdown of just how much money they make and how: https://t.co/Br9j6yDTNs
Apple Beats Estimates, Shows Broad Segment Strength
$AAPL this is a clean beat with broad strength. iPhone +22%, Services +16%, China +28%, gross margin 49.3%, and the $100B buyback. If management’s call commentary does not walk down June-quarter expectations, this should read bullish.

Fermi America CEO Fired After 81% Stock Plunge
Plot thickens at Rick Perry's @FermiAmerica . Fresh SEC filing reveals former CEO Toby Neugebauer was just fired altogether for cause, removing him from the board -- after stock for this planned colossal AI energy campus plunged in value 81%....
S&P 500 Posts 10%+ Monthly Gain, Rare Historic High
The S&P 500 just went 10%+ for the month and finished the month at a new all-time high monthly close. The precedent? Nov-20 Dec-91 Jan-87 Nov-80
SPX Upside Bet Hits 7209 Target
As posted pre-market MONDAY: “I’ve got SPX 7191 tagging as upside bet” We tagged 7209 today/EOM close. https://t.co/k9g9uy0uak
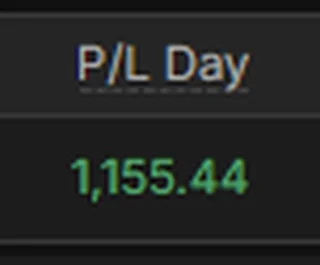
Recovered Losses, Closed up 2.6% with SLNH, OSCR, HOOD
Recovered the losses from yesterday a little bit. Ended the day up 2.6%. Big winners were $SLNH, $OSCR and $HOOD. No trades today. How did you guys do?
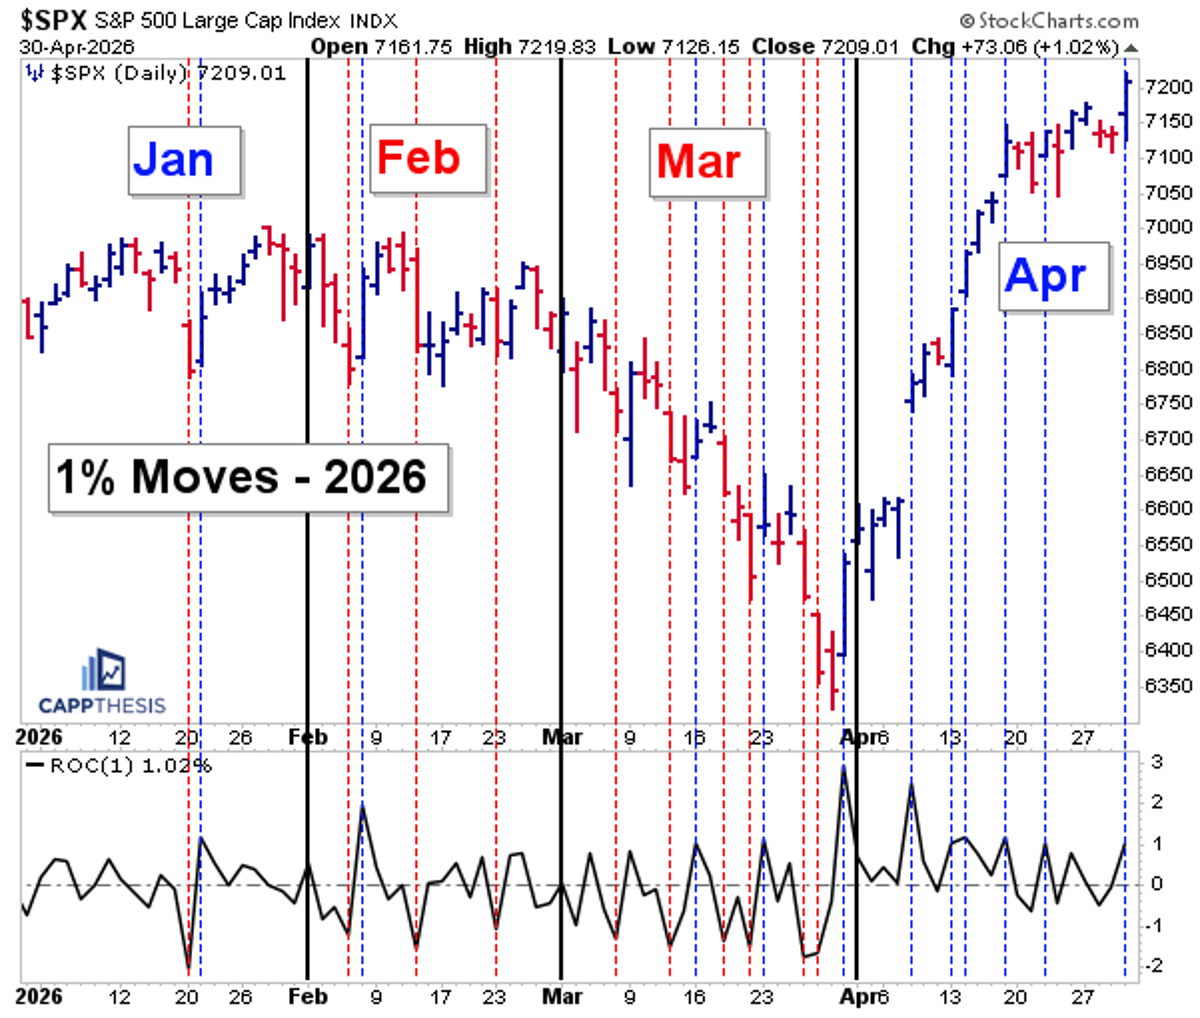
April S&P 100% Up Days: Rare Historical Event
The $SPX finished April with six 1% gains and zero 1% losses. This is rare. Since Aug 1973, it’s only happened 3 other months: Oct 2015 → -0.7% YTD Dec 1991 → +28.0% YTD Jan 1976 → +18.2% YTD source: @StockCharts https://t.co/jlP09VYfQG
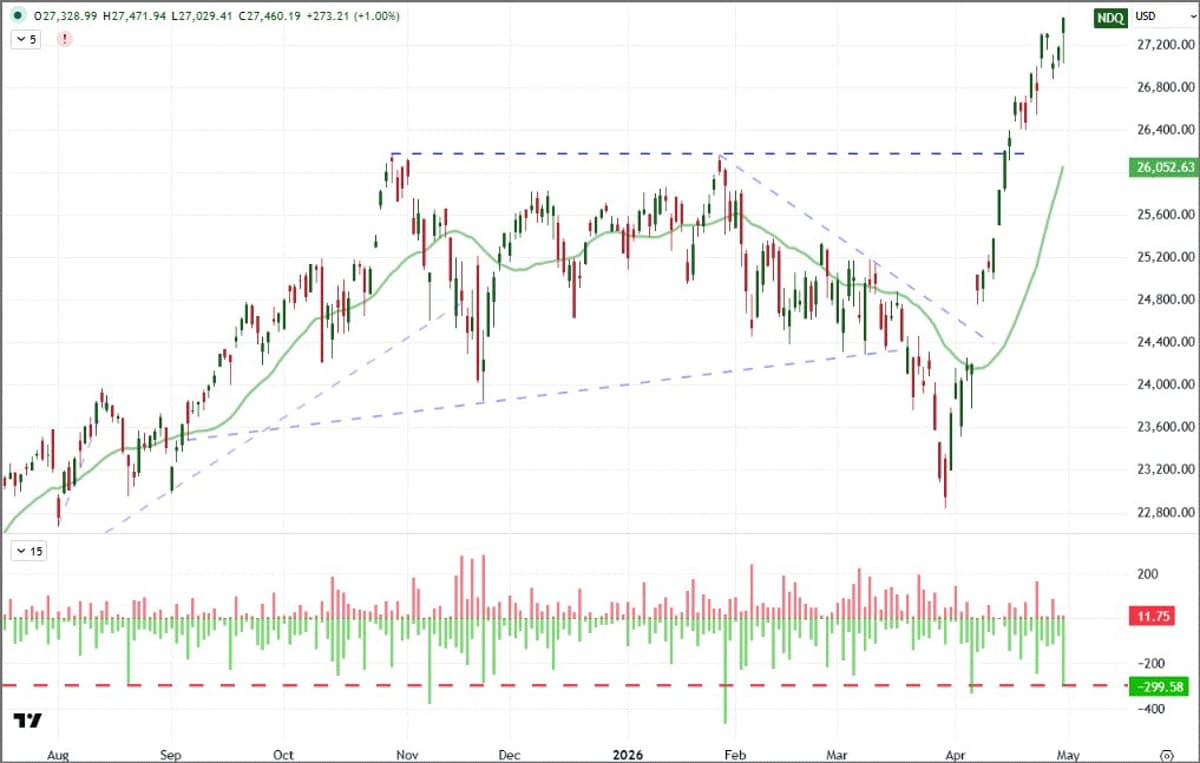
Nasdaq 100's Rare Large Lower Wick Signals Potential Weakness
With its recovery move, Nasdaq 100 has put in a larger 'lower wick'. Quite unusual to see a large (over 1% of spot) wick at a record high. Last time was Jan 25, 2021 and only three instances in the...
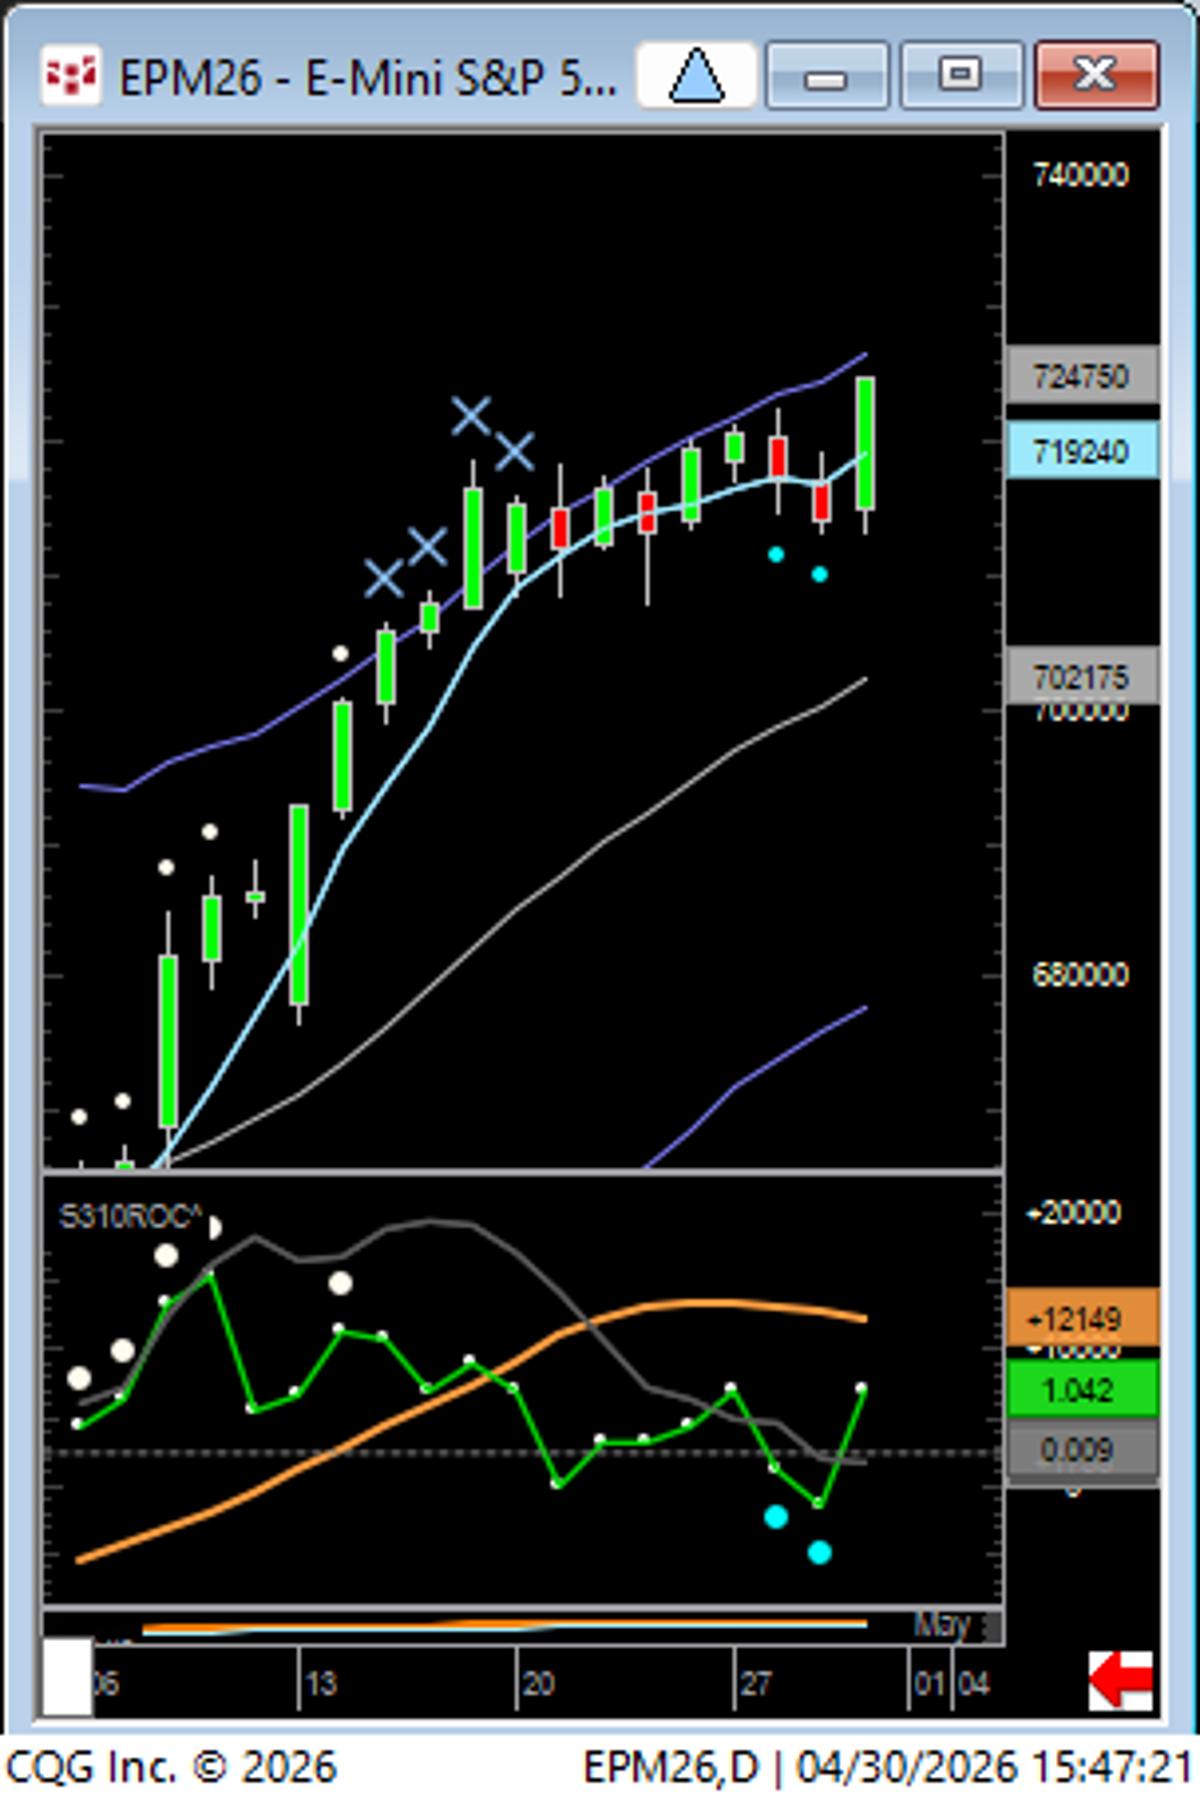
Trend Day Surge Leaves 7223.25 Behind, ETFs Lead
Pure trend day UP off Buy Day, 7223.25 PH left in the dust. Will be important level for tomorrow. AIPO FAN IFRA and POWR top performing ETFs. but laggards like XLV...
SPY Surges Past Bull Trap, Breadth Signals Strength
SPY powering into highs, a lot of talk yesterday about "bull trap", ended up being a bear trap, great breadth signals opening hour, 8-MA held firm whole consolidation period

S&P 500 Surges Past All-Time High Despite Energy Crisis
The S&P 500 shrugs off global energy crisis and hits a new all-time high https://t.co/VUKIJmA8mW
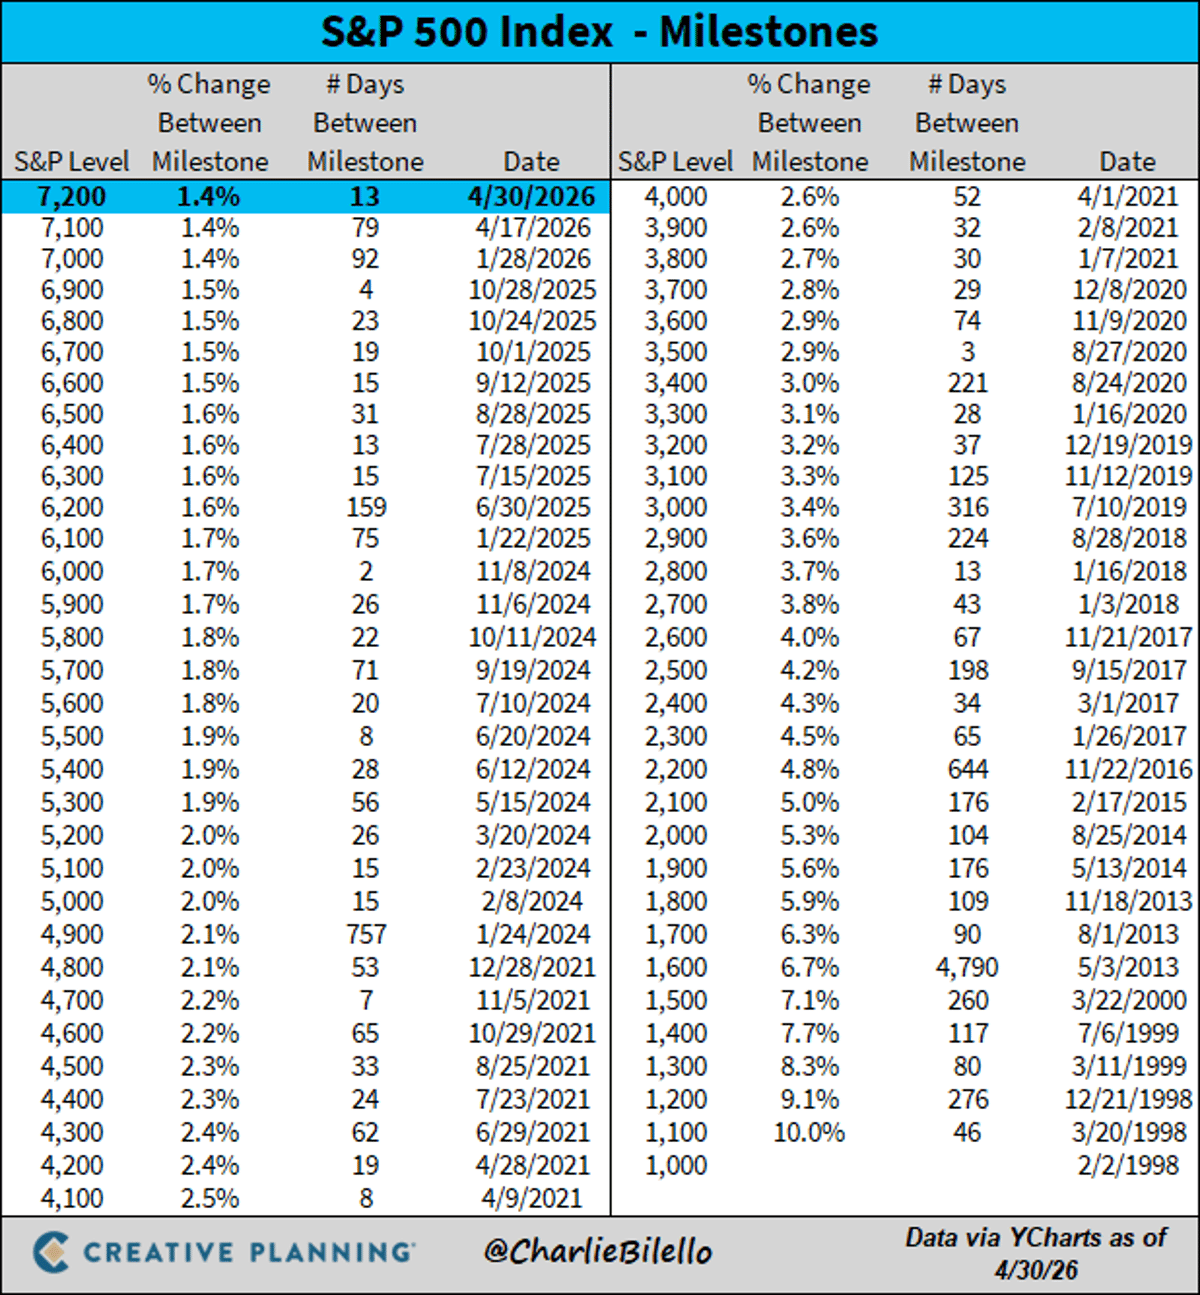
S&P 500 Surpasses 7,200, Doubling Decade‑Long Gains
The S&P 500 just crossed above 7,200 for the first time. A year ago it was at 5,600. 5 years ago it was at 4,200. 10 years ago it was at 2,100. $SPX https://t.co/b24VEKNTKj
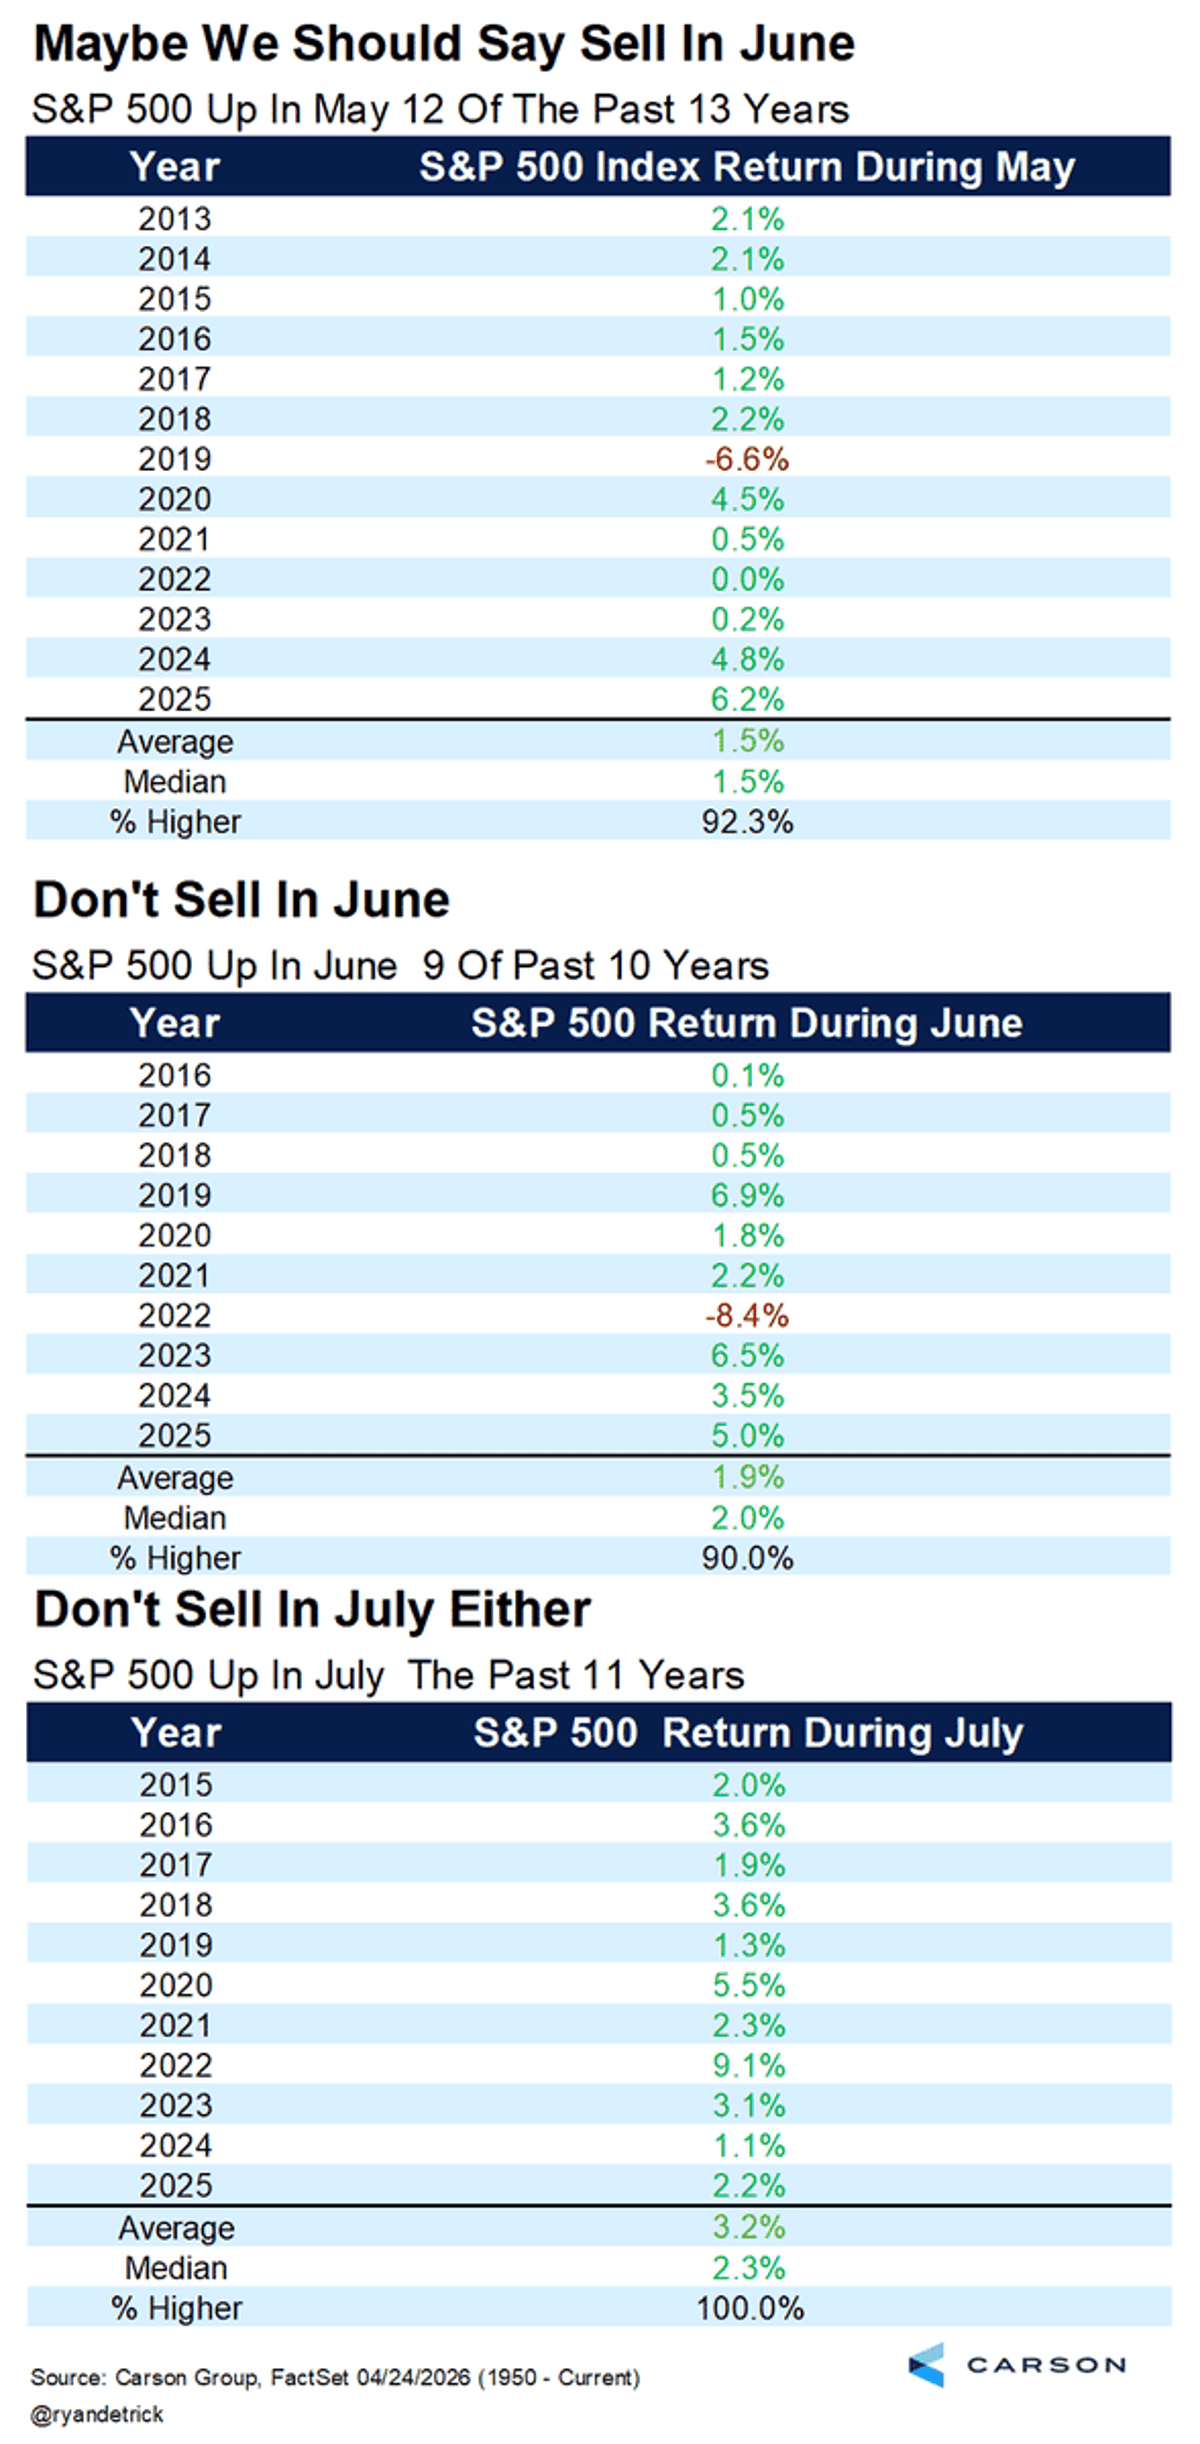
S&P 500 Historically Rallies in May, June, July
Love reading @dailychartbook each day, but even more when I realize I'm in there ;) 28. SPX seasonality. "The S&P 500 has been up 12 of the past 13 Mays. The S&P 500 has been up 9...
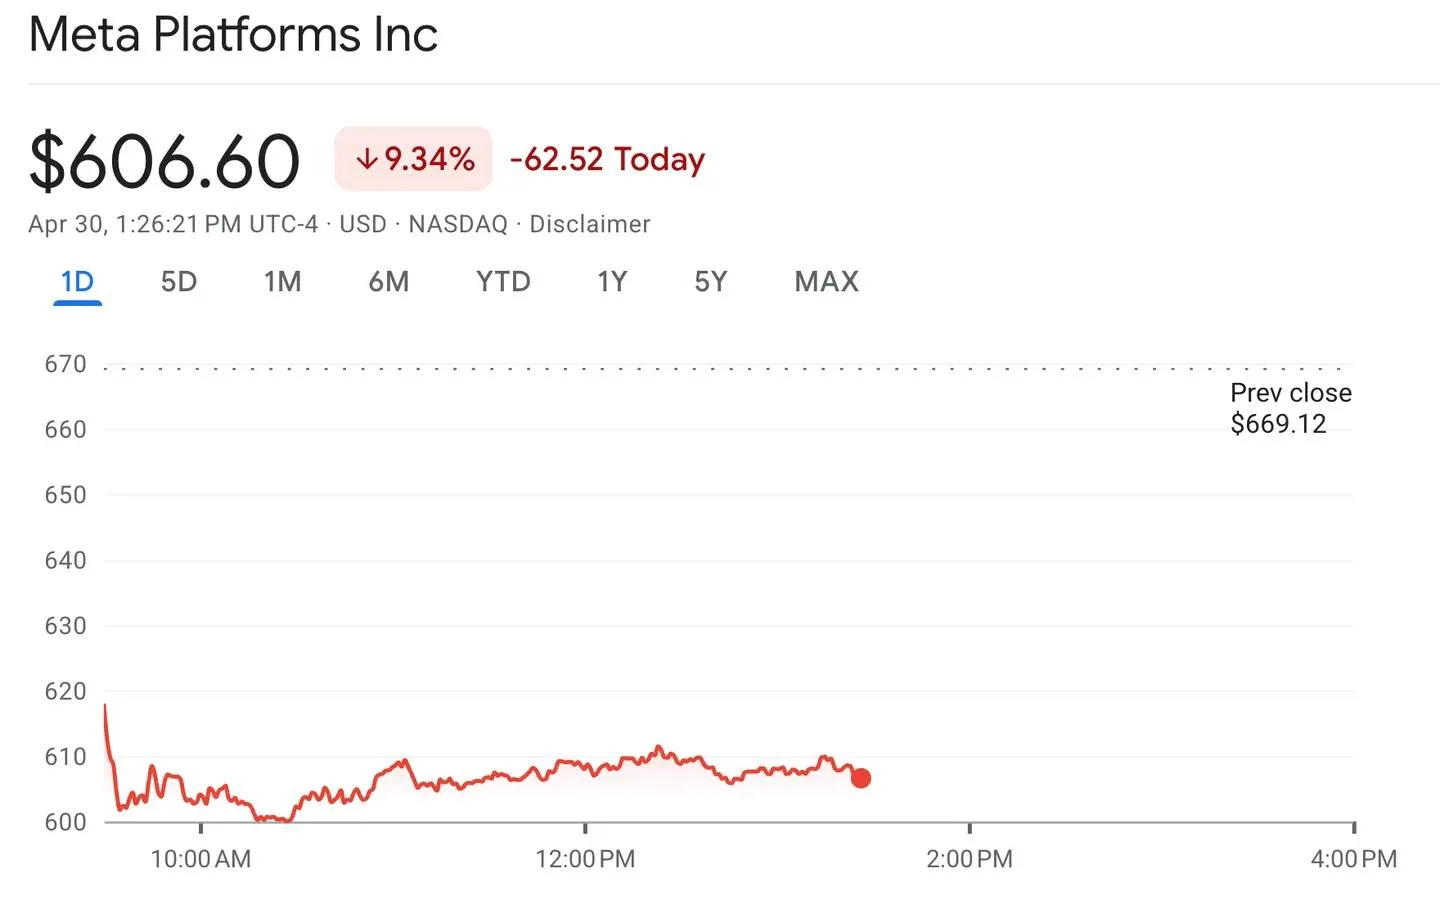
Meta Hits Valuation Bottom, 20x Upside Potential
Meta down -9% today. 20x fwd earnings + 18x fwd. EBIT. $META bottomed at 12x fwd earnings and single digit fwd. EBIT back in 2022, when the company fought three headwinds simultaneously.
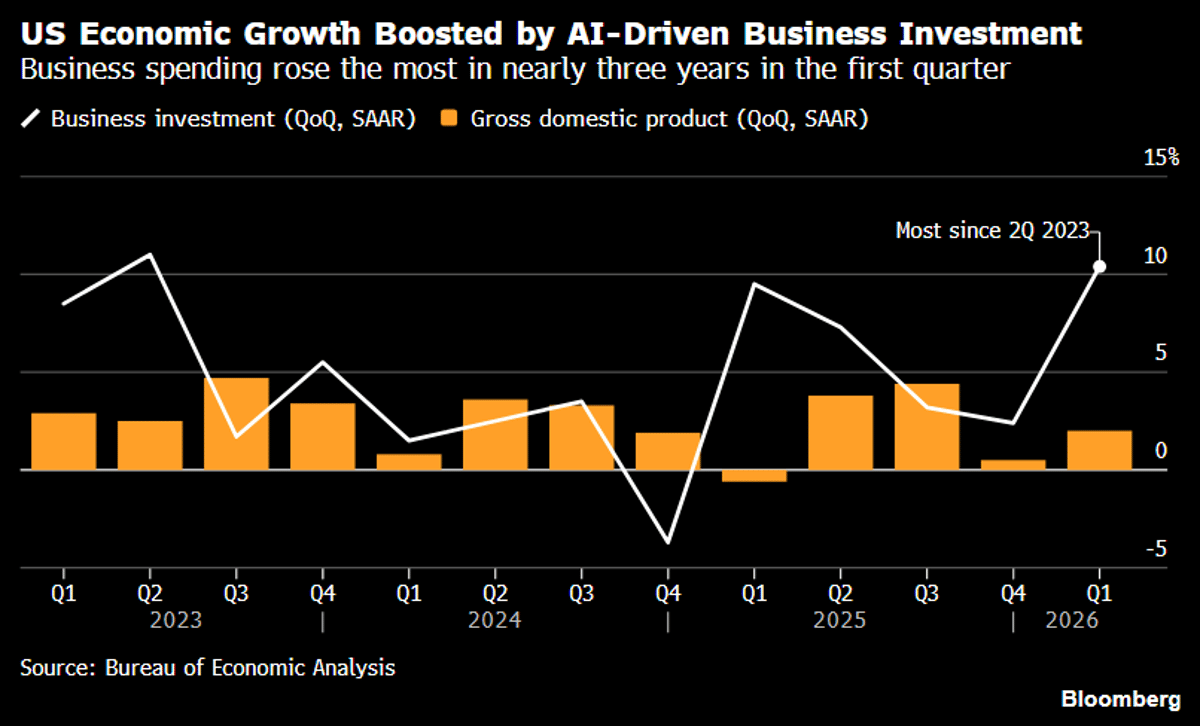
US Q1 Growth Defies Shutdown, AI‑Driven Investment Surges
The US Economy grew by 2% in Q1 despite shutdown as business investment grew by most in 3yrs on AI and consumer spending grew by a better than expected 1.6%. I can literally hear some ppls' teeth gnashing (thoughts and...
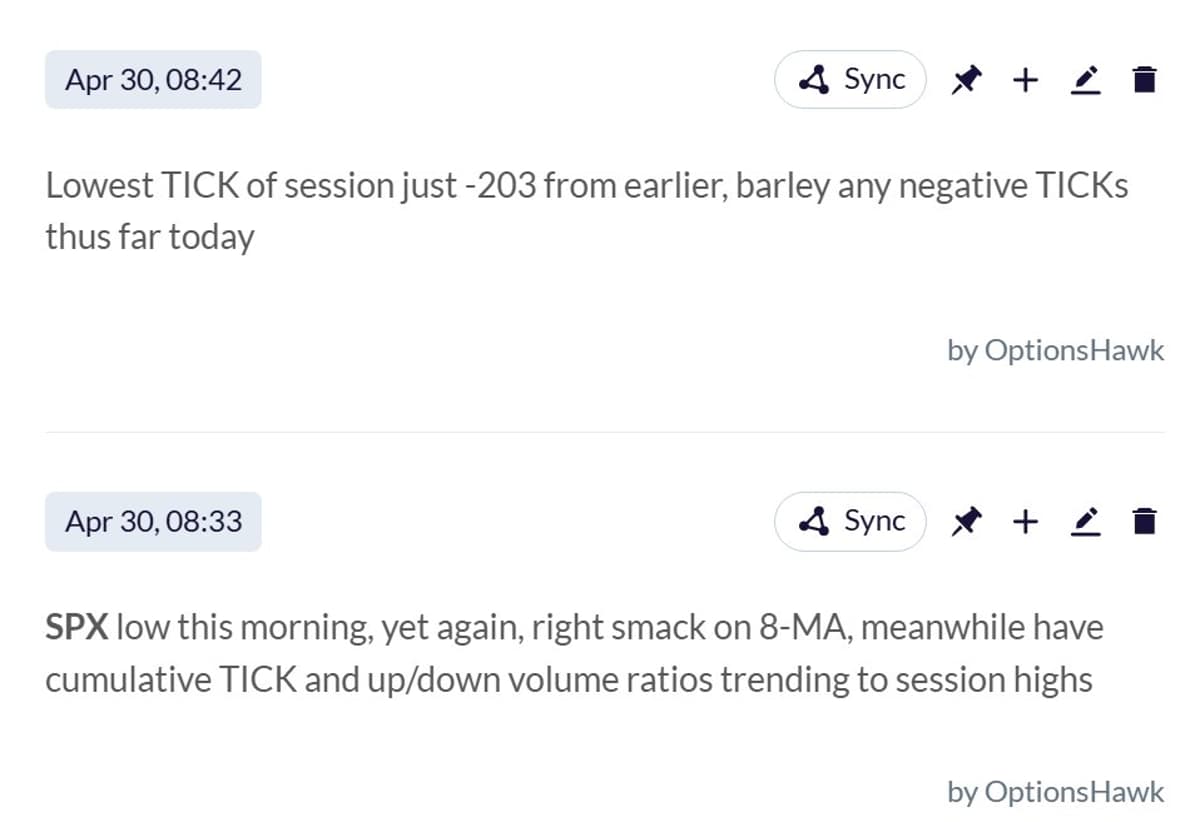
Solid Breadth Signals Dip Was Fake, Stocks Set to Rise
Breadth staying rock solid, that early dip in stocks showed zero signs of real selling, and was a great signal we would rip higher https://t.co/lnD4Mep9fQ

Capex News Splits Big Tech: Alphabet Up, Meta Down
April 30, 2026. The market just split Big Tech in half. Alphabet +7% on a capex raise. Meta -9% on the same kind of news. Microsoft -5%. Amazon flat. Same headline, four different verdicts. That tells you something important —...
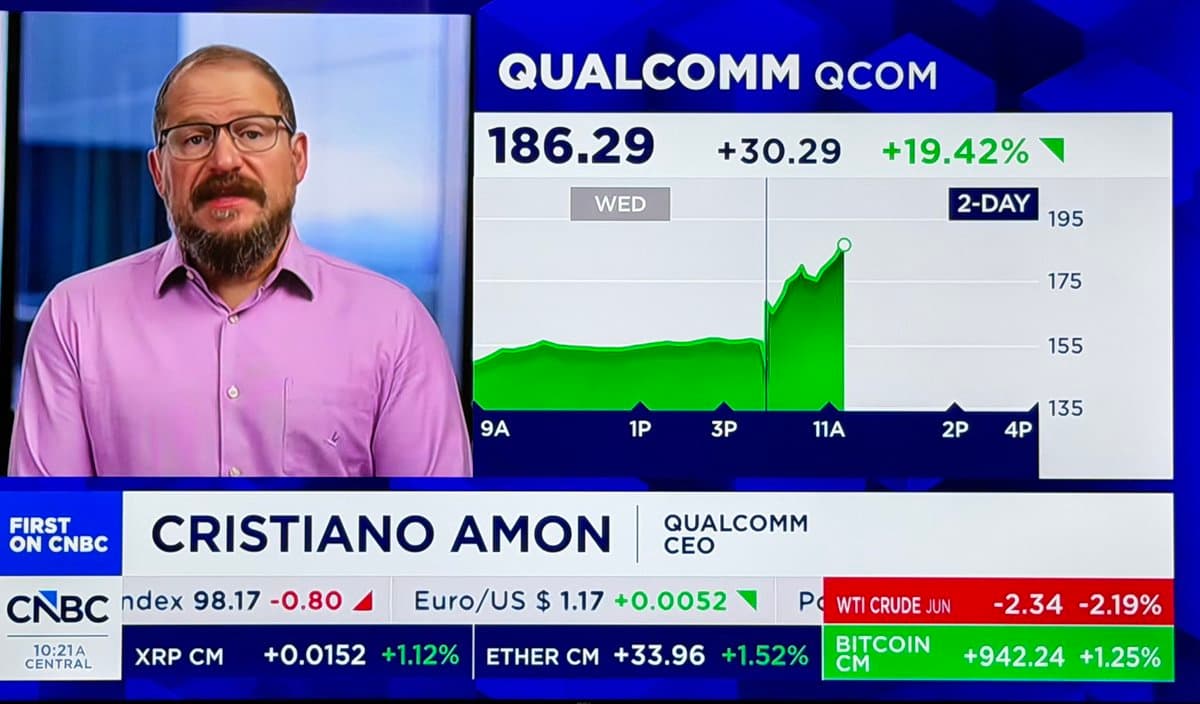
Qualcomm Shares Surge 19% on AI‑focused Earnings Beat
.@Qualcomm stock is up 19% on earnings beat, and datacenter & AI expectations. Qualcomm CEO spoke to @jonfortt on CNBC moments ago. ‘Agent driven devices ‘ will need more CPU, says @cristianoamon, Qualcomm CEO. I will argue that we have...
US Market Loses $600B Amid Trump News, Oil Spike
🚨 BIG SELL OFF IN US MARKET 🚨 $400,000,000,000 wiped out in just 40 minutes of opening US Market. This came after $200,000,000,000 wiped out yesterday over BAD NEWS COMING FROM TRUMP. OIL price $105 raising tensions for INDIAN STOCK MARKET &...
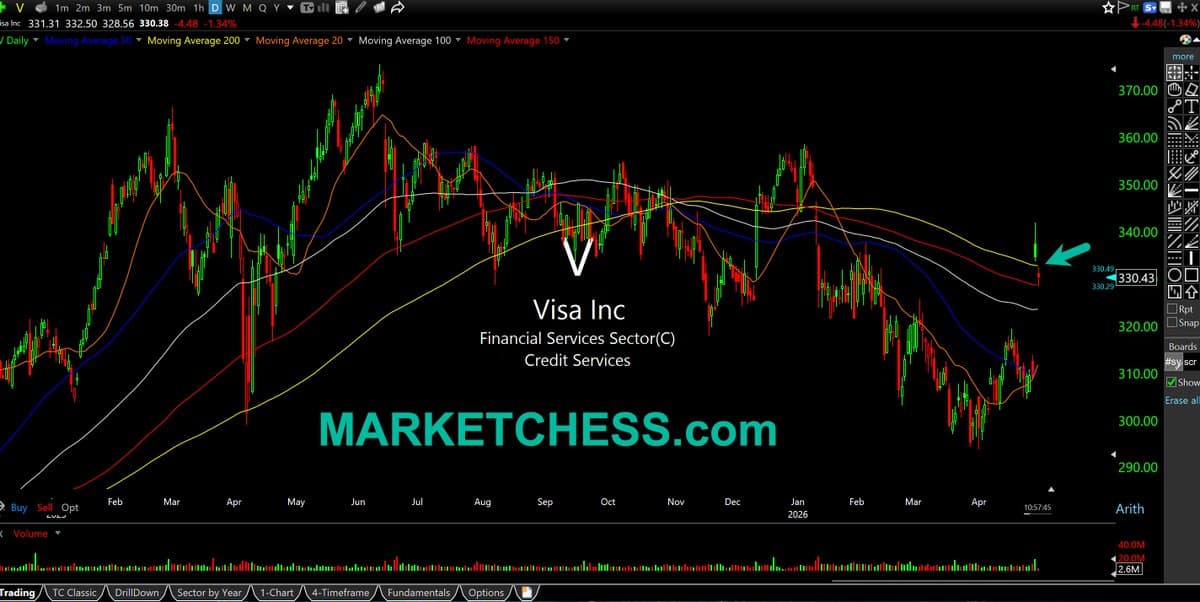
Visa Drops Below 200-Day MA, Marks May Batt
$V Daily. Post-earnings pop, Visa back below 200-day moving average. This price level also goes back 20 months as being significant. Battleground area headed into May for Dow component https://t.co/eq2VIbxEN8
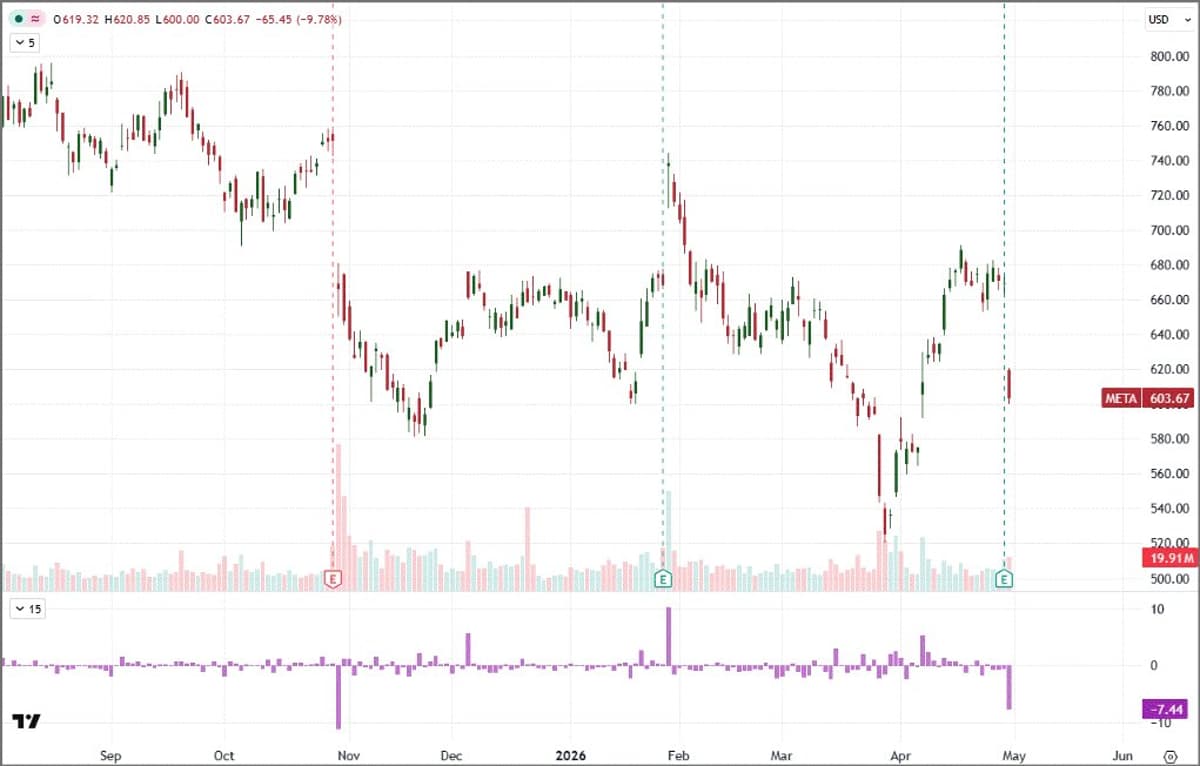
Meta Beats Earnings but Spending Worries Drive Stock Down
$META's earnings response is less ambiguous. Though it also beat top line, the spending concerns were already driving the stock lower after hours last night. We start with a -7.4% gap lower on the open and we are adding to it...
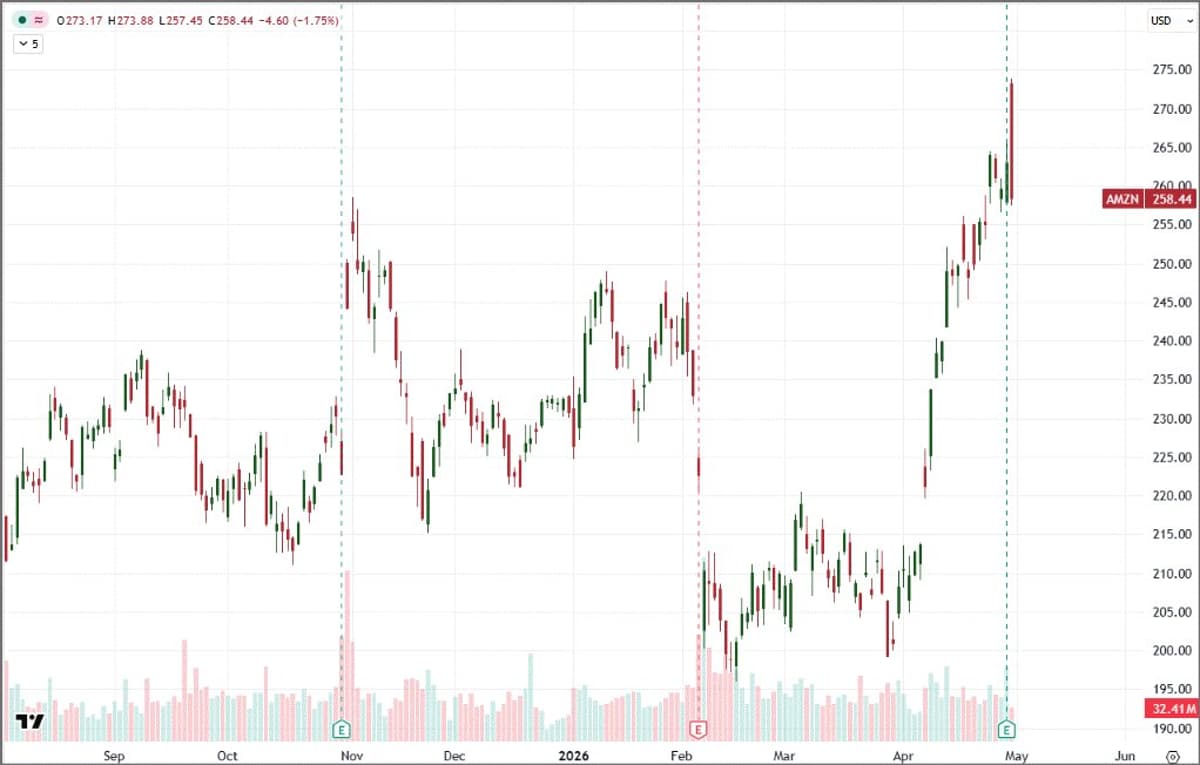
Amazon's Earnings Beat Sparks Brief Surge, Then Decline
That's an interesting earnings reaction... $AMZN beat topline, which probably earned that initial 3.9% gap higher on the open, but it has reversed all of those gains and more: https://t.co/PPwVRjEAyJ

Equal‑Weight Index Beats Weighted Despite Blockbuster Mags Earnings
Blockbuster earnings from the Mags…BUT the equal weight is massively outperforming the weighted index today. 🤔
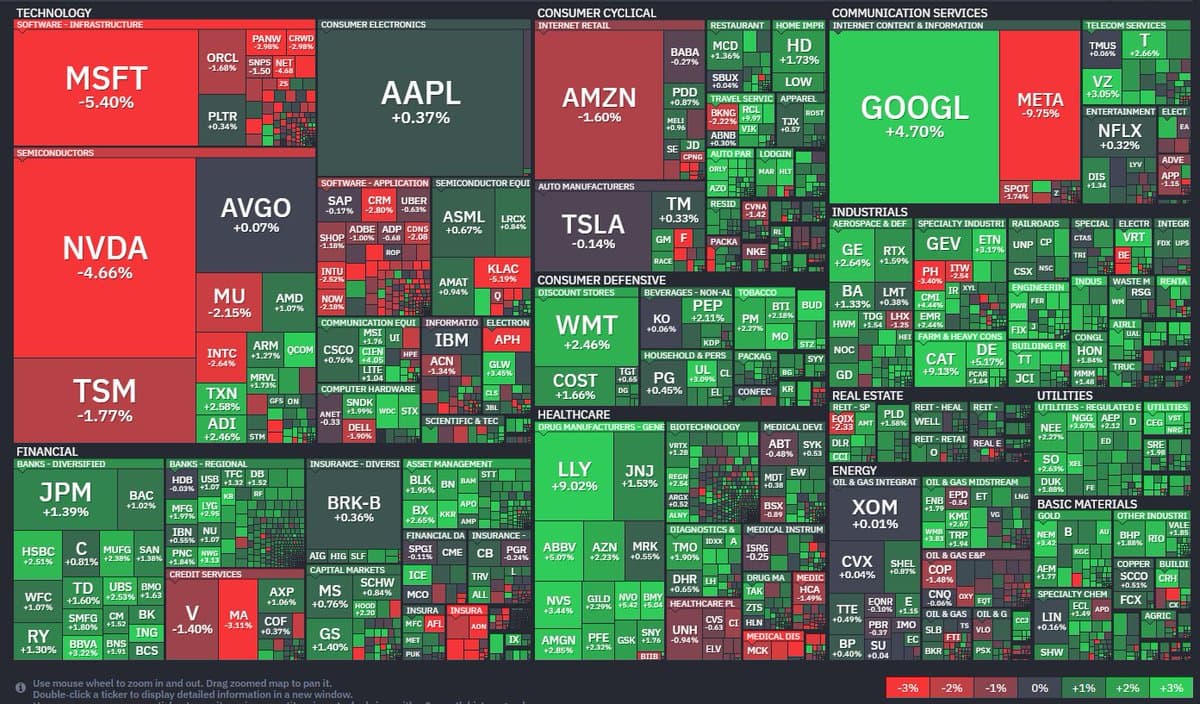
Global Markets Surge as US Mega‑cap Tech Lags
A ton of green away from US mega-cap tech $RSP, SMIDs, & ex-US +1%... bitcoin, bonds, gold also up https://t.co/DbNQGqHO7X
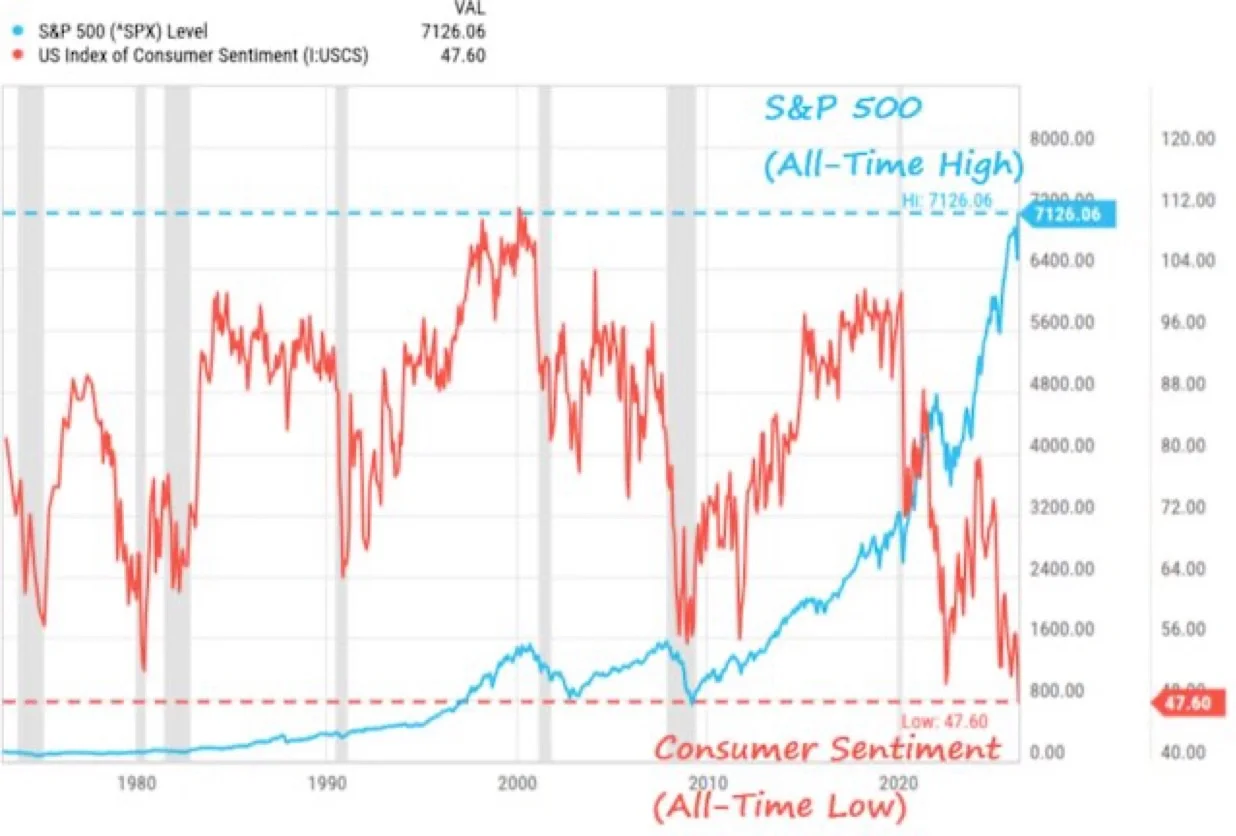
Markets Soar While Americans Feel Economic Despair
S&P 500: ALL-TIME HIGH Consumer Sentiment: ALL-TIME LOW Wall Street says the economy is booming, but is not for the average American.
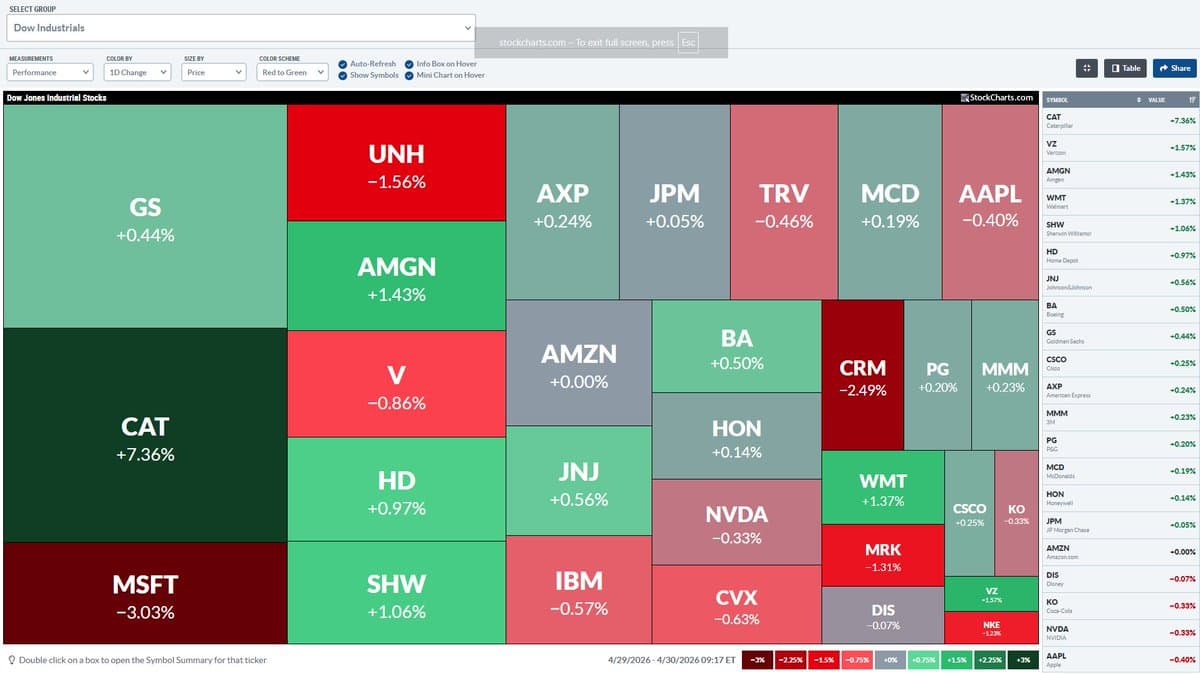
Caterpillar Boosts DJIA, Offsetting 90‑Point Drop
DJIA would be down 90pts if not for $CAT (adding 370pts to the average) https://t.co/enUdGgtidO
Limit Downside, Capture Upside with Options Before Earnings
📺 MARKET REACTION TO MEGA-CAP EARNINGS: TREND STILL INTACT 🔴 Get today's newsletter: https://t.co/Rqp84Wg39F The market has been in a constructive uptrend, with $SPY holding above the 8-day, which has been key support throughout the recent rally. Major overhangs are now behind us:...
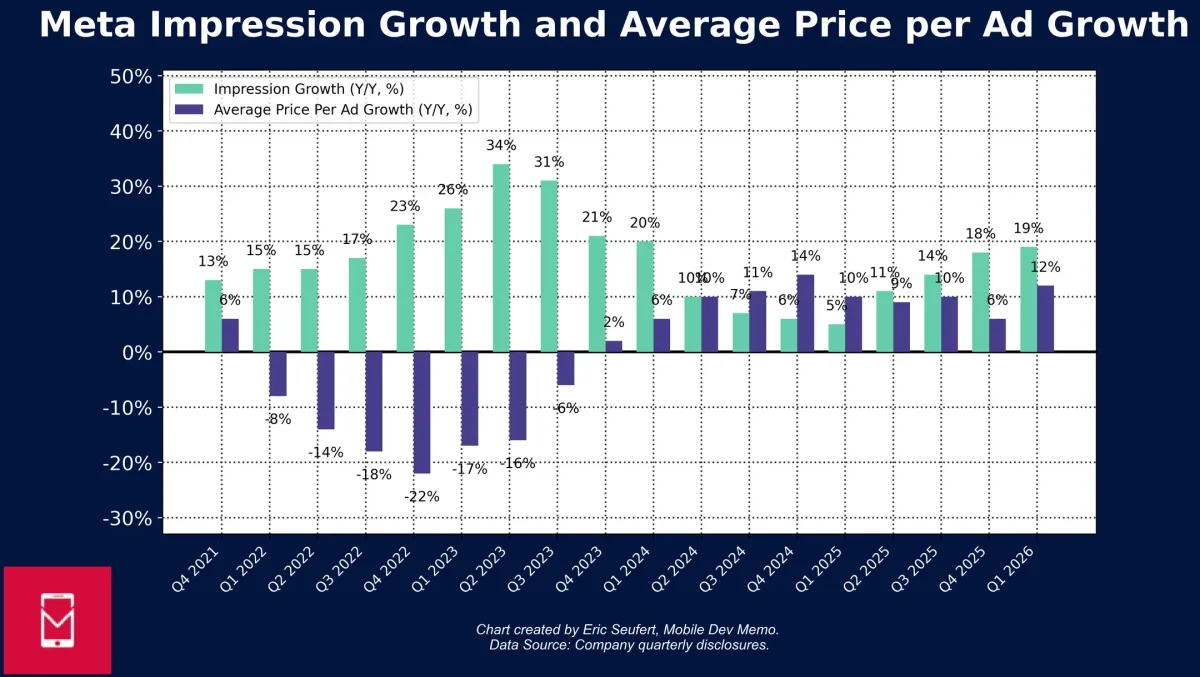
Meta Beats Estimates Yet Shares Slide 10% Pre‑Market
Despite beating consensus on Q1 revenue and Q2 guidance in its earnings release last night, Meta's stock is trading down nearly 10% pre-market this morning.
Tech Earnings Ahead as Gas Storage Drops
📊 Pre-Market Brief | Thu, Apr 30 ─────── 📅 MACRO DATA Natural Gas Storage: Est 83 | Prior 103 Core PCE Price Index m/m: Est 0.3 | Prior 0.4 ─────── 💰 MAG 7 EARNINGS MSFT Wednesday Est 4.07 GOOGL Wednesday Est 2.63 META Wednesday Est 6.67 AMZN Wednesday Est 1.89 AAPL...
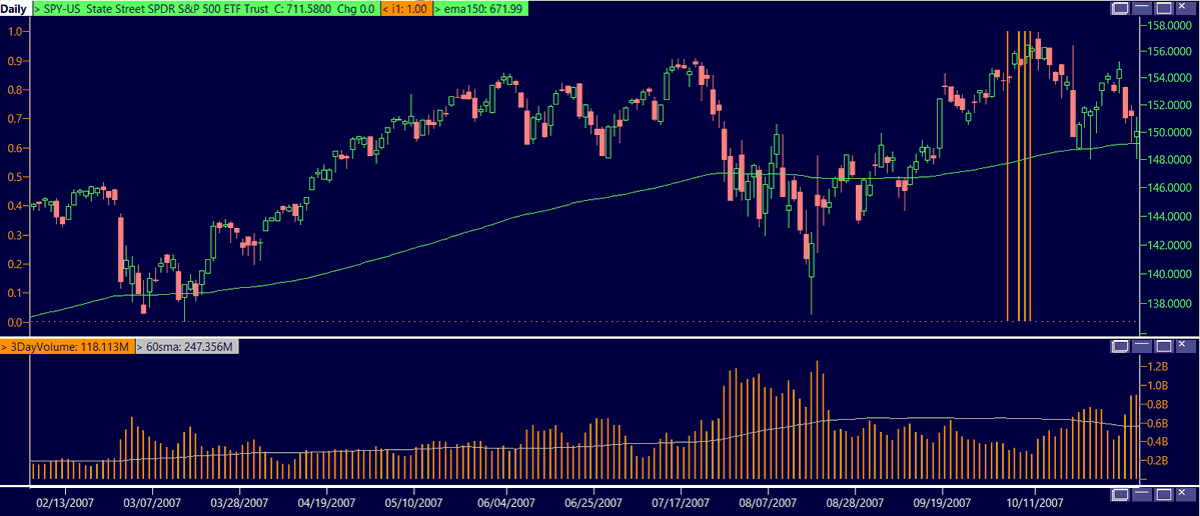
Low Volume at New Highs Mirrors 2007 Market Peak
@KeithMcCullough @SamofAmerica @RPKent @HedgeyeDJ Data suggest that volume alone is not a reliable indicator of a rally’s ability to sustain itself. That said, the last time we observed this degree of persistently low volume accompanying a new all-time high...

SPX Risk Range Signals Minimal Downside, New Highs Ahead
Post all the noise and "news" post market close, my $SPX Risk Range™ Signal yawned with only -1.2% on the downside and upside to new all-time highs
Earnings Roundup: META, MSFT, AMZN, GOOGL Mixed Results
Hey @grok Can you give a summary of the good, the bad, and the ugly for $META $MSFT $AMZN and $GOOGL earnings from yesterday?
AMD Surges as Big‑tech Earnings Tumble
Big Tech earnings just dropped today. Still a lot to read through. But one thing already looks clear: AMD is going so much higher.
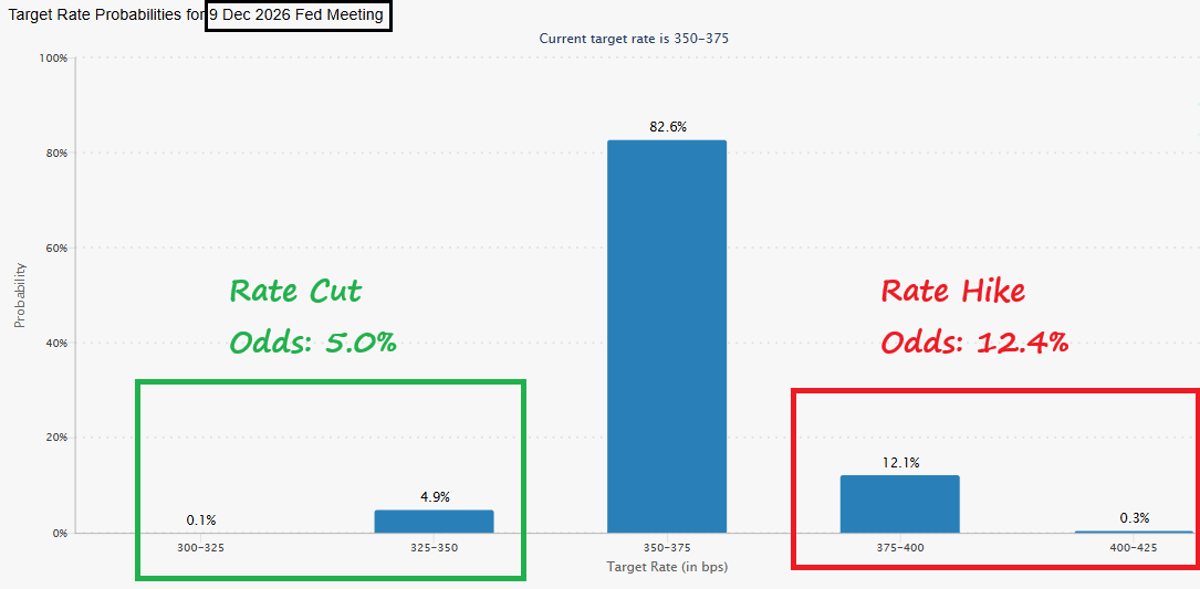
Bond Market Sees 12% Chance of Fed Hike, 5% Cut
The bond market is now pricing in a higher probability of a Fed RATE HIKE (12%) by the end of this year than a RATE CUT (5%). https://t.co/i77bnsp7MR
AI Rally Risks Flip to Sell‑off Amid Profit‑taking
McElligott agrees: “If profit-taking starts to hit into this increasingly fragile setup, with AI looking “too far, too fast” into high-bar earnings, a growing risk of “sell the news” flows, and bonds selling off on renewed inflation pressure, the current extremely...
Tomorrow's Post-FOMC Update and Big Tech Earnings Preview
Make sure you get tomorrow's post-FOMC update plus thoughts on $GOOGL $MSFT $AMZN $META etc earnings 📩 https://t.co/YtTTmqCyAJ

Flat Tape Masks Hidden Dispersion, Cautiously Bearish Outlook
Apr 29 close: the tape barely moved on the most loaded 24 hours of the quarter, and that is the tell. SPY pinned at $710 (-0.02%), Nasdaq +0.61%, Dow -0.56%, Russell -0.67%. The averages flatlining hid real dispersion underneath. Stance:...
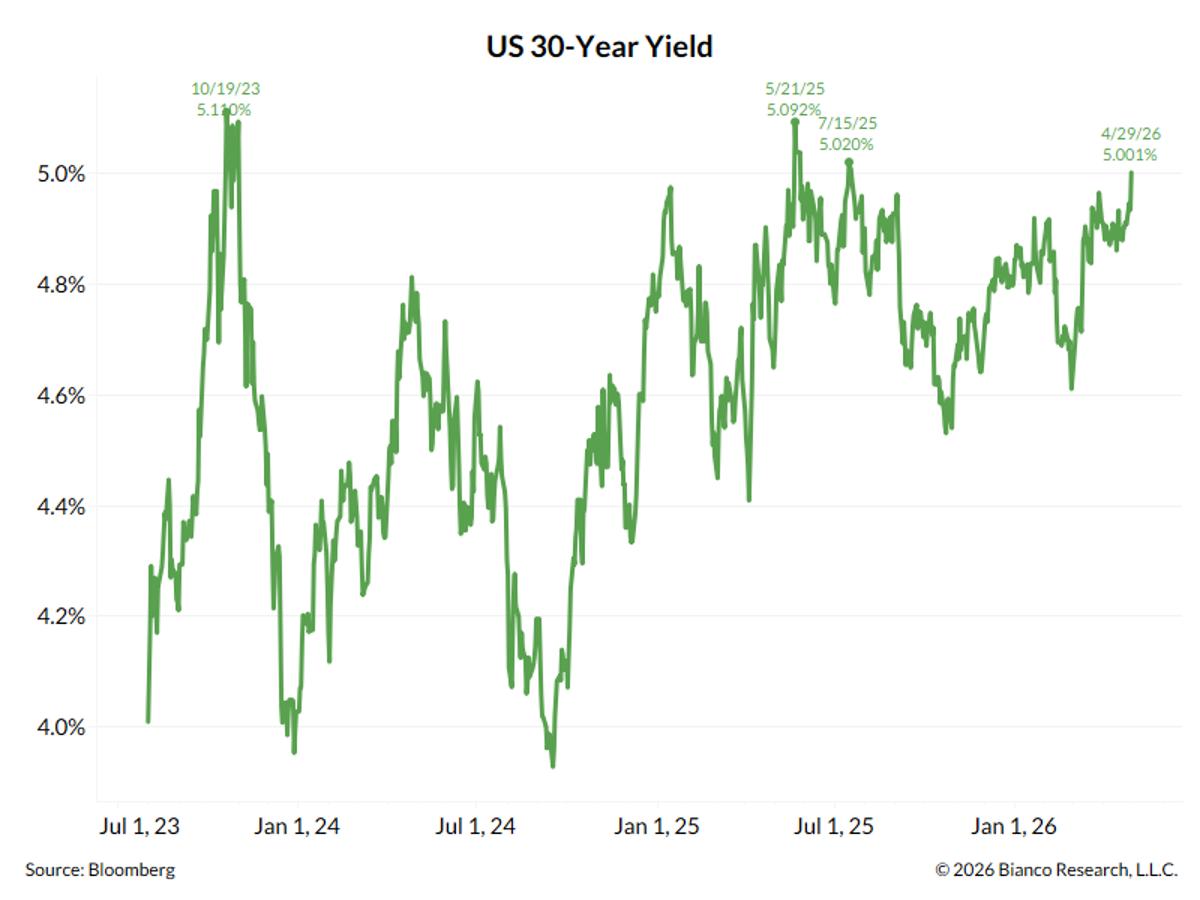
30‑Year Treasury Yield Reaches 5%, Near 18‑Year
*US 30-YEAR YIELD TOUCHES 5% FOR FIRST TIME SINCE JULY 2025 Now just 11 bps from a new 18-year high. https://t.co/Aow1azOUWb

Tech Beats Mask Macro Weakness, Markets Still Slide
Tech earnings beat… and stocks still dropped. $META $GOOG $AMZN That tells you everything. Oil at $108 Gas at highs since 2022 Fed divided like we haven’t seen since 1992 This isn’t a “buy the dip” market… it’s a read the macro market. https://t.co/cHKTtu3no5
Google Climbs While Amazon, Microsoft, Meta Slide
Big tech earnings stock moves so far : $GOOG +3.5% 🟢 $AMZN -1.0% 🔴 $MSFT -1.6% 🔴 $META -6.0% 🔴

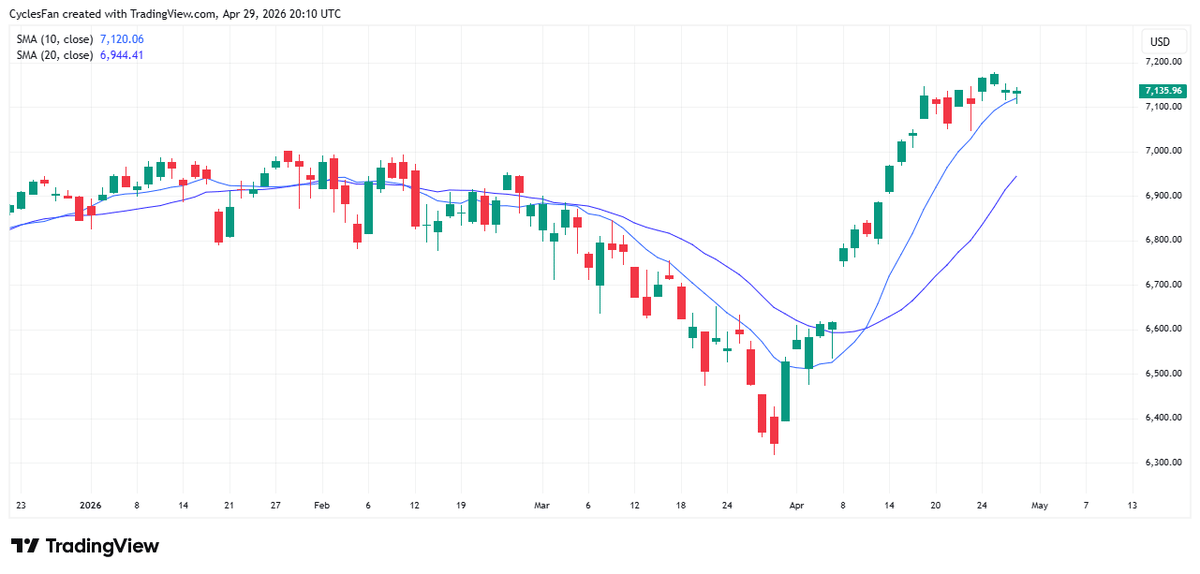
S&P 500 Stalls Near 7,180 Resistance, Sideways Trend
#SP500 doji Candle and Sideways. Resistance ATH 7178. Support 7000, 6740, 6500. RSI 65 not high. Top Bollinger Band 7196. Midpoint Line 7118. Bottom Band 7040.

Google Smashes Earnings, Shares Hit All‑Time High
$GOOG just released their latest quarters earnings: - Revenue of $109.9B (+21.8% Y/Y) beats by $2.87B. - Q1 GAAP EPS of $5.11 beats by $2.44. - 5% dividend increase Google is trading at all-time highs in after hours.
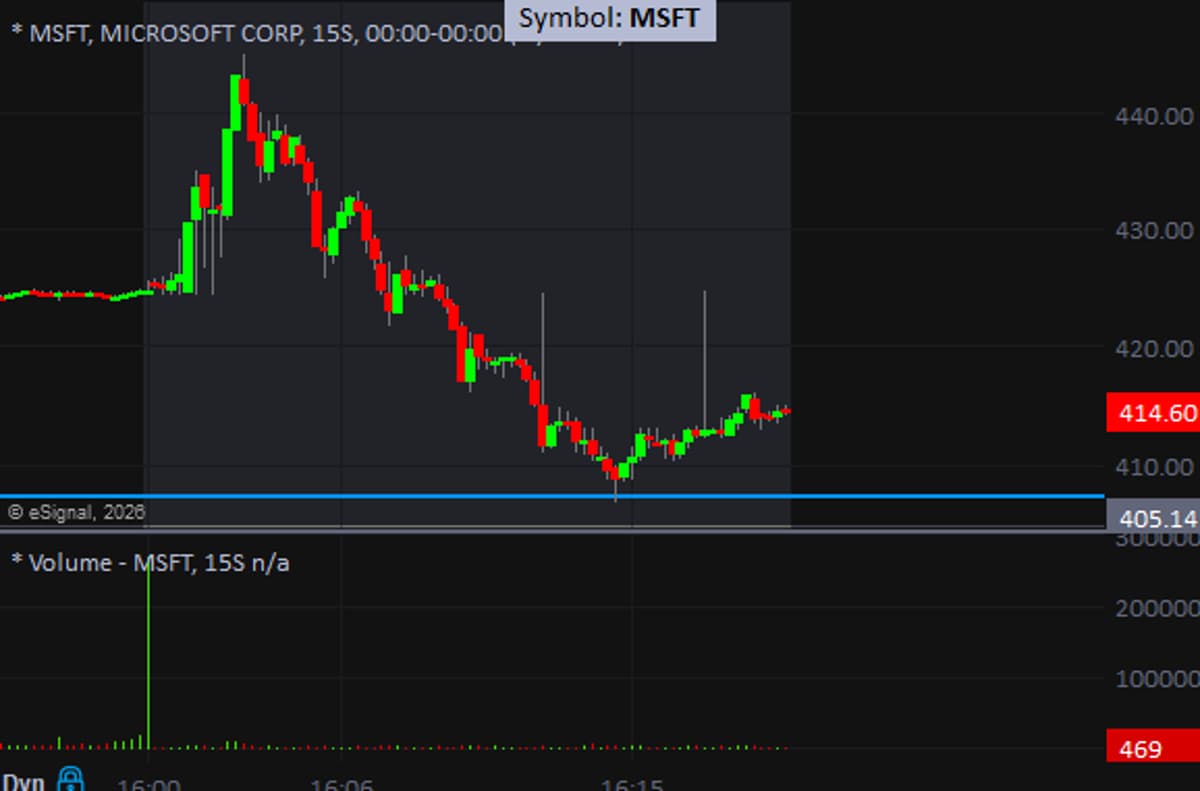
Microsoft Stock Bounces, Awaiting Volatile Earnings Call
407 low. back to 415. and we haven't even had the CC yet which tends to be nutty... $MSFT https://t.co/fubZuBHMV2
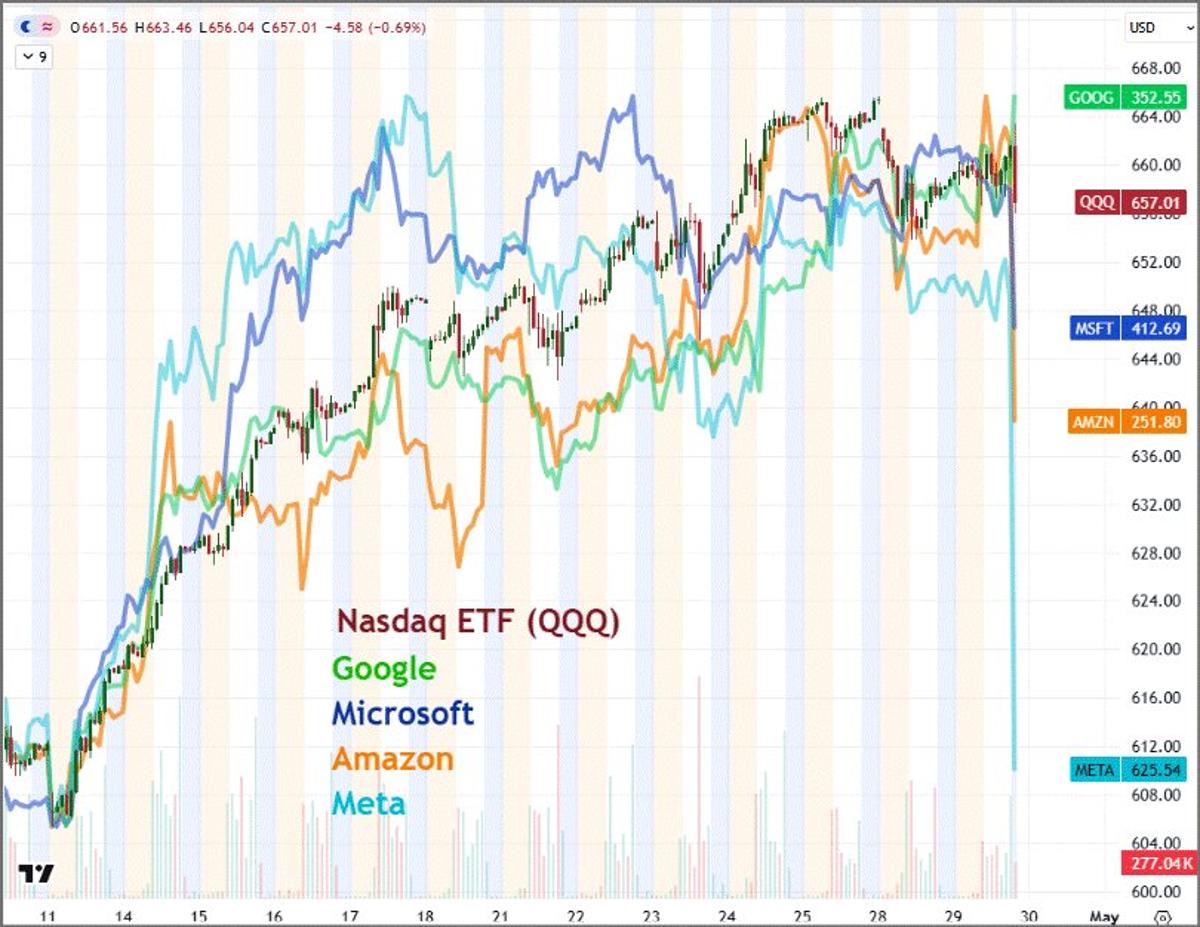
Tech Titans Drive QQQ’s Hourly Momentum
Here's the hourly chart (with afterhours) of the $QQQ along with Google, Microsoft, Amazon and Meta: https://t.co/f4NQoDqTRx
SPX Near 10‑Day MA; Below Could Trigger Pullback
$SPX hit the 10 day MA today and hasn't confirmed a short term top yet, but that's likely to change tomorrow after the mixed reaction to MAG 7 earnings. A close below the 10 DMA would lead to a pullback...

All Four Tech Giants Beat Earnings Expectations
I don’t give a darn what the stocks do immediately following but here is the heading $MSFT Beat $META Beat $AMZN Beat $GOOGL Beat Yep. All beats.
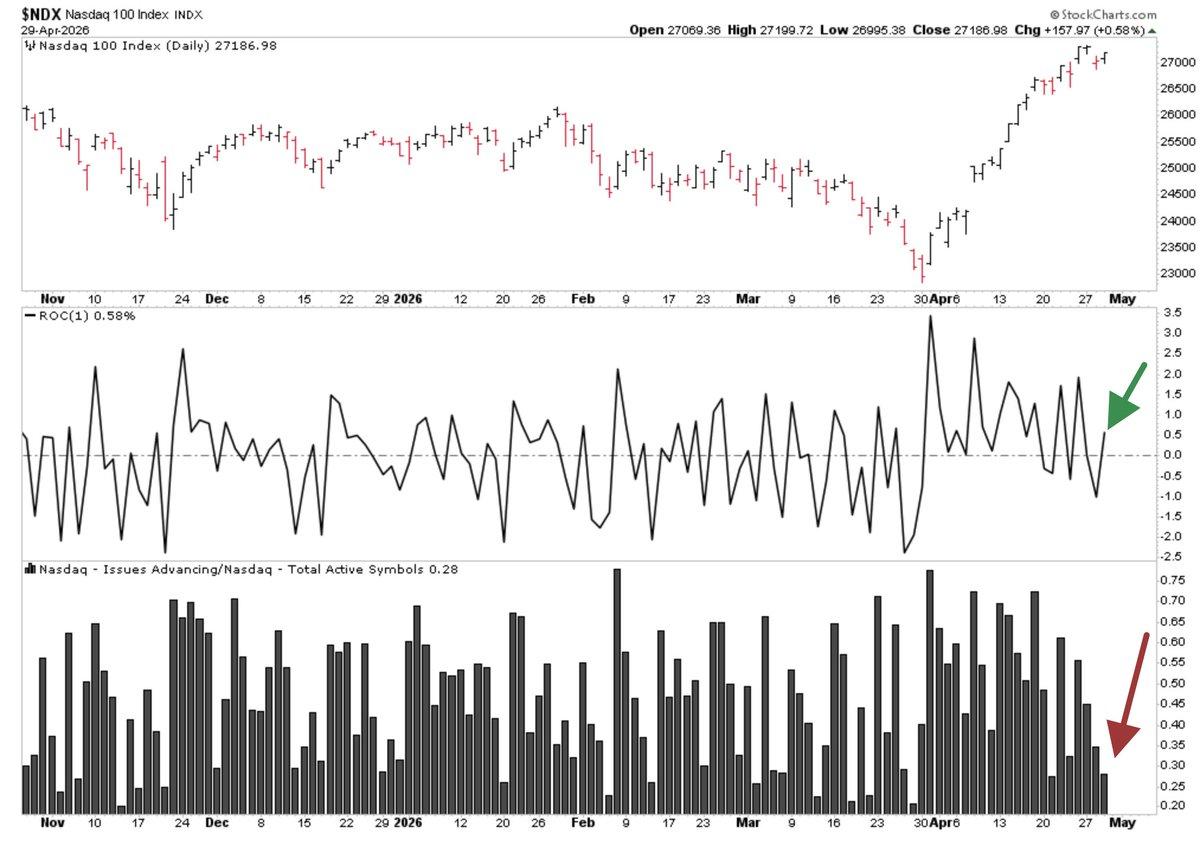
Nasdaq 100 Climbs as only 29% Stocks Rise—28‑year Rarity
The Nasdaq 100 $QQQ closed up more than 0.5%. Fewer than 29% of stocks on the Nasdaq advanced today. This has not happened in at least 28 years. https://t.co/L36DesYWH4
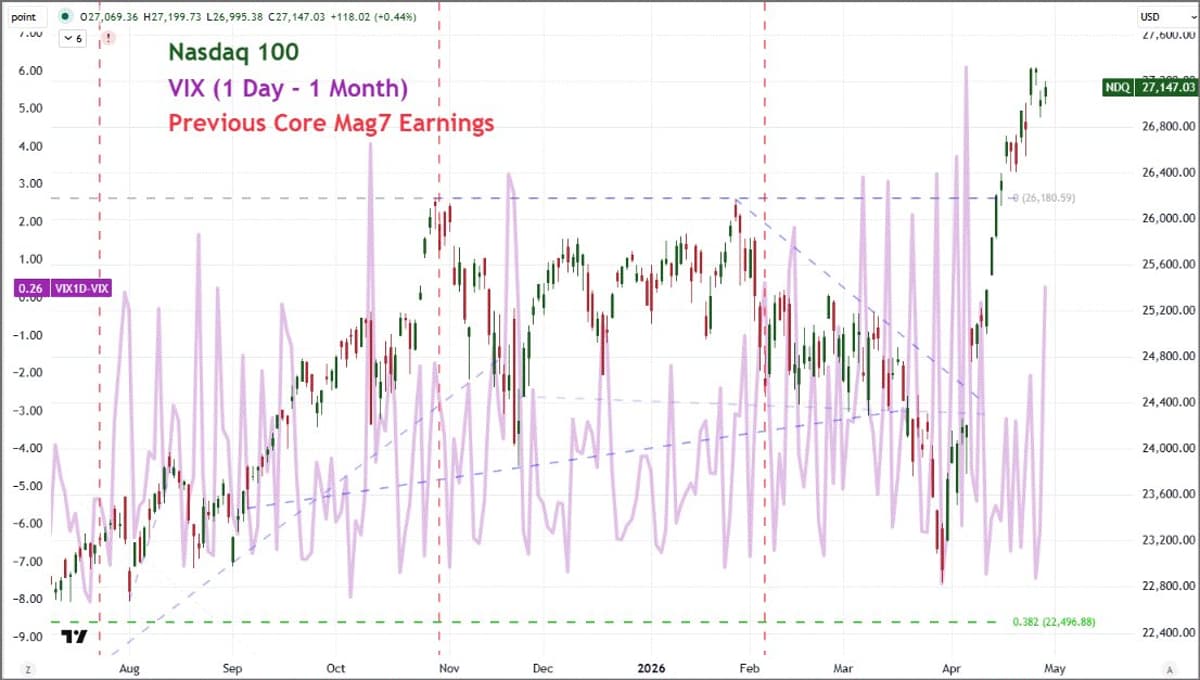
Nasdaq 100 VIX Differential Highlights Upcoming Mag7 Overlaps
Here's the Nasdaq 100 with the VIX 1-day to 1-month differential and the previous core Mag7 release dates (GOOG, AMZN, MSFT, META overlaps) https://t.co/wNheUeMpHj
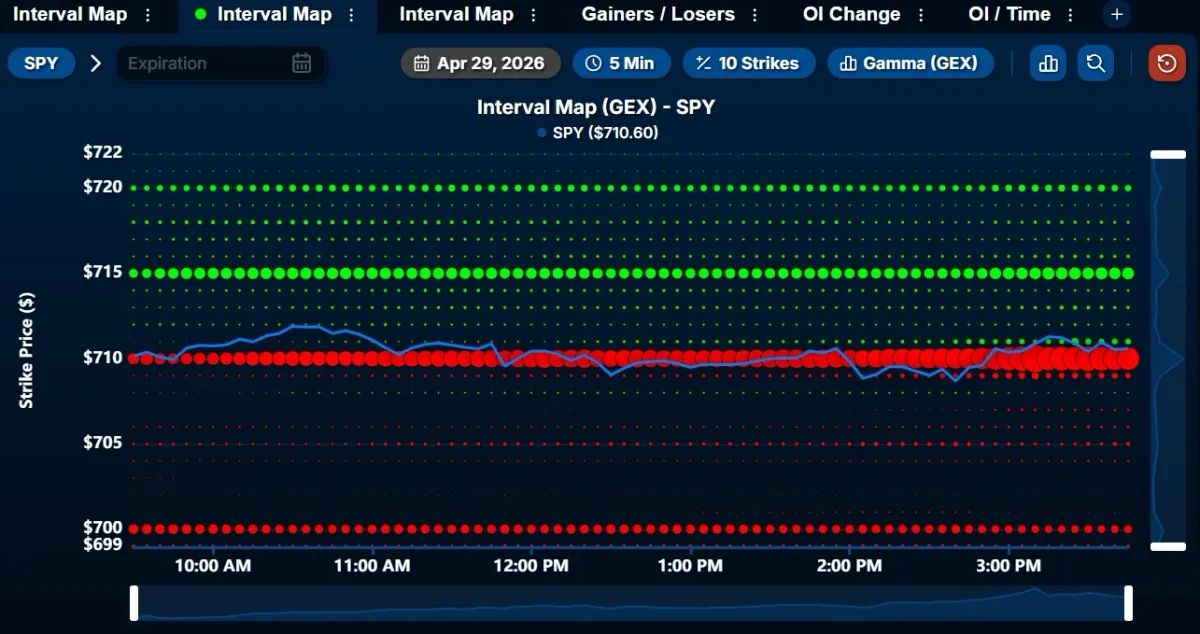
SPY's $710 MVC Draws Magnetic Gamma Pull
$SPY spent practically the whole day at $710, which we identified this morning as the MVC. These elevated gamma levels can act like magnets.