Intel Beats Forecast, Shares Jump 24% on Revival
MyPOV: @Intel crushes Wall Street’s expectations, and its stock surges 24% as revival gains pace https://t.co/1oGxH9TZ6w @SiliconANGLE @Mike_Wheatley “Intel is moving in the right direction, and a key objective going forward will be to secure design wins with...” - @holgermu @constellationr
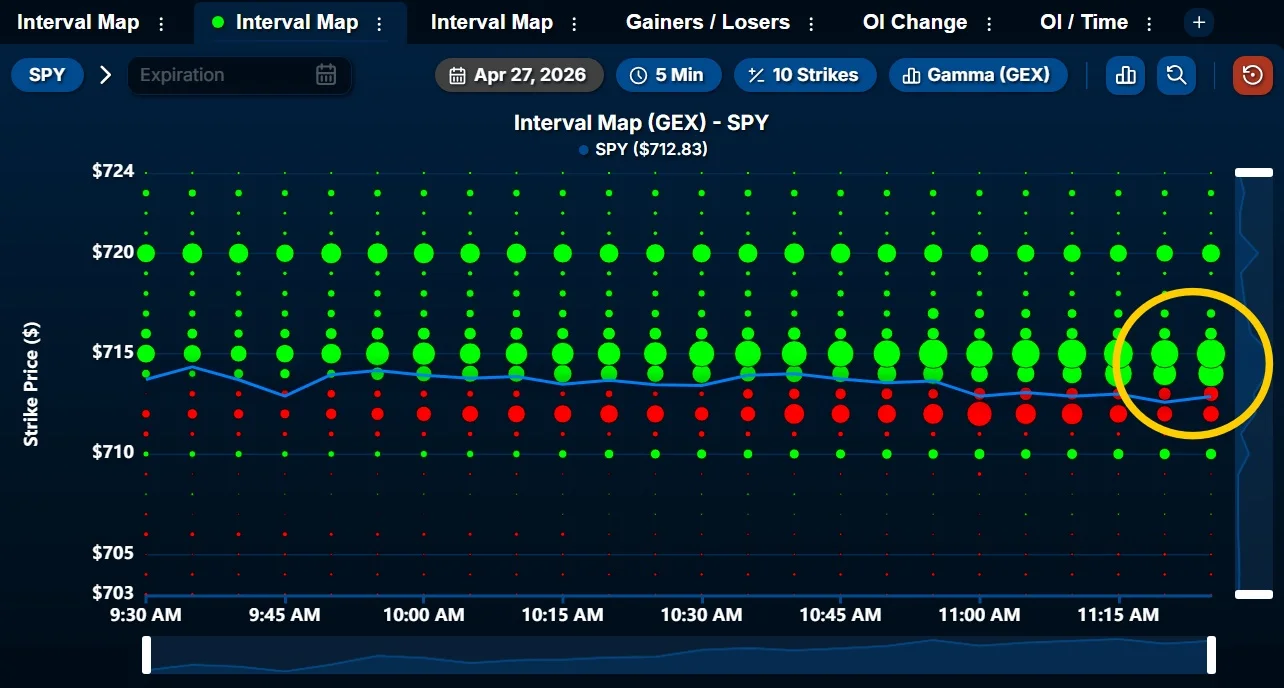
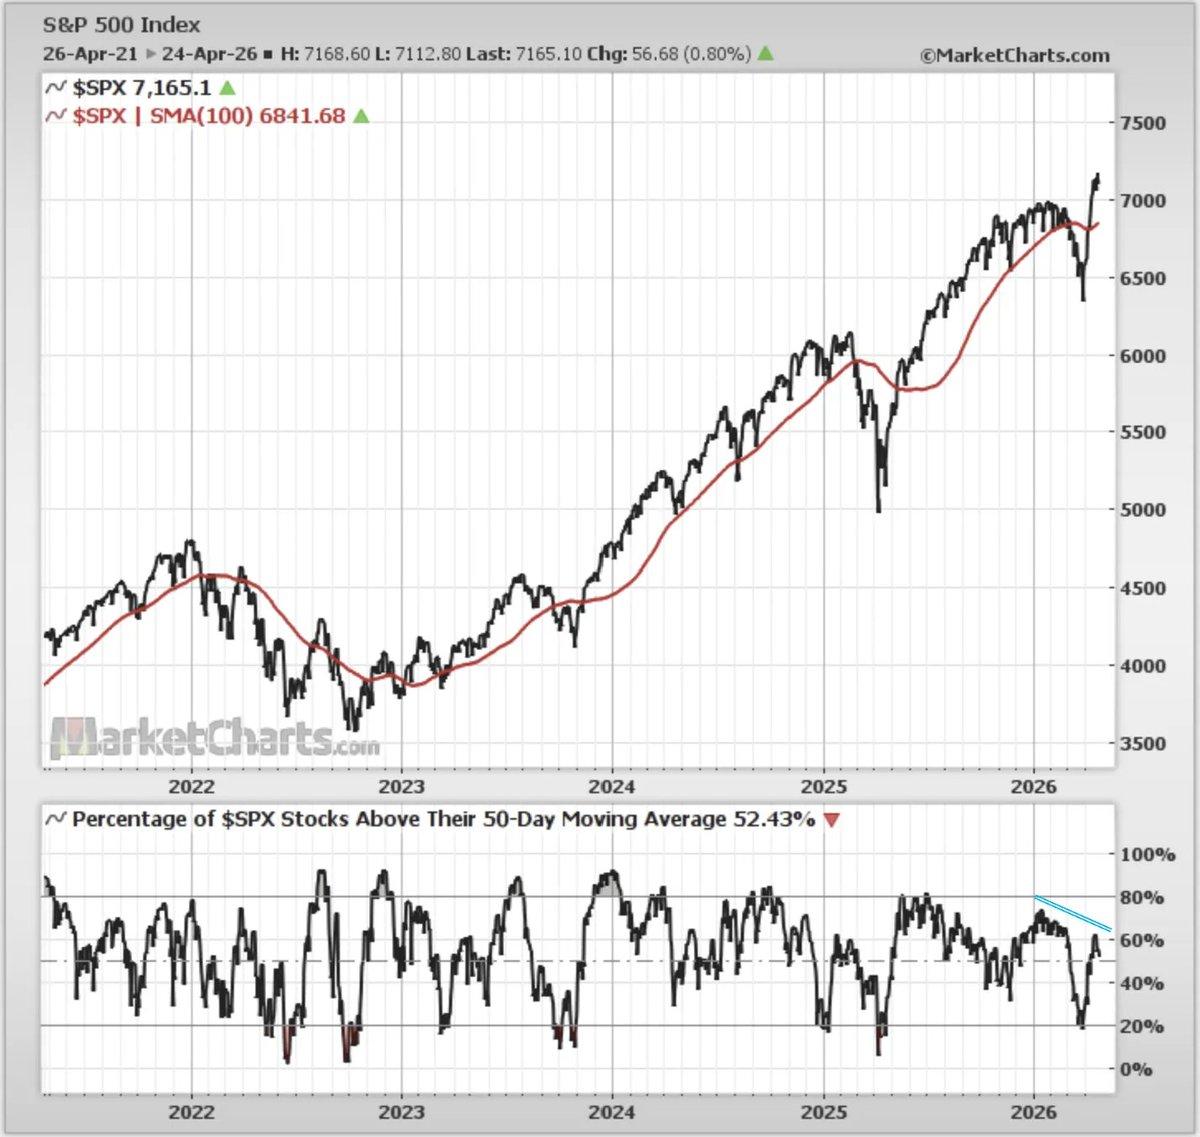
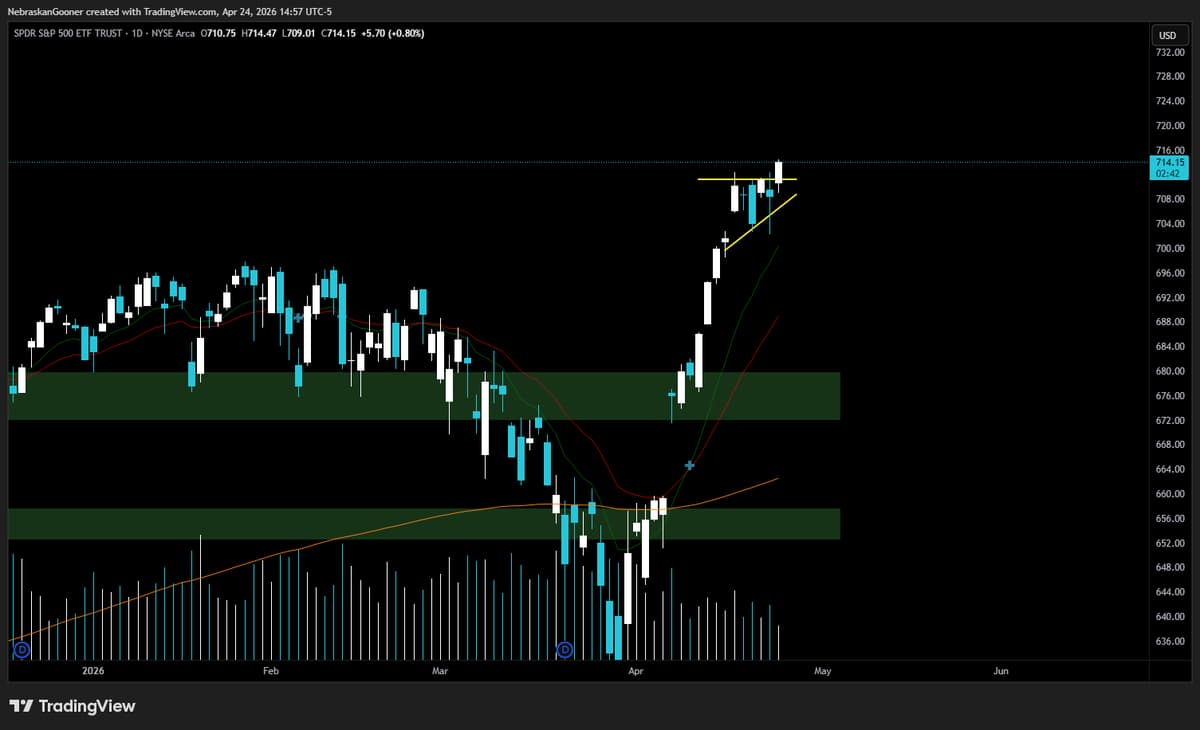
SPY Targets Bounce at $714‑$715, Below $712 Invalidates
At the bottom of the range again on $SPY. $714 is now the MVC, positive exposure at $714-$715 has only increased since the open. Another opportunity for a bounce to $714 here, invalidated under $712.
AI-Fueled Chip Rally Lifts SOX 47% in Weeks
For stocks, the exuberance of semiconductors in the AI boom crowds out everything else. The SOX is up 47% in 18 days (though the streak looks in jeopardy today...) https://t.co/xsxTX9n6G0
SOX Index Stays Bullish All April, No Red Close
FYI, the $SOX index hasn’t closed a single day in April in the red. (Currently down more than -1% on the day).
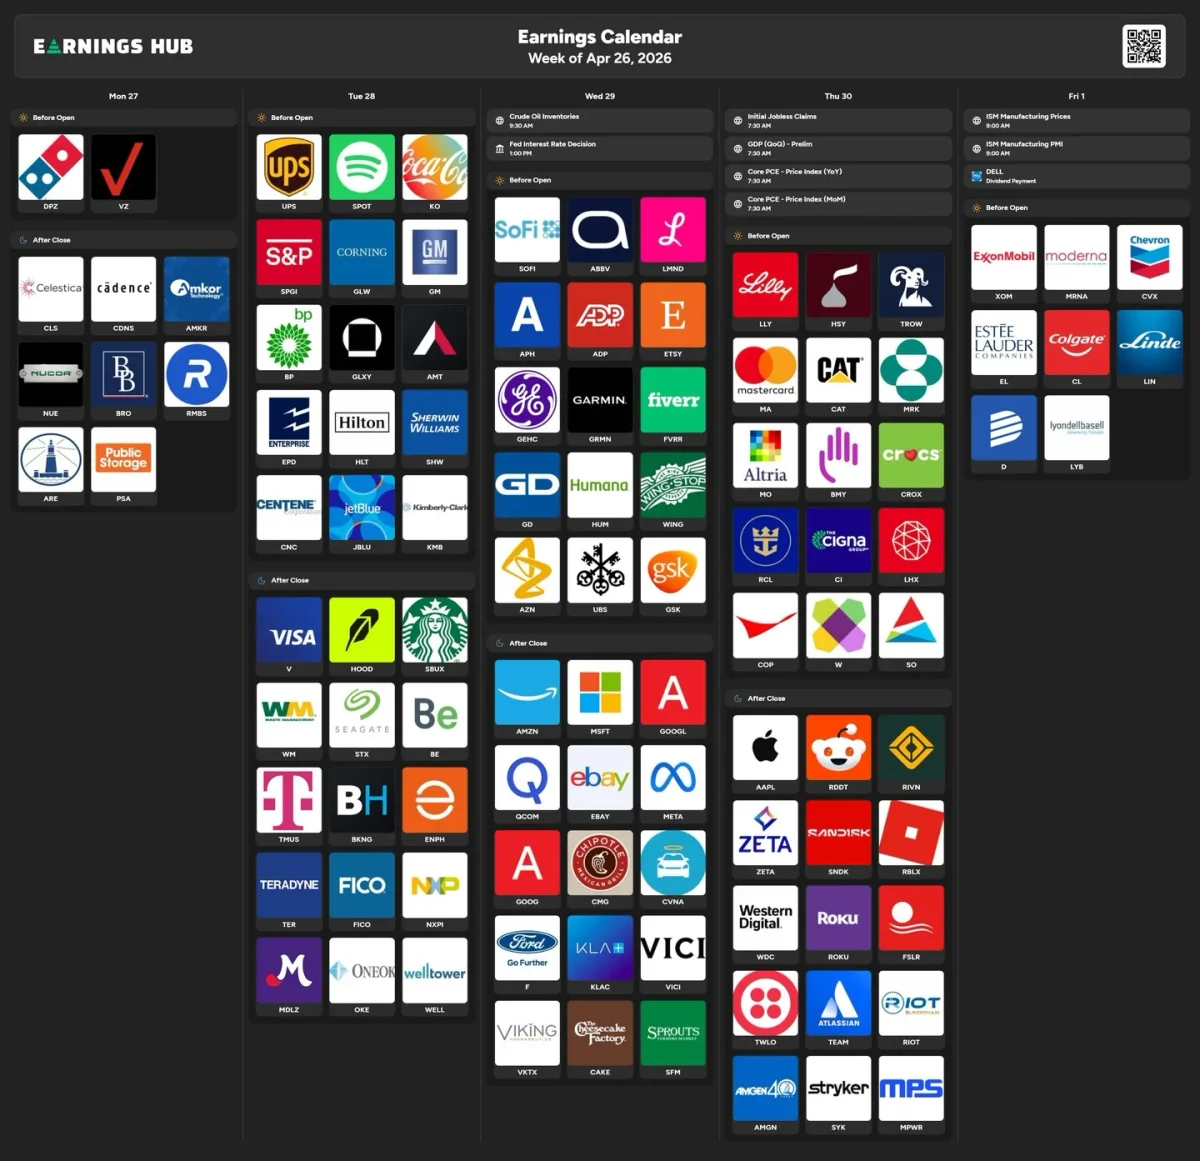
Thursday's Top Index Movers: LLY, MA, CAT; Friday Energy Shift
Here’s who reports this week. $LLY $MA $CAT on Thursday carry the most index impact. $XOM $CVX on Friday for energy rotation.
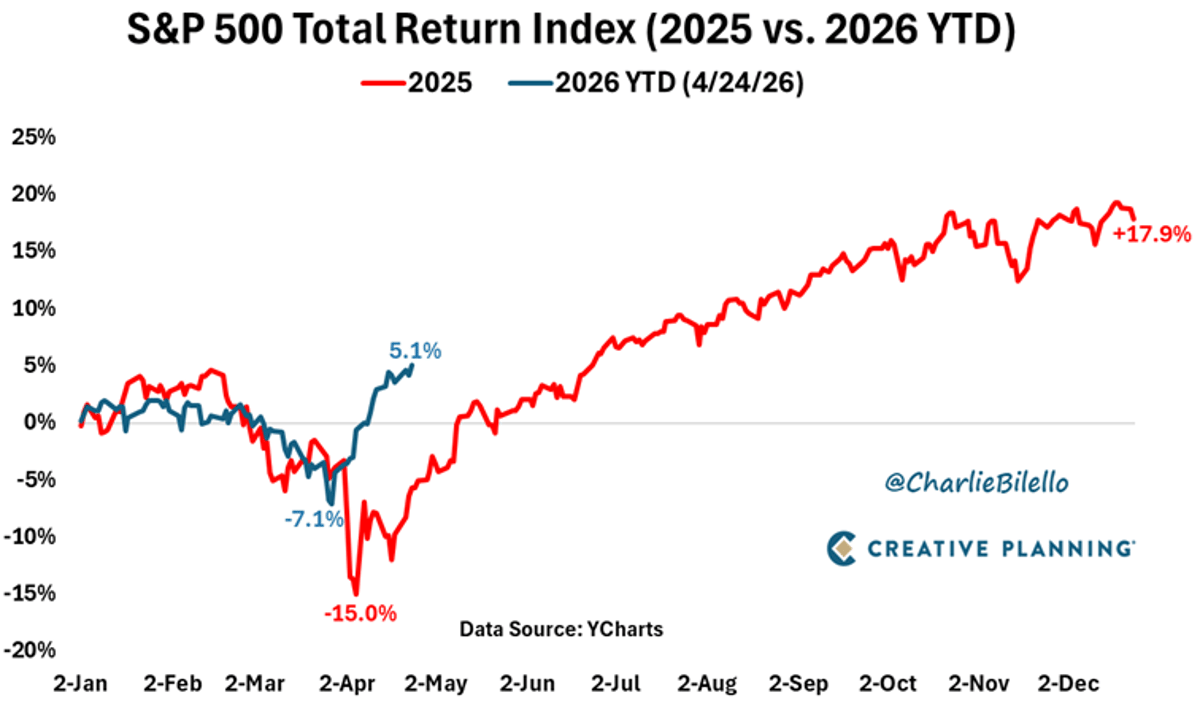
Traders Shrug Rhetoric, Buy Dips, Push SPX to New Highs
2026 is following the same playbook as 2025. Only difference is traders have become much more immune to extreme rhetoric and have been more confident in buying the dip, sending the stock market quickly back to new all-time highs. $SPX Video:...
All Signals Turn Risk-On, Rally Likely Ahead
All four signals just flipped Risk-On. Utilities lagging. Lumber outpacing gold. S&P 500 nearly 7% above its 200-day. The last time the model was this aggressive, the rally extended. Are you positioned for it? https://t.co/AUo8JQGNdw
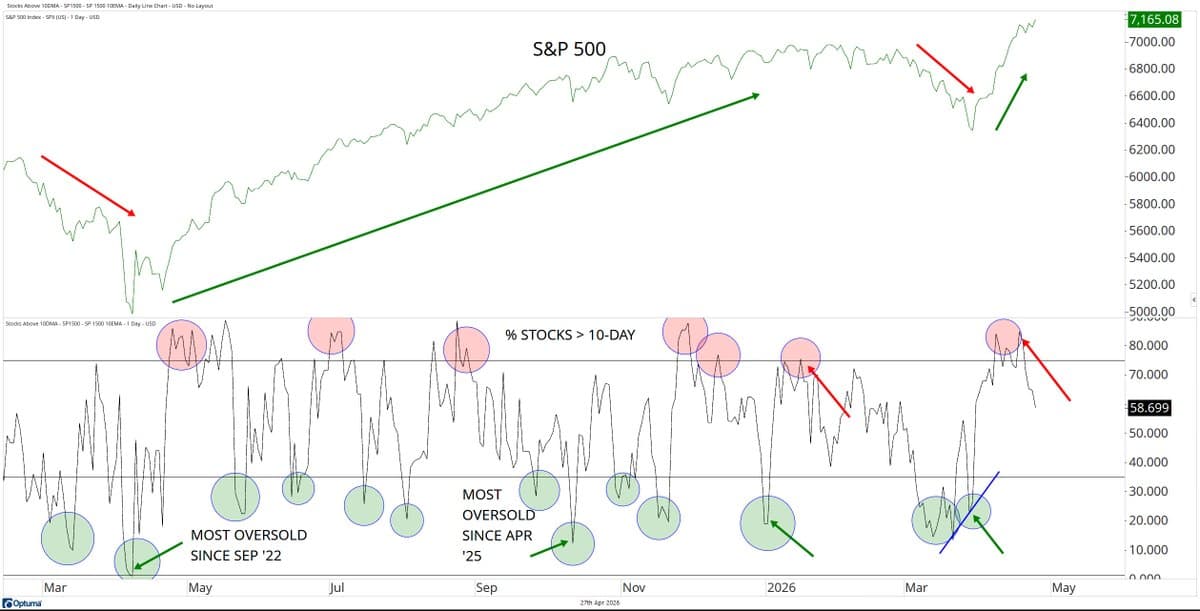
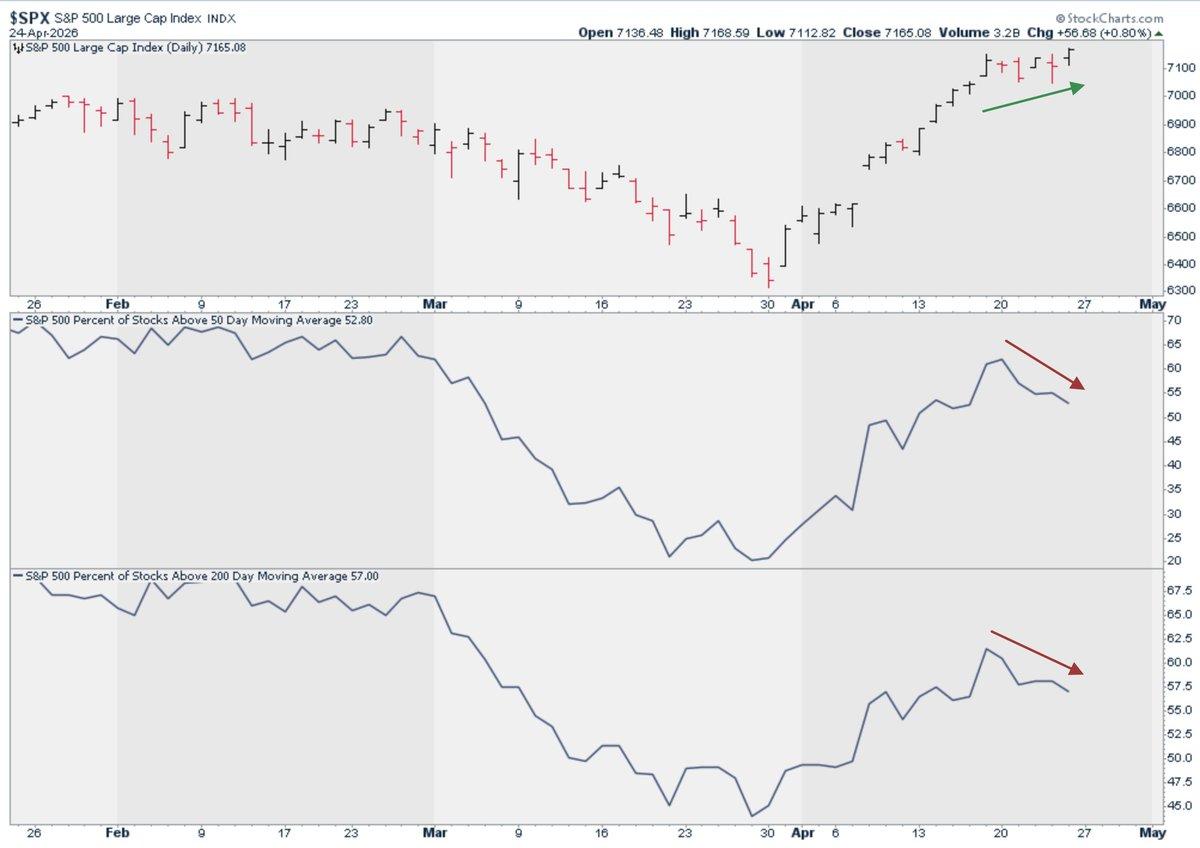
S&P 1500 Overbought: Majority Above 10‑Day EMA
although the market hasn't come in, we're working off the overbought condition, here with the % stocks in the S&P 1500 > 10-day EMA... #marketbreadth $SPX https://t.co/R2JvU6u1Fp
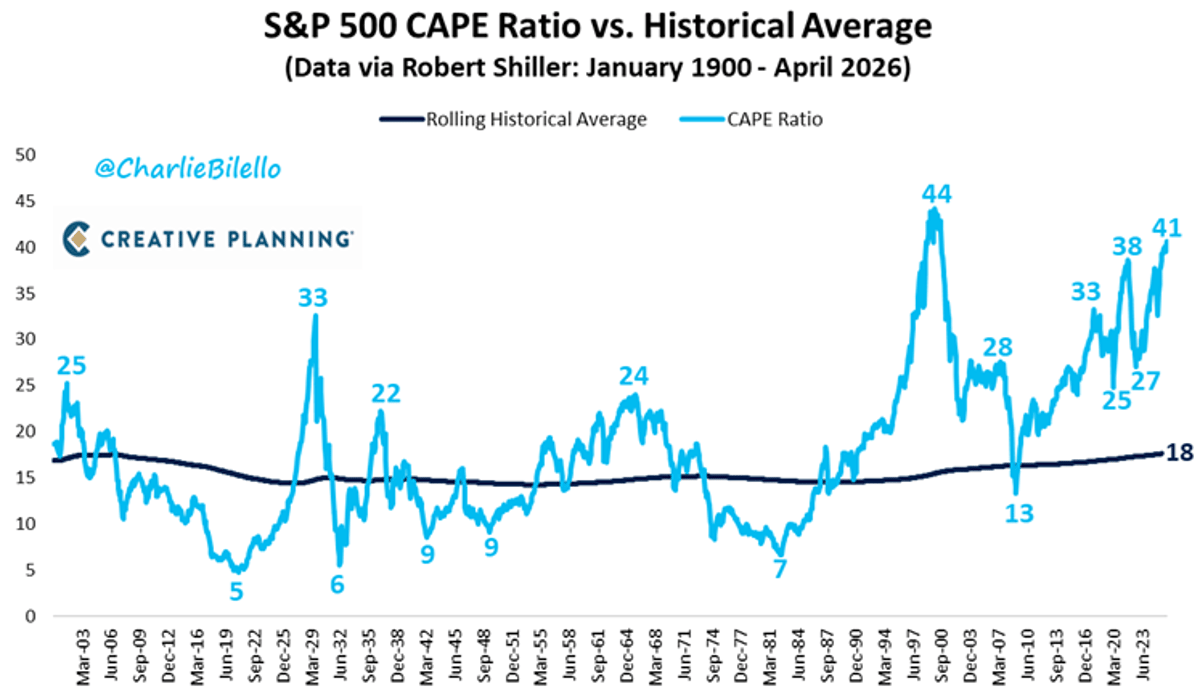
S&P 500 CAPE Hits 41, Highest Since 2000
The S&P 500's CAPE Ratio has moved up to 41, its highest level since 2000 and now above 99% of historical valuations. $SPX Video: https://t.co/8sftndQio4
Equal‑weight S&P Stalls as Cap‑weight Hits Fresh High
As stock indices rise, fewer stocks are going along. This is why the S&P 500 equal-weight index $RSP hasn't made a new high for 40 days, while the cap-weight version $SPY just did. In 70 years, this is only the 3rd time...
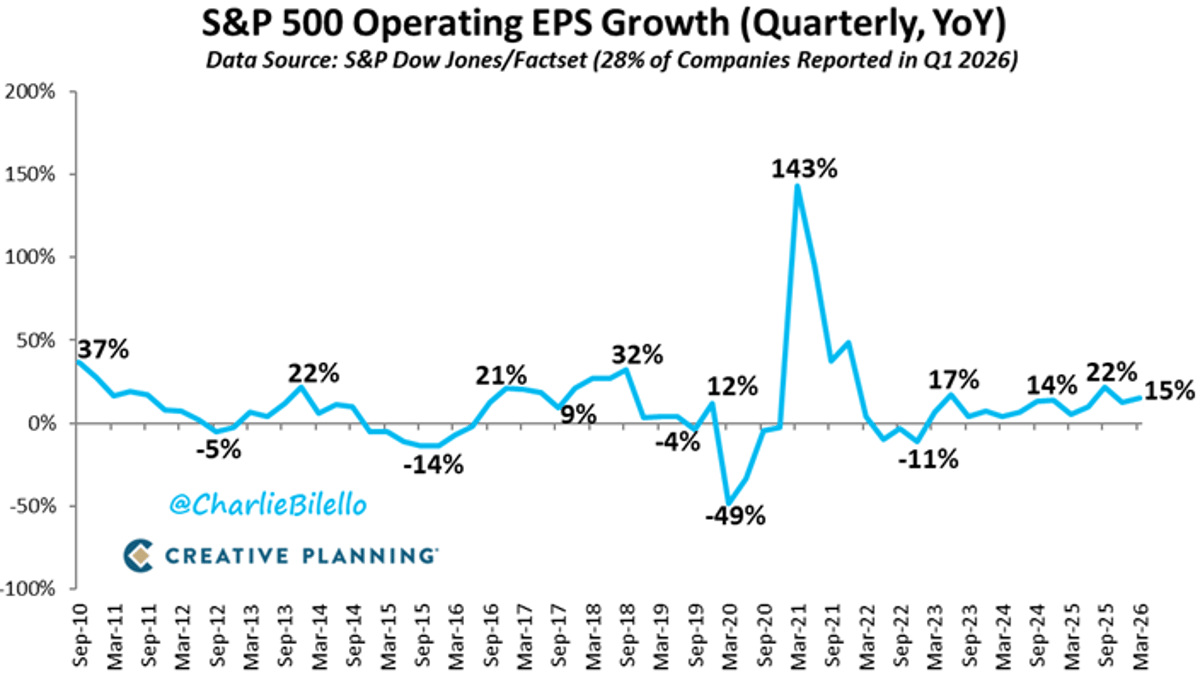
S&P 500 Posts 15% YoY Earnings Rise, 13th Straight Quarter
With 28% of companies reported, S&P 500 1st quarter earnings are up 15% over the prior year, the 13th consecutive quarter of positive YoY growth. $SPX Video: https://t.co/FSc0CyC2dz
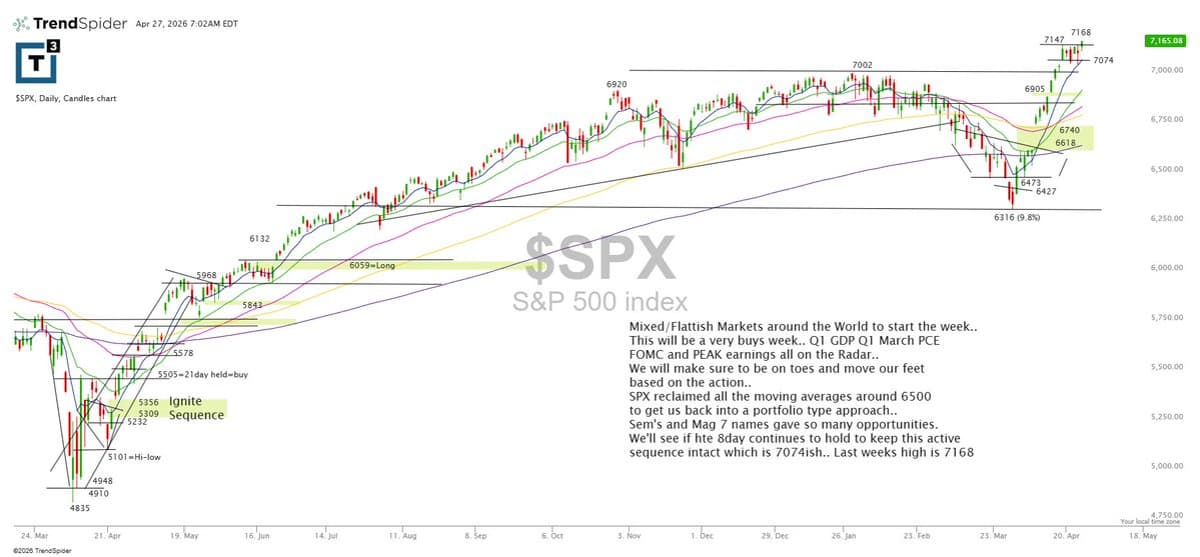
S&P 500 Reclaims 6500, Eyes 7074 Hold
$SPX reclaimed the moving averages around 6500, getting us back into more of a portfolio-type approach, and semis/Mag 7 have been full of opportunity. Now we’ll see if the 8-day holds (7074ish) to keep the active sequence intact, with last...

Domino's Misses Comps, Shares Slide 5%
Domino’s US comps 0.9%. International down 0.4%. Both lower than expected. Revenue up 3.5% EPS -4.6%. Shares down 5% premarket. $DPZ
AI Magnificent Seven Propel S&P; without Them Market Falls
“Exclude the AI version of the Magnificent Seven stocks—Broadcom alongside Alphabet, Amazon, Apple, Meta, Microsoft and Nvidia—and the market value of the S&P is actually down. Put another way, these seven are lifting the entire market.” WSJ https://t.co/Cdztzsv5jH
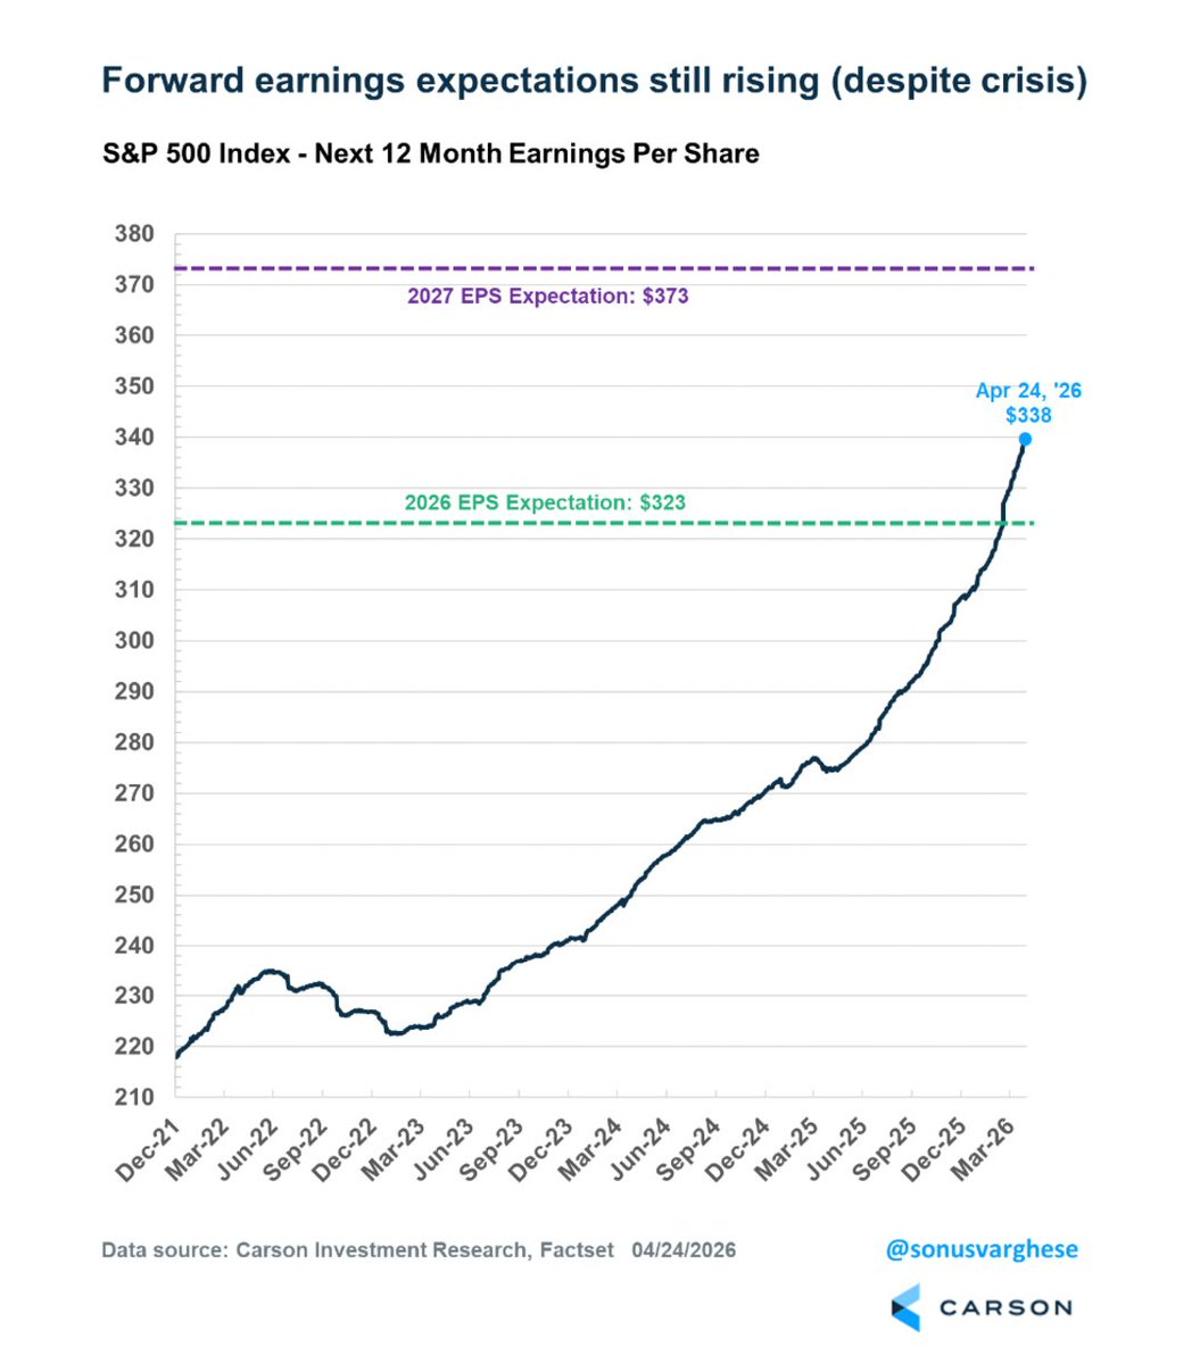
S&P Earnings Surge, Margins Hit Record, Stocks Cheaper
12-month S&P 500 earnings estimates are up an incredible 10% YTD, with 6.5% coming since the war started. Also, profit margins hit a new high of 15.2%. Lastly, stocks are up more than 5% YTD (total return), but they are...
Fed Pivot Sparks S&P Rally; Staying Long
Fed pivot is real. The S&P 500 rally has legs, and I’m not sitting it out. Chasing this move feels risky, but missing it feels riskier. Staying long. SPX
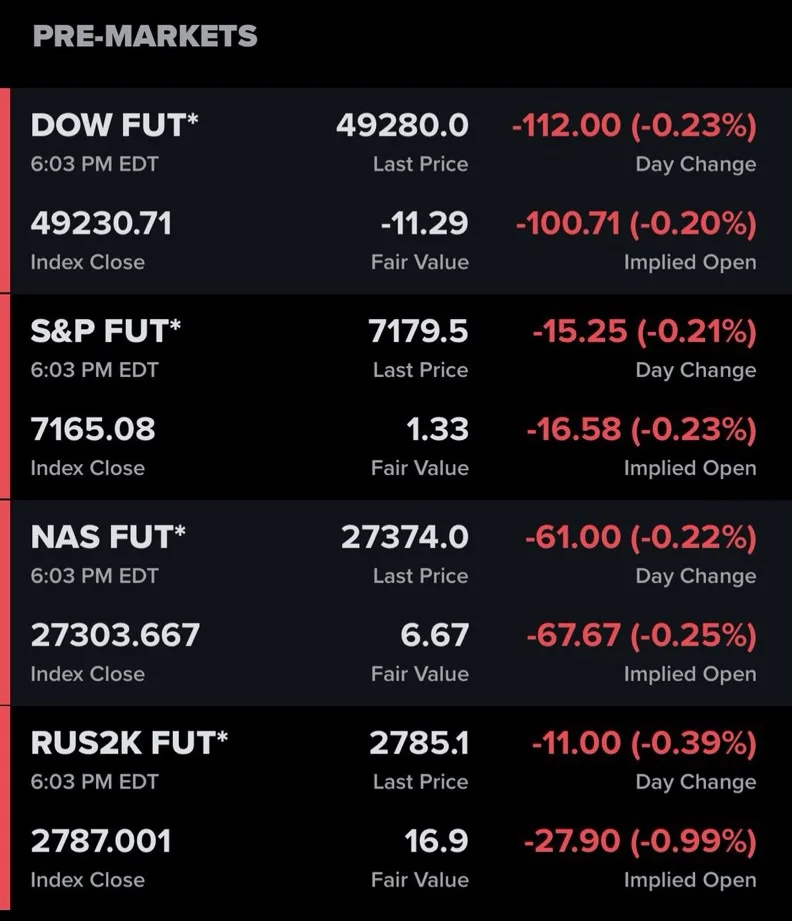
Stock Futures Return, Signaling Market Reopening Soon
Stock futures are back … we’re getting closer to the market being open again 🔴🔴🔴🔴
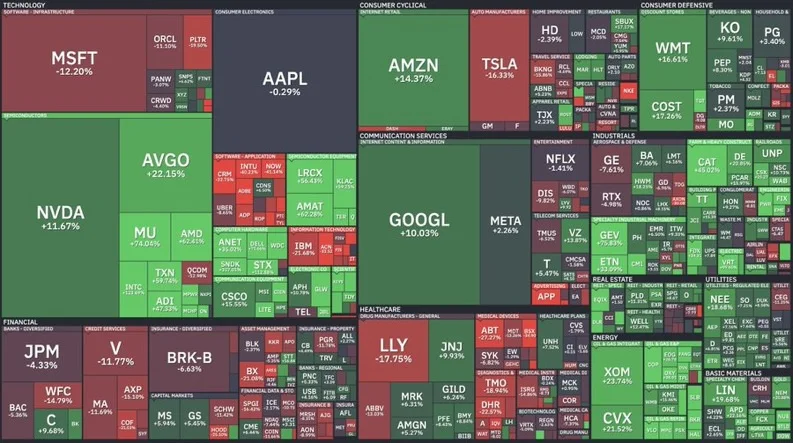
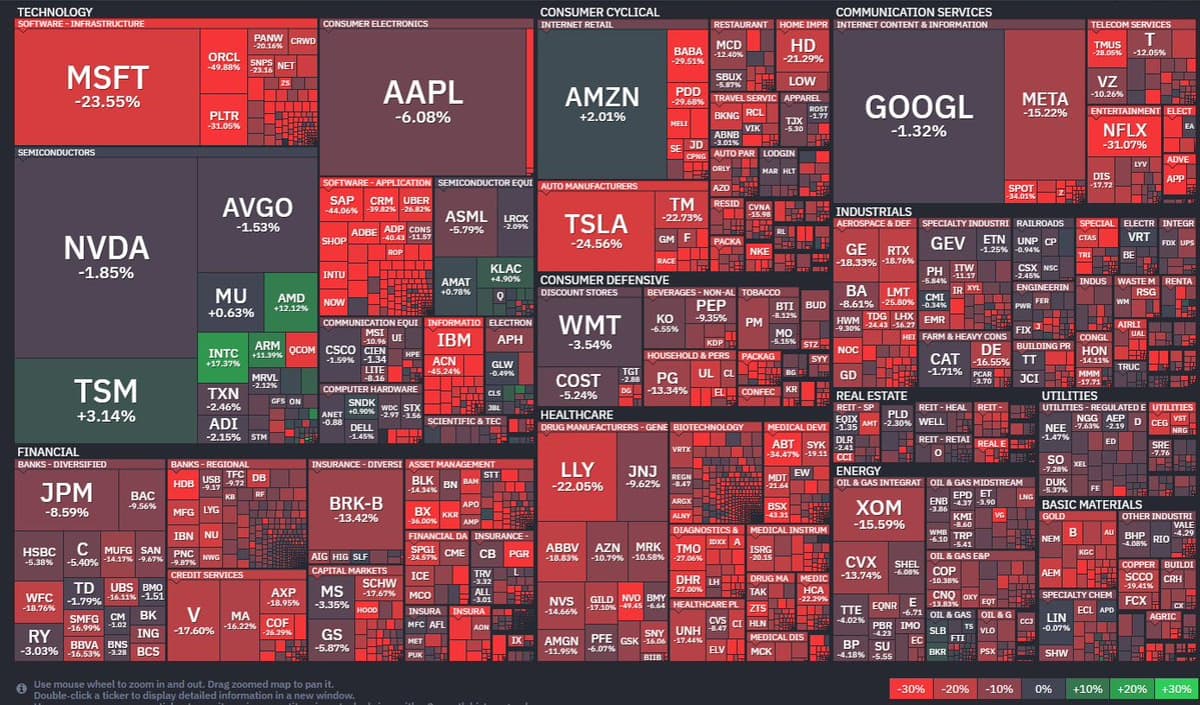
All S&P 500 Stocks Show Mixed 2026 Performance
This is how every stock in the S&P 500 has performed so far in 2026
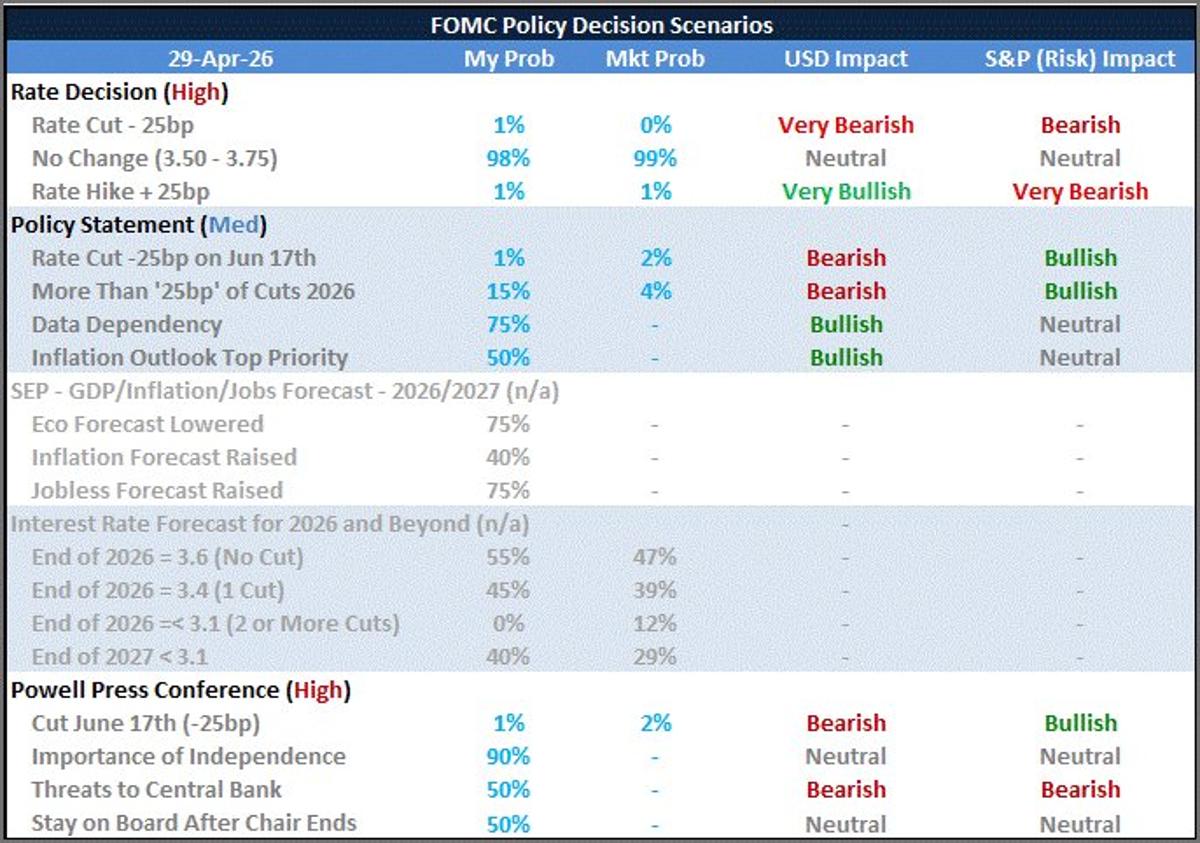
Nasdaq Hits Record Amid Geopolitical Tension and Earnings Outlook
My article for the week ahead (and my FOMC scenario table): Nasdaq at Record, US-Iran Unresolved, FOMC and Mag 7 Earnings On Tap https://t.co/XDQ8tBTF50 https://t.co/FrsmP5gFBA

S&P Rally Fragile, Driven by Soft‑landing Narrative
Chasing the S&P 500 rally? 📈 Michael J. Kramer says it’s a fragile, momentum-driven move based on a “soft landing” narrative. Valuations are high, and leadership is narrow. 🚨 Be careful out there. Markets

Nasdaq Hits New ATH, Overbought Yet Still Rising
#Nasdaq Comp New ATH 24854. Support 24199, 23000, 22501. RSI 70 Overbought but can go higher. Small Up Candle on Weekly. Top Bollinger Band 25140. Midpoint Line 24200. Bottom Band 23260.
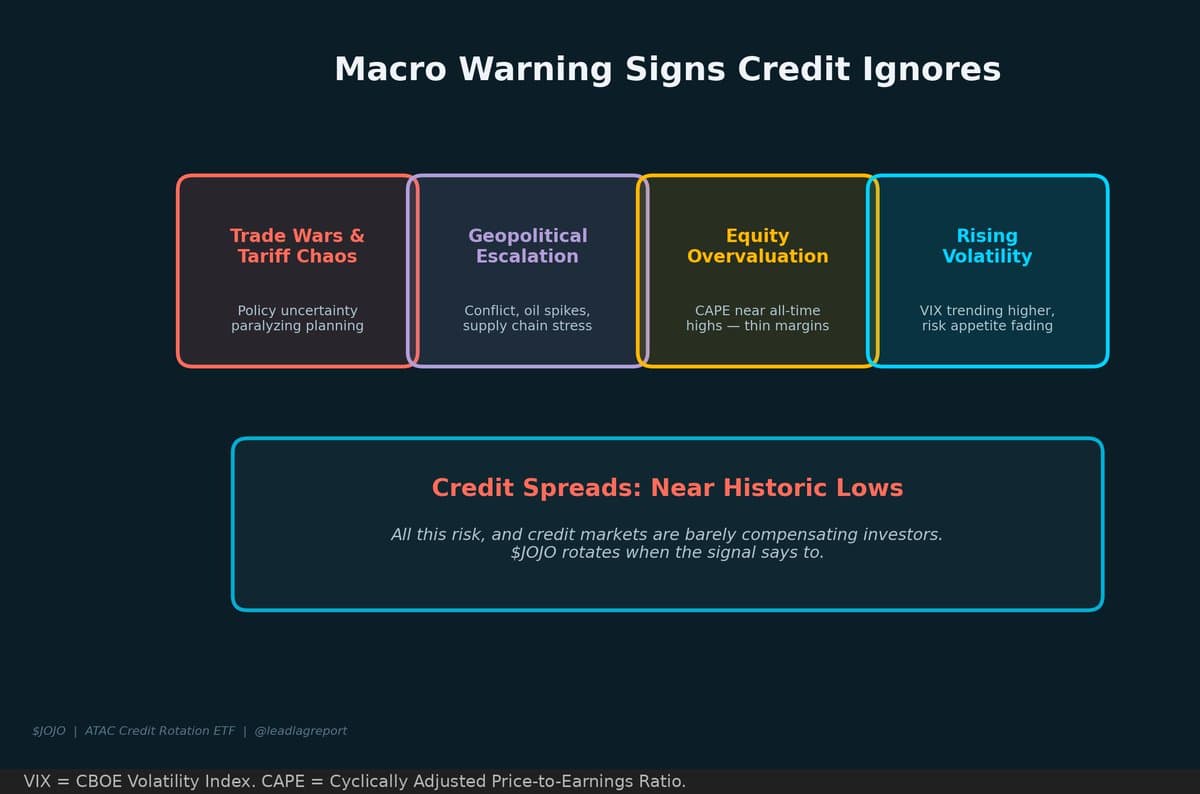
Credit Spreads Stay Tight Amid Rising Market Turbulence
Every major macro indicator flashes caution. Volatility rising. Equities under pressure. Geopolitical risk elevated. Yet credit spreads are asleep. $JOJO doesn't sleep. https://t.co/K90mNCoPv5
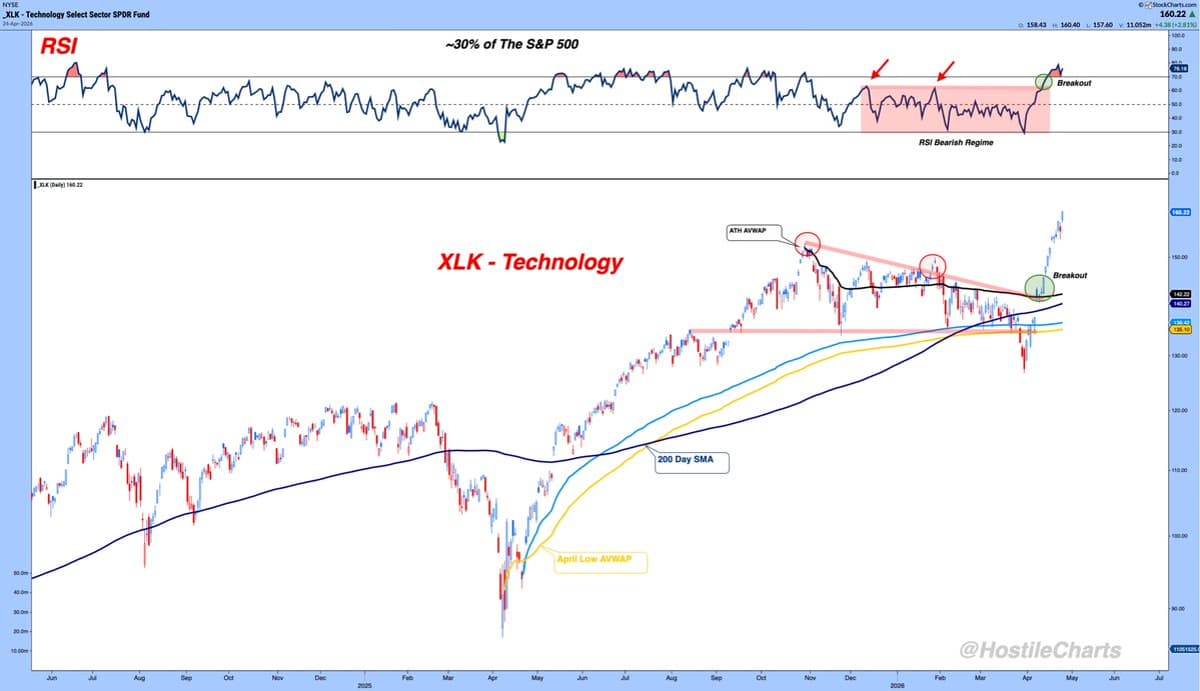
XLK Dominates While XLE and XLP Lead
$XLK - What A Monster..... Masked the fact that the other two leading sectors this week were $XLE and $XLP https://t.co/niSKEGw6eD
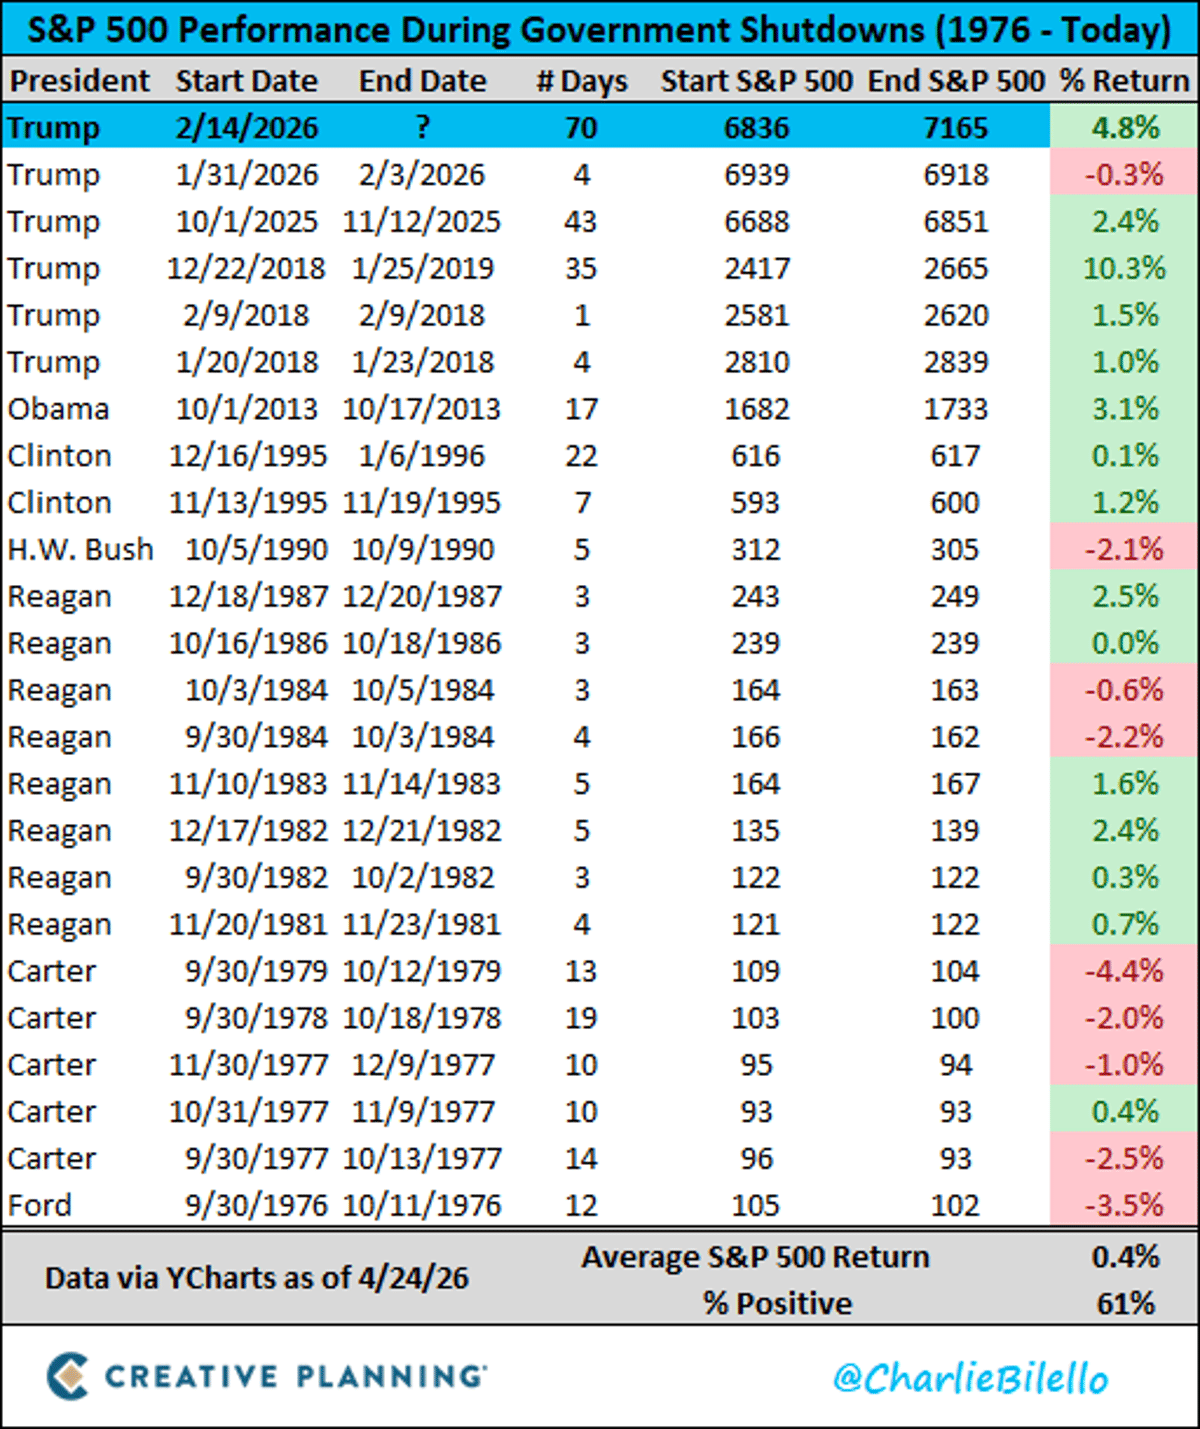
S&P 500 Climbs Despite Longest Government Shutdown
Does a government shutdown negatively impact the stock market? No. The S&P 500 has gained an average of 0.4% during prior shutdowns and is up 4.8% during the current shutdown which is the longest in history at 70 days and counting. $SPX https://t.co/zrFBbspSbR
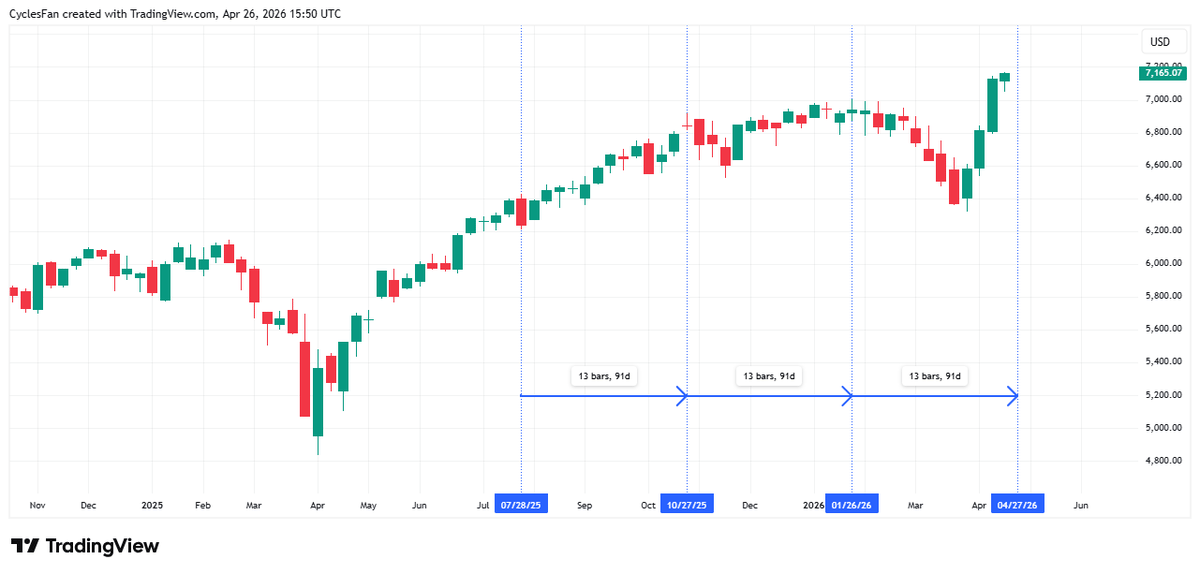
SPX Hits 13‑week Cycle, Expect Sector Rotation, Down Week
$SPX has made some sort of top every 13 weeks since July, whether it's a short term top like in July, or a multi week top like in January. We may see another one next week. I expect rotation, semi...
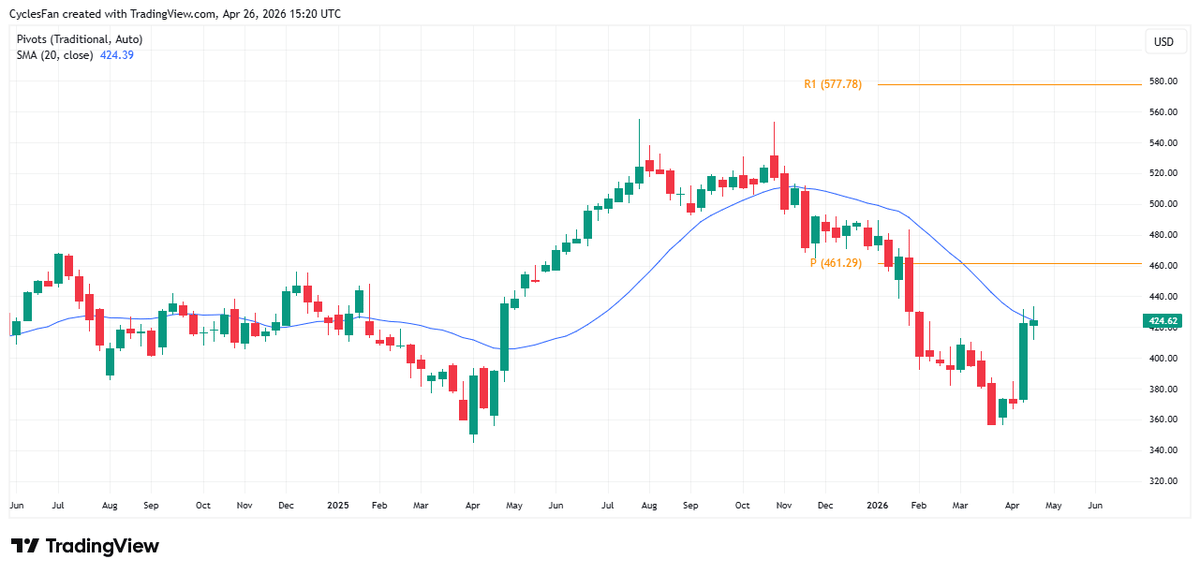
MSFT Expected to Break 20‑Week MA, Target 461
$MSFT - Despite the 4 week rally it has not confirmed an intermediate term low yet since it has to regain the 20 week MA to do that, but I expect it to be confirmed next week and the rally...
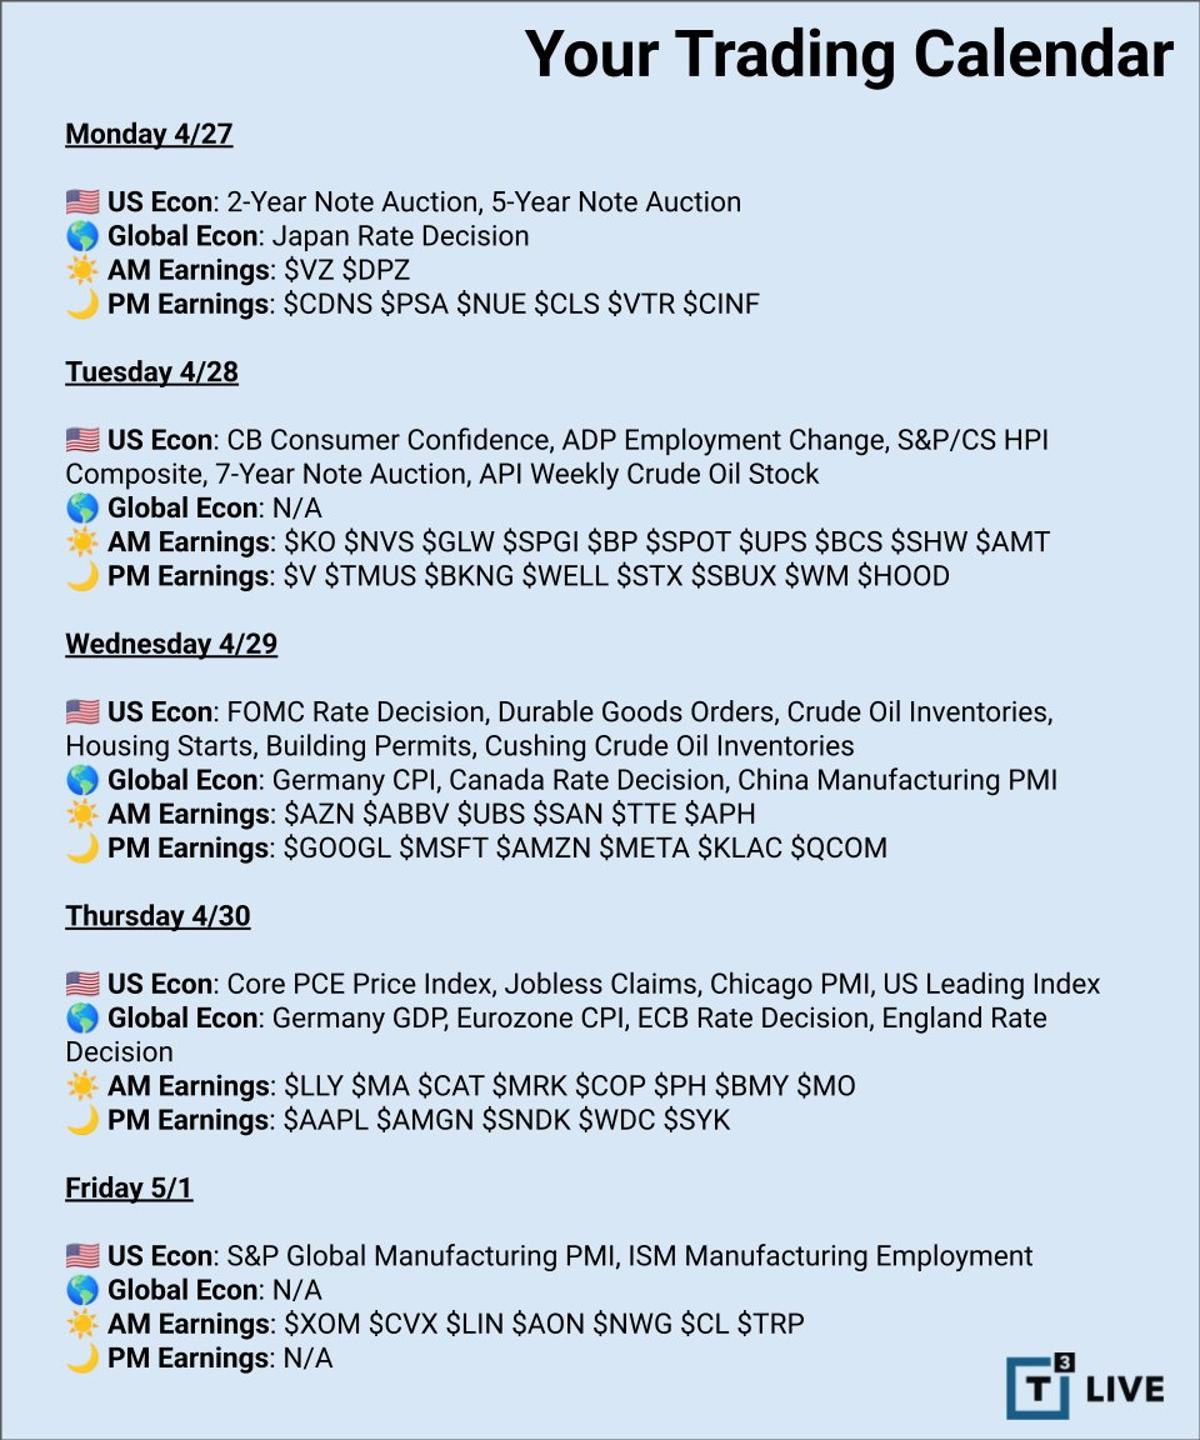
Fed Decision and Tech Earnings Drive This Week's Market
What's on your watch list this week? We have the Fed and tech earnings on deck: $GOOGL $MSFT $AMZN $META $KLAC $QCOM $AAPL $SNDK $WDC Mailing List Access: https://t.co/YtTTmqCyAJ https://t.co/9PNbw4tIEH

Barron's Poll Predicts S&P Decline—Contrarian Signal
The Barron’s Big Money Poll is out. Twice a year they survey portfolio managers and strategists across the country. We like to use it as a contrarian indicator. Right now, they’re telling you the S&P 500 is headed lower for...
SOXX Soars, NVDA Stalls: Catch‑Up Unlikely
Since NVDA and MAGS all-time highs in late October, SOXX is +48%, NVDA is -2%, and MAGS is -4%. Historically it's rare for NVDA to "play catch up" to SOXX. If you expect NVDA to break out to new highs here,...
Trim AI Winners, Shift to Undervalued Cyclicals
Macro: AI narrows rally; key: Magnificent Seven drive S&P; risk: frothy AI valuations, delayed cash flows; insight: trim AI-winner exposure and reallocate to underpriced cyclicals. — Viktor Kopylov, PhD, CFA More insights: t.me/si14Kopylov
Weekly S&P 500 Overview: Tech, Cyclicals, Global Growth
Weekly S&P500 ChartStorm https://t.co/E8W2wyPwfe This week: technical check, seasonality snippets, fund flows, semiconductors, market froth at the top, cyclicals, global growth, emerging market equities... https://t.co/VkeqMQTomr
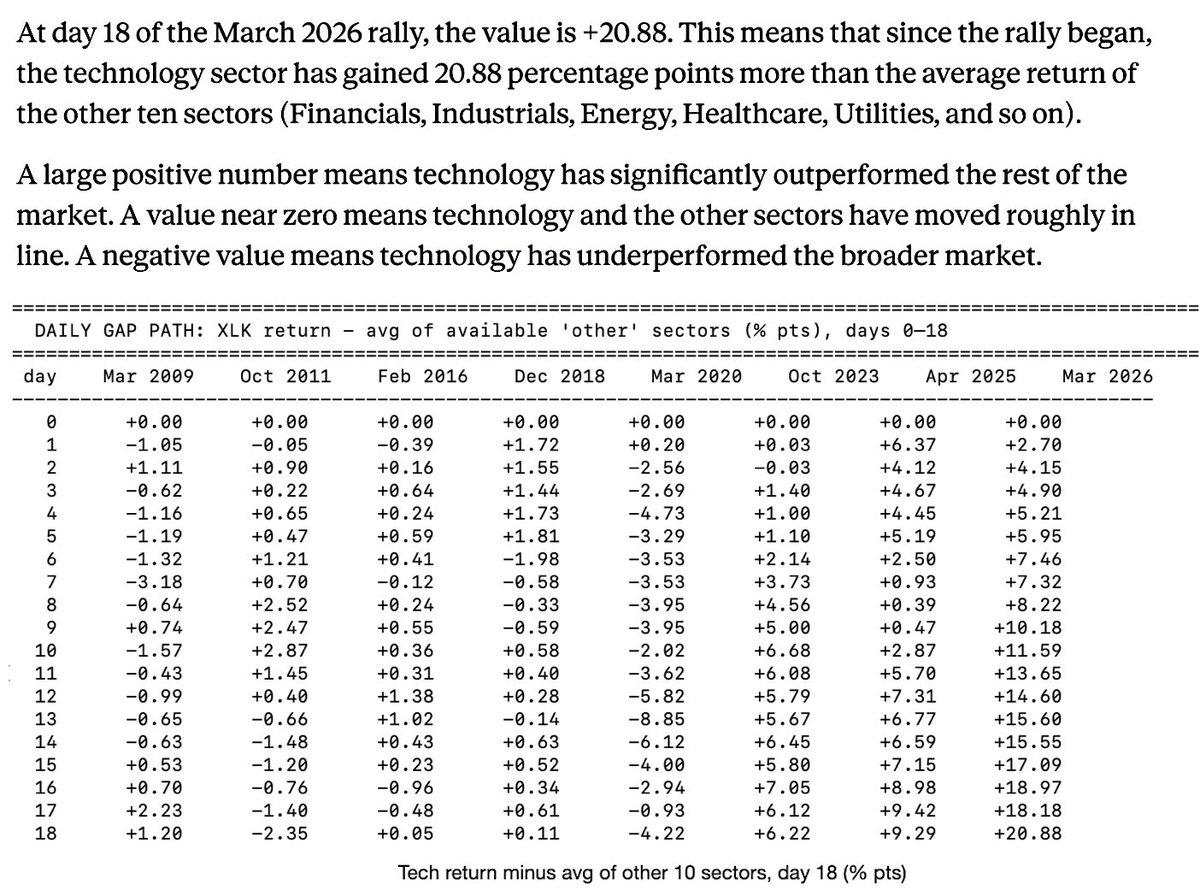
Tech Surges: Day 18 Outperforms Since 2009
Here's the magnitude of the tech outperformance on day 18 relative to past lows including '09 $ES_F $XLK https://t.co/H2qomw2O5h
Credit Spreads Signal Market Direction; Equity Lags Behind.
S&P 500 just hit 7,000 for the first time ever. HY credit spreads: 285 bps. Exactly where they sat in June 2007. One of these markets is wrong. Credit leads. Equity follows. Always has. https://t.co/r8IUinGk9s
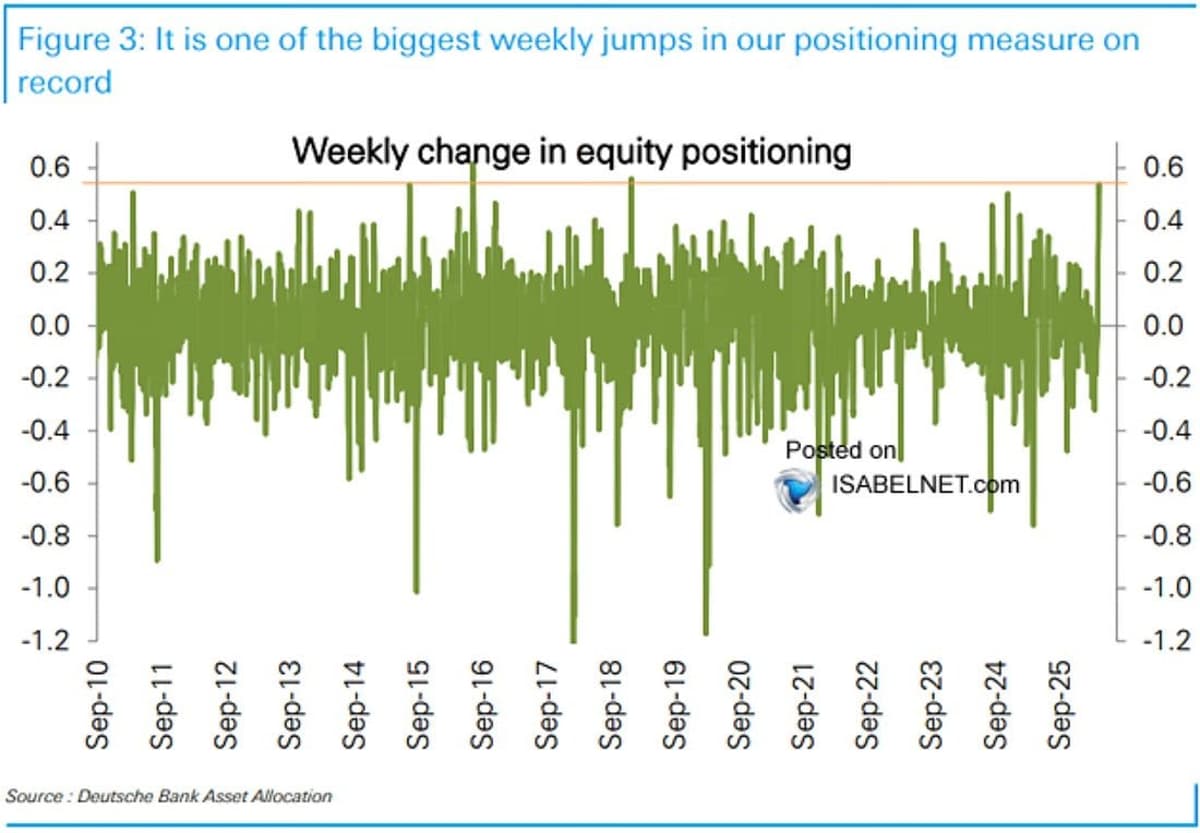
Record Money‑Market Outflows Spur Historic Equity Surge
Back in the pool? Record money market outflows and historic single-week jump in equity positioning. Also, AAII bulls largest weekly jump since Jan '25. Thanks @EricSoda for sharing these in your note today. https://t.co/WL1QFkNGnx
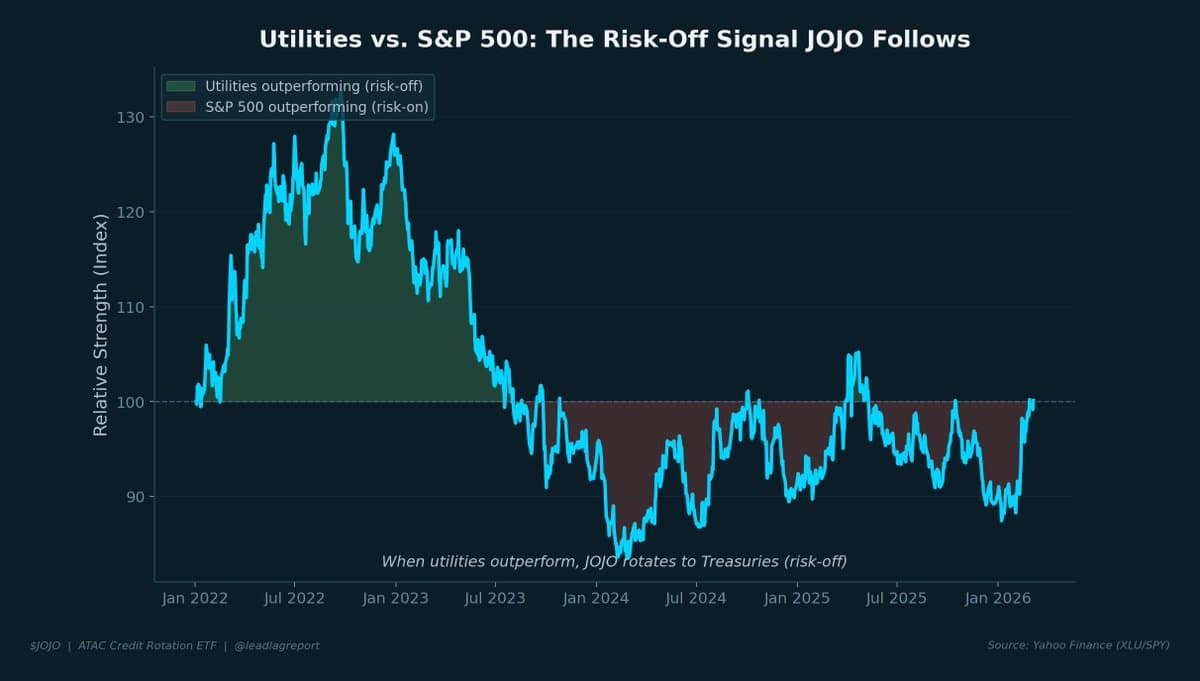
Utility‑Market Correlation Signals Risk Appetite, Guides $JOJO
Inter-market signals matter. The relationship between utilities and the broad market tells you something about risk appetite. $JOJO listens to that signal. @leadlagreport https://t.co/zaRxS4ePjI

US Stocks Outshine Europe on Fundamentals and Technicals
Regarding these latest charts from the Financial Times: The question isn't whether US equity markets are better positioned than Europe to weather the impact of the war. Between superior fundamentals and stronger technicals, the US clearly holds the edge—valuation gaps notwithstanding. The...
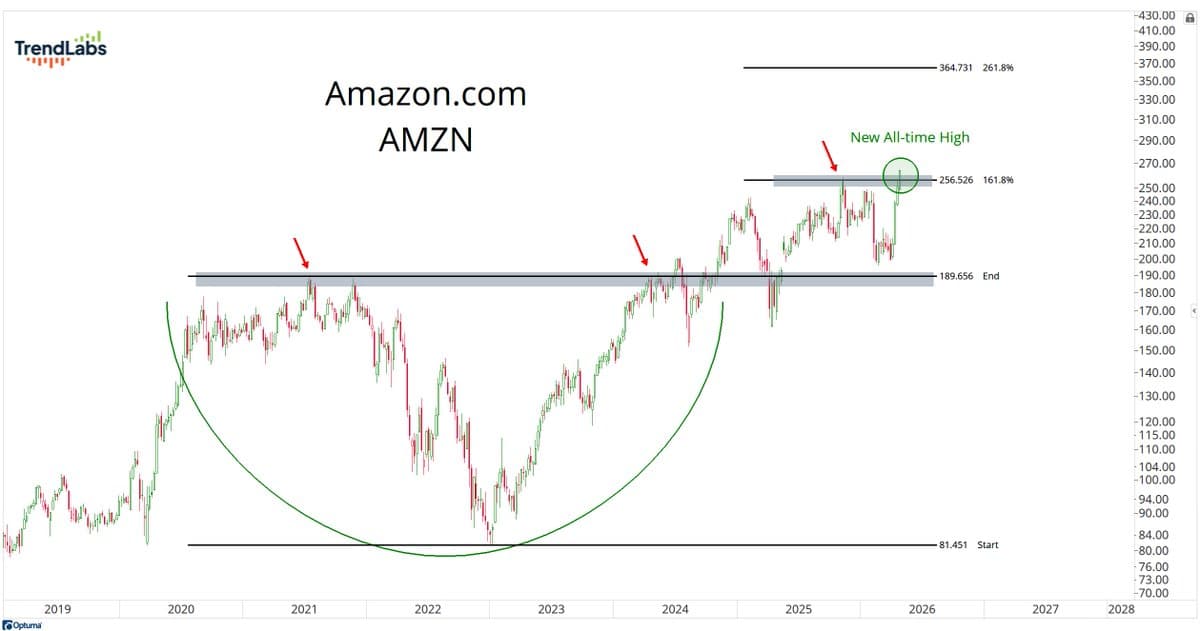
Amazon Hits Record High, Now $3T Market Cap
Amazon, with almost a $3 Trillion market-cap, representing 23.5% of the Consumer Discretionary Index and 4.5% of the Nasdaq100 just closed at its highest levels in history $AMZN https://t.co/aTqfKeHi5O
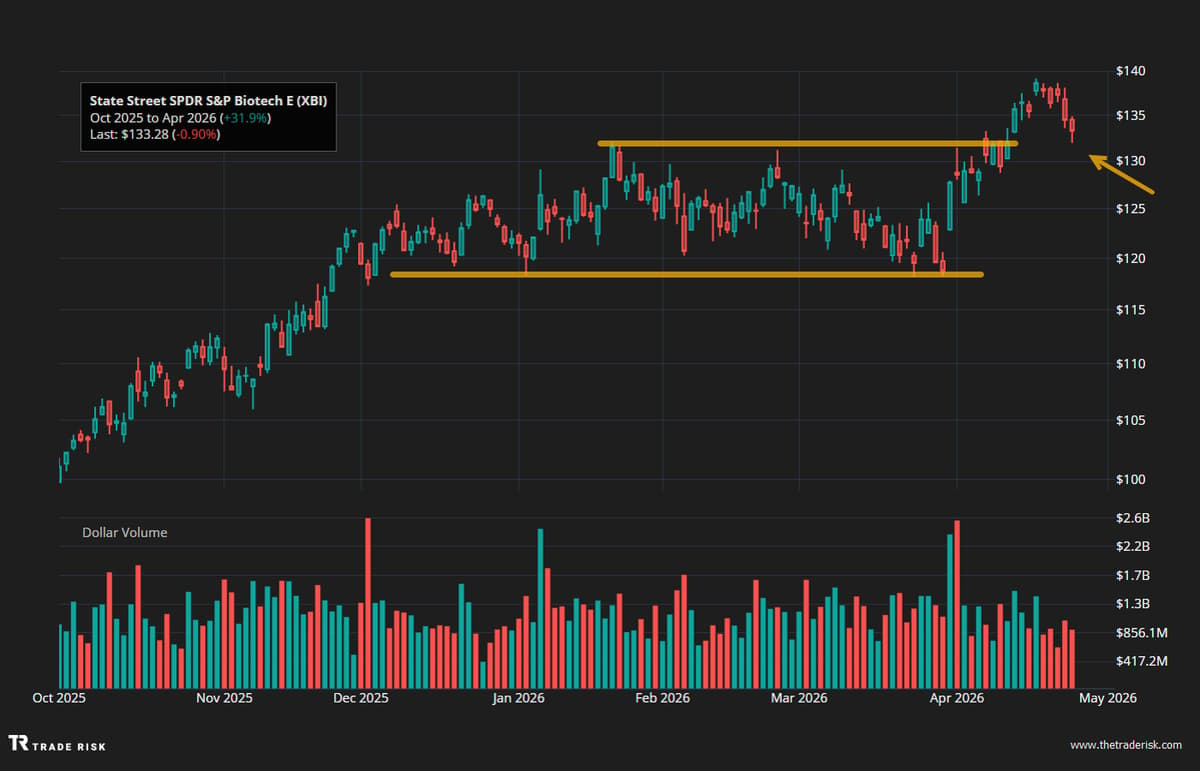
Biotech Breakout Highlights Gaps Amid Four‑week Index Rally
Four straight weeks higher for the major indices, but not everything is extended. Biotech is a good example. $XBI broke out of a 4-month range and just printed an inside week. We discuss where to find opportunity now: Watch:...
Markets Hit New Highs, Momentum Fades Slightly
#RSP -0.2% #SPX +0.8 ATH #Nasdaq +1.6% ATH #VIX contained. Momentum still good, but slowing down.
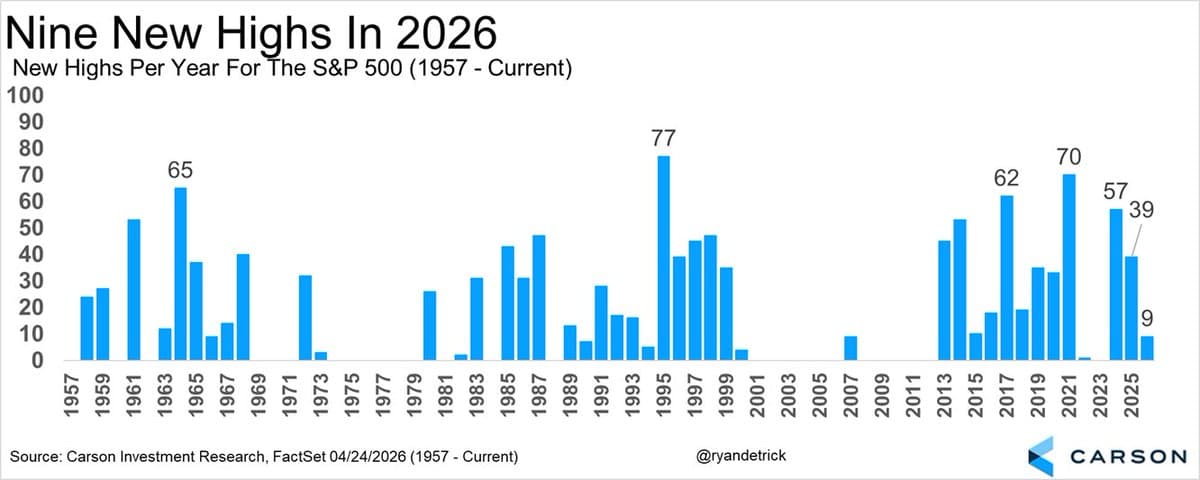
2026 Ties 2007, 1966 with Nine S&P Highs
That is nine new all-time highs for the S&P 500 in 2026. 2007 peaked at nine, so did 1966. https://t.co/M0iY2xMTgy
Tech Titans Hit 52‑Week Highs, Heat Map Shifts
Drawdown heat map looks a bit different now $NVDA $GOOGL $AMZN $TSM $AVGO all ~at 52wk highs https://t.co/1DXB8SylAf
S&P Earnings Surge 25% with Quarter Still Early
A lot going on this week but most importantly is that EPS growth is 25% with 27% of the $SPX having reported. So far really good in the face of many unknowns. Have a good weekend. Enjoy Lenny Kravitz -...
Chip Stocks Surge While Market Sectors Falter
Friday, April 24, 2026 — Daily Market Review. The S&P 500 and Nasdaq closed at brand-new all-time highs. Intel had its best day since 1987 (+23.6%). AMD crossed $500B in market cap. Nvidia reclaimed $5T. And yet, eight of the eleven S&P...
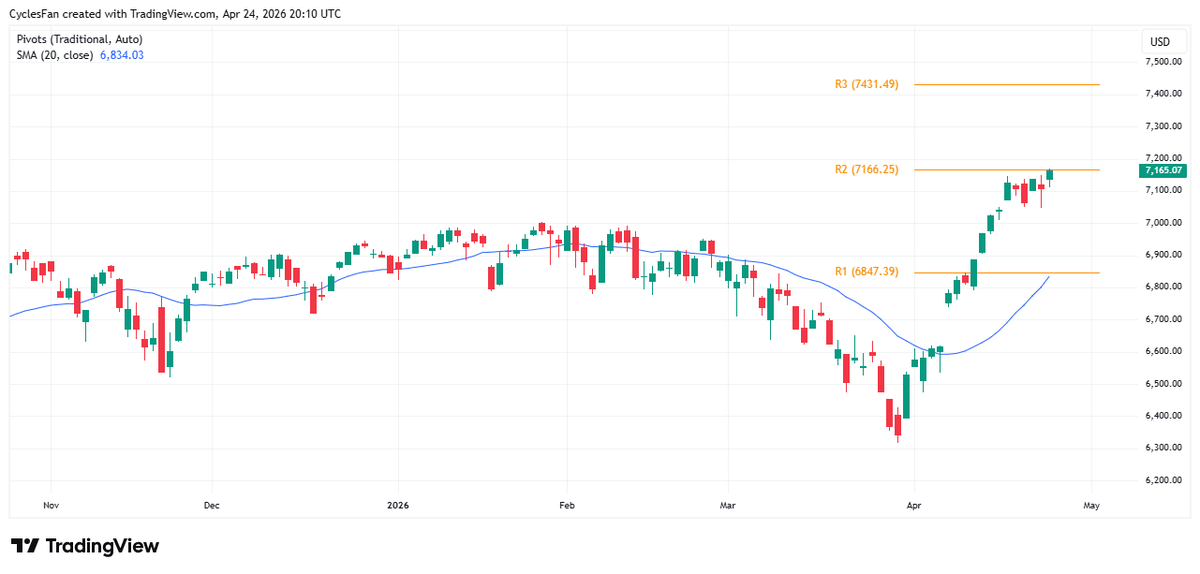
SPX Likely to Pull Back to 20‑day MA
$SPX - Made a new high today but it has reached the 2nd monthly resistance at 7166. The 3rd one is at 7431 and will not be reached in April. I expect a pullback to start next week and target...
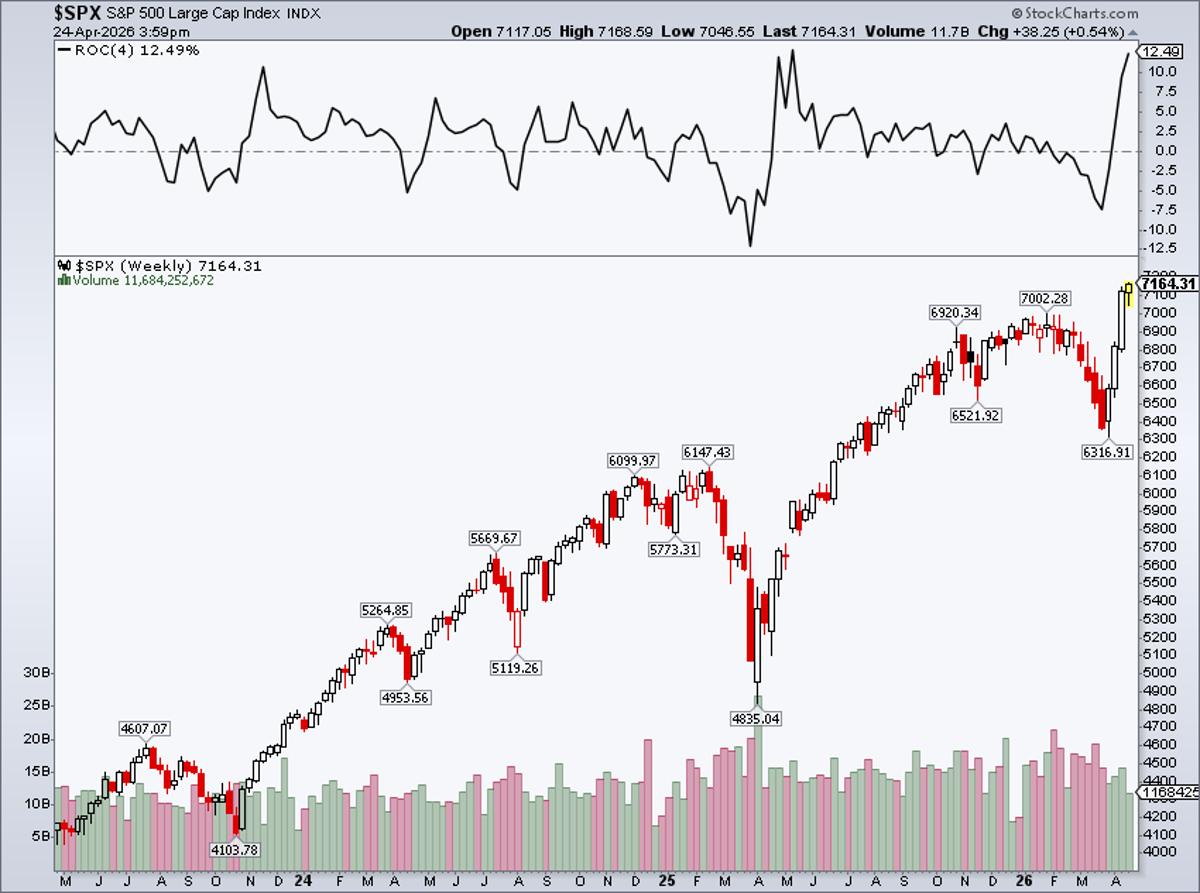
S&P 500 Hits Record, Gains 12.5% Over Four Weeks
S&P 500 record high.. up 4 weeks in a row.. +12.5% in that stretch @stockcharts https://t.co/LwE87EC6mR
SPY Poised for Continued Upside After Strong Close
$SPY Working on a strong weekly close above this local consolidation... Barring any weekend shenanigans looks set to keep running https://t.co/GsESoXQPha
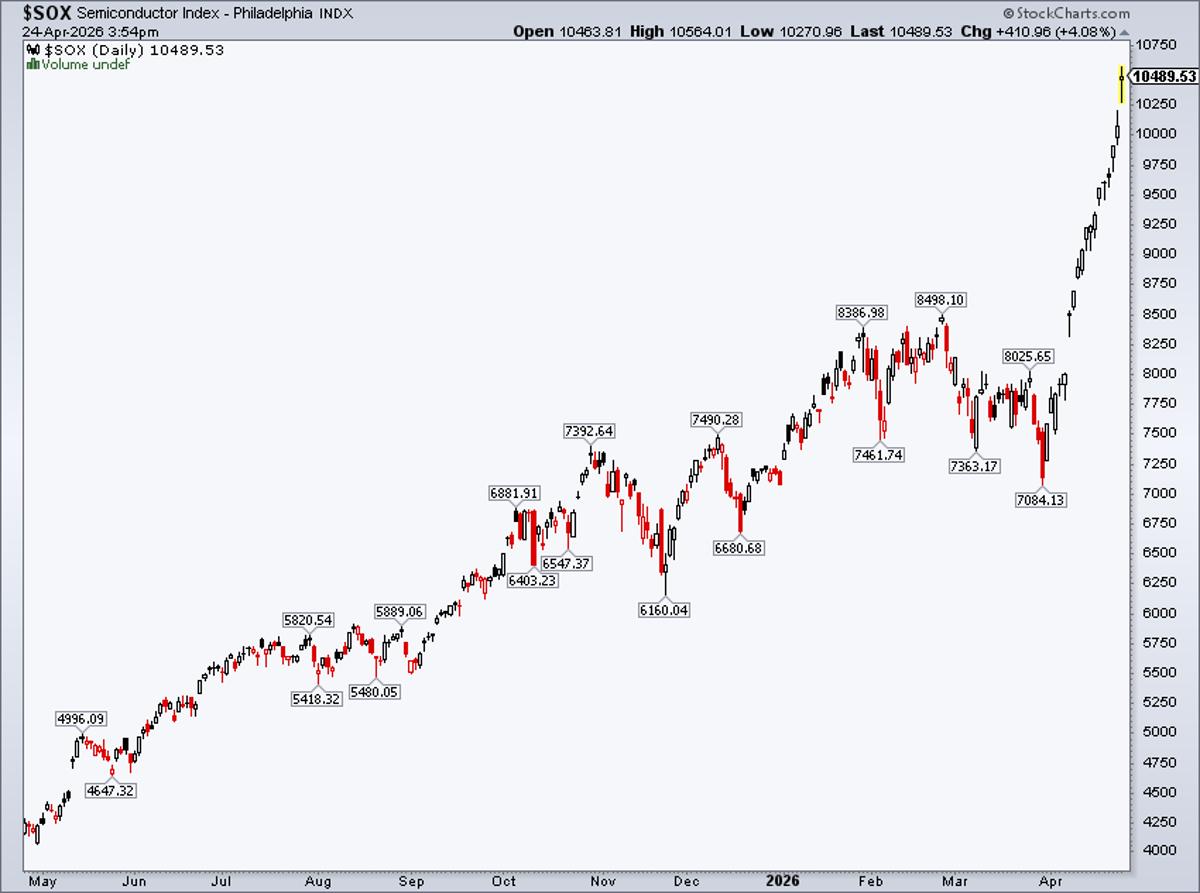
SOX Rides 18‑day Winning Streak, Gains 4% Today
$SOX perfect April continues... up 18 in a row +4% a banger today too https://t.co/eR5Iha571n
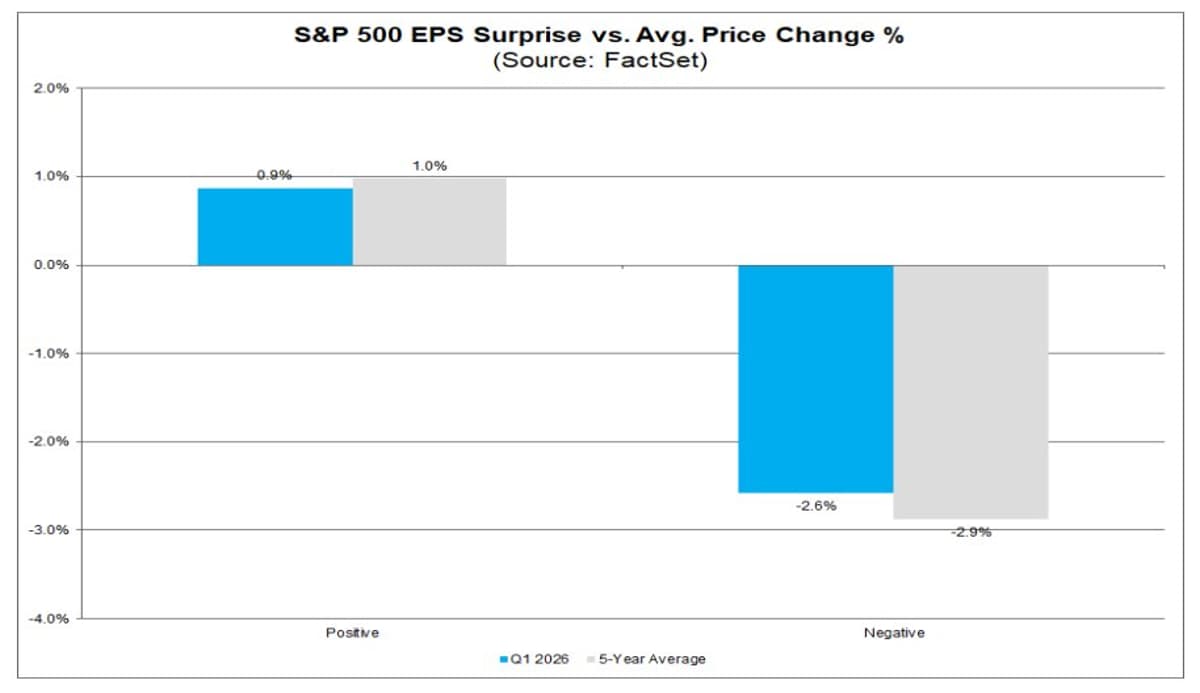
Market's EPS Surprise Reaction Remains Muted
Market Rewarding Positive EPS Surprises Slightly Less Than Average @factset also punishing negative EPS surprises reported by S&P 500 companies for Q1 less than average. https://t.co/QQufKB4FnT
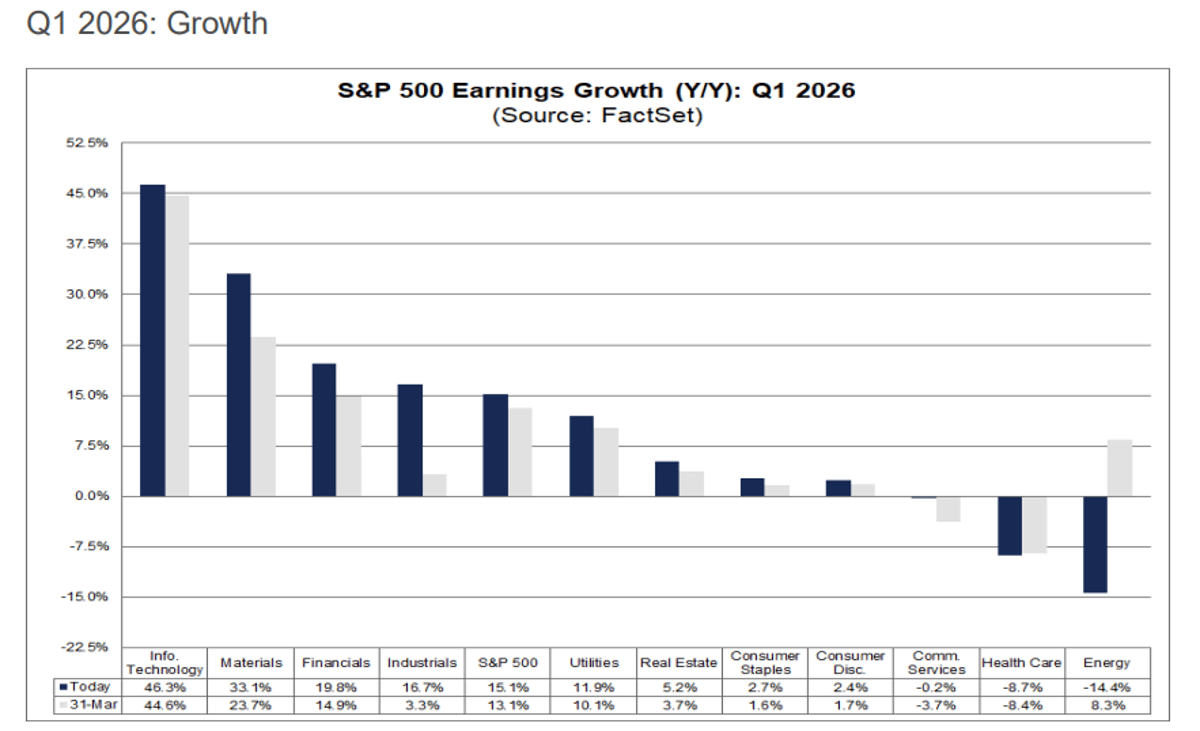
Most S&P 500 Firms Beat EPS and Revenue, Grow 15%
84% of S&P 500 companies have reported a positive EPS surprise, and 81% of S&P 500 companies have reported a positive revenue surprise. @factset The blended (year-over-year) earnings growth rate for the S&P 500 is 15.1% https://t.co/Nsrr48cr7k

Dealers Guard SPX Floor Amid Summer Downside Hedge
What are Vegas odds for gap down Monday? (Likely gets bought in a week, but still.) Dealers are defending $SPX $7100 floor past six days, where $SMH has risen 42% in 19 days - all the while institutions are hedging for...