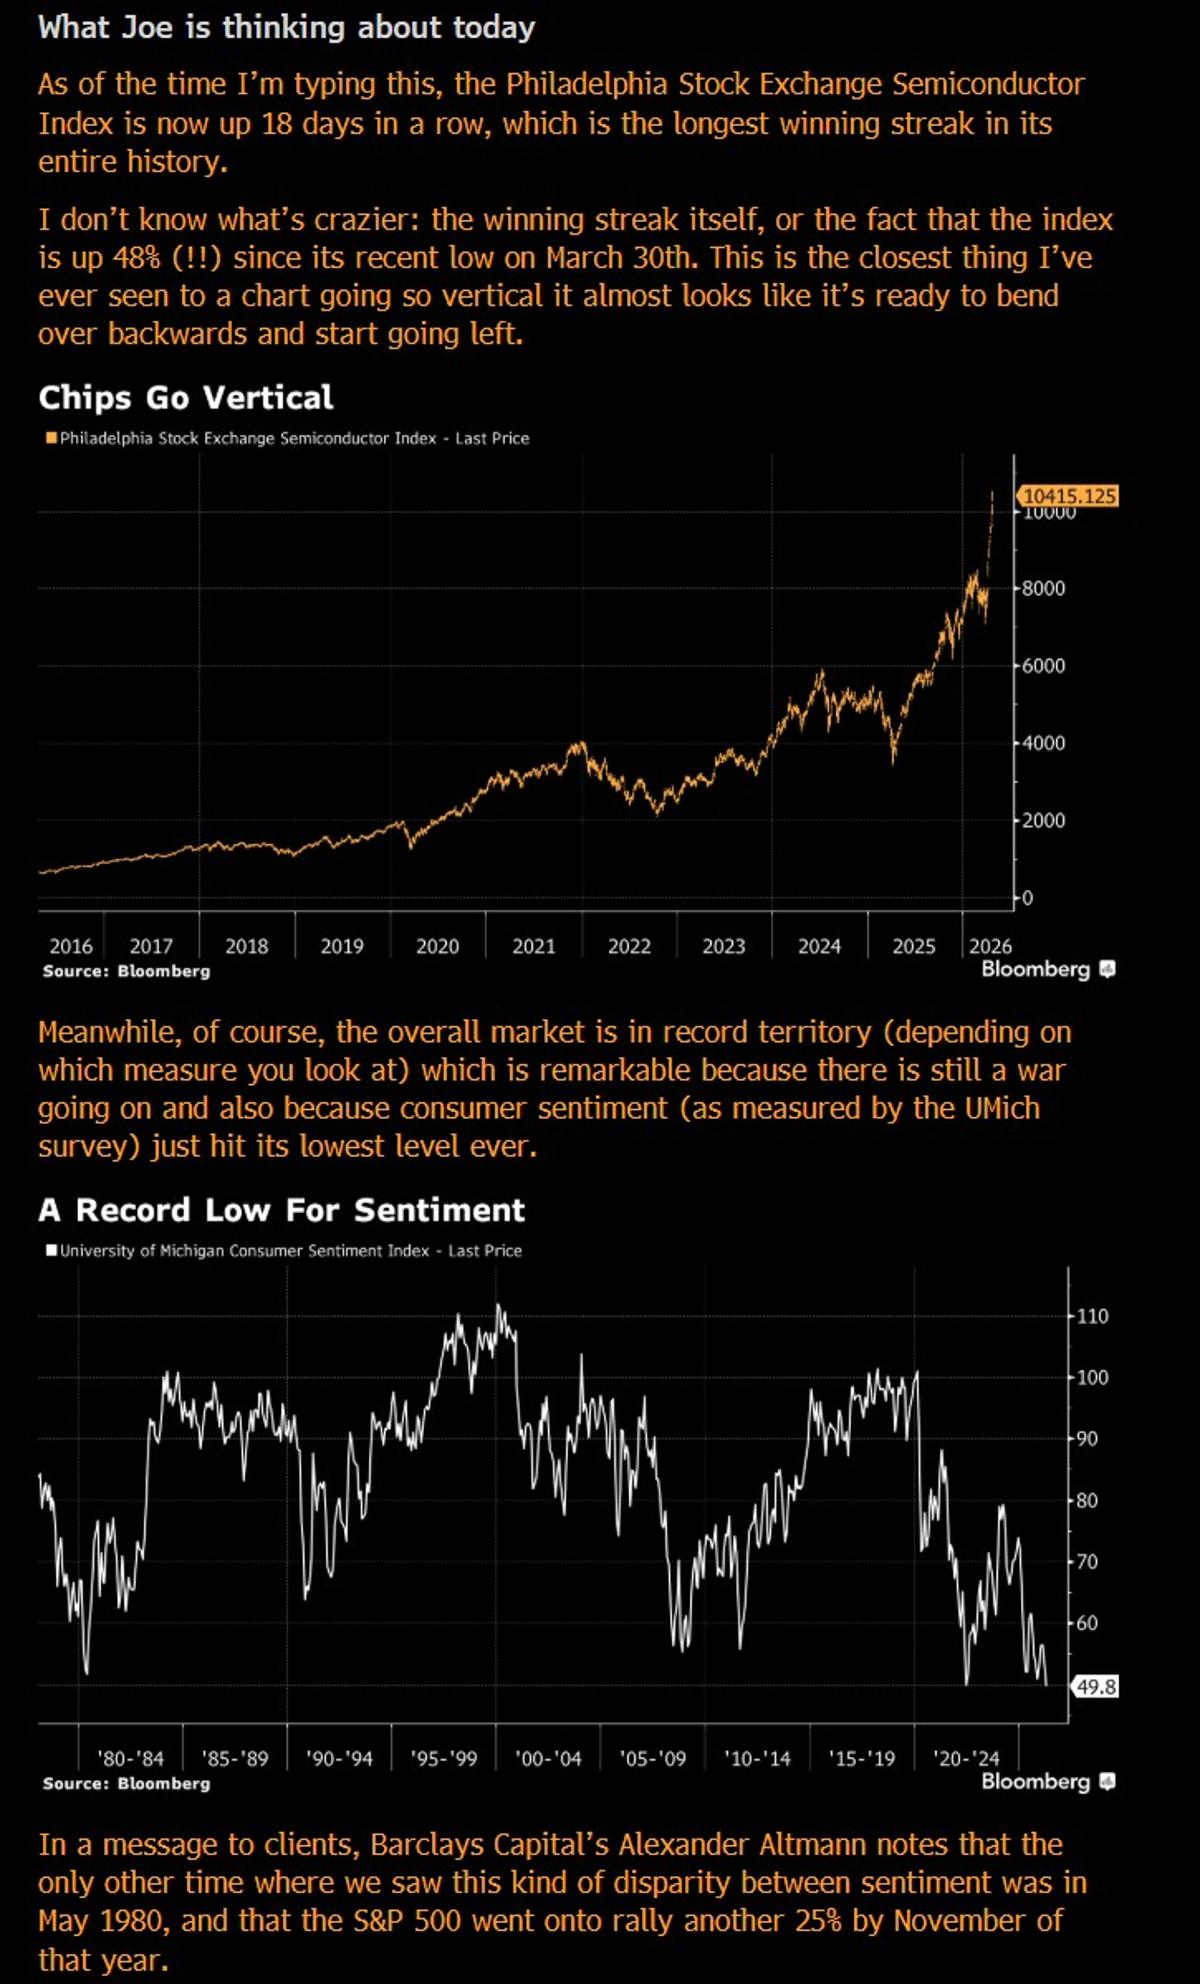
Bull Market Thrives Even as Consumer Sentiment Hits Historic Low
THE COMPLETELY RATIONAL, CRAZY BULL MARKET In today's newsletter, I wrote about how it makes total sense for the stock market to be surging to all time highs almost every day, even as consumer sentiment plunges to its lowest level in history. https://t.co/UVyeLervF4

Leveraged ETF Rebalancing Drives $14B Inelastic Close Buying
Another stall day. At current prices 14BN of inelastic buying must occur on the close. This is heavily front run through the balance of the day. That flow is heavily tilted to NDX and Semis. It...

Market Divided: Utilities Up, Treasuries Split, S&P Near
Utilities outperforming. Treasuries diverging. S&P sitting just below its 200-day moving average. The intermarket signals split 2-2 for first time since February. What does a market divided mean for your portfolio? https://t.co/bTNJ1cQFiS
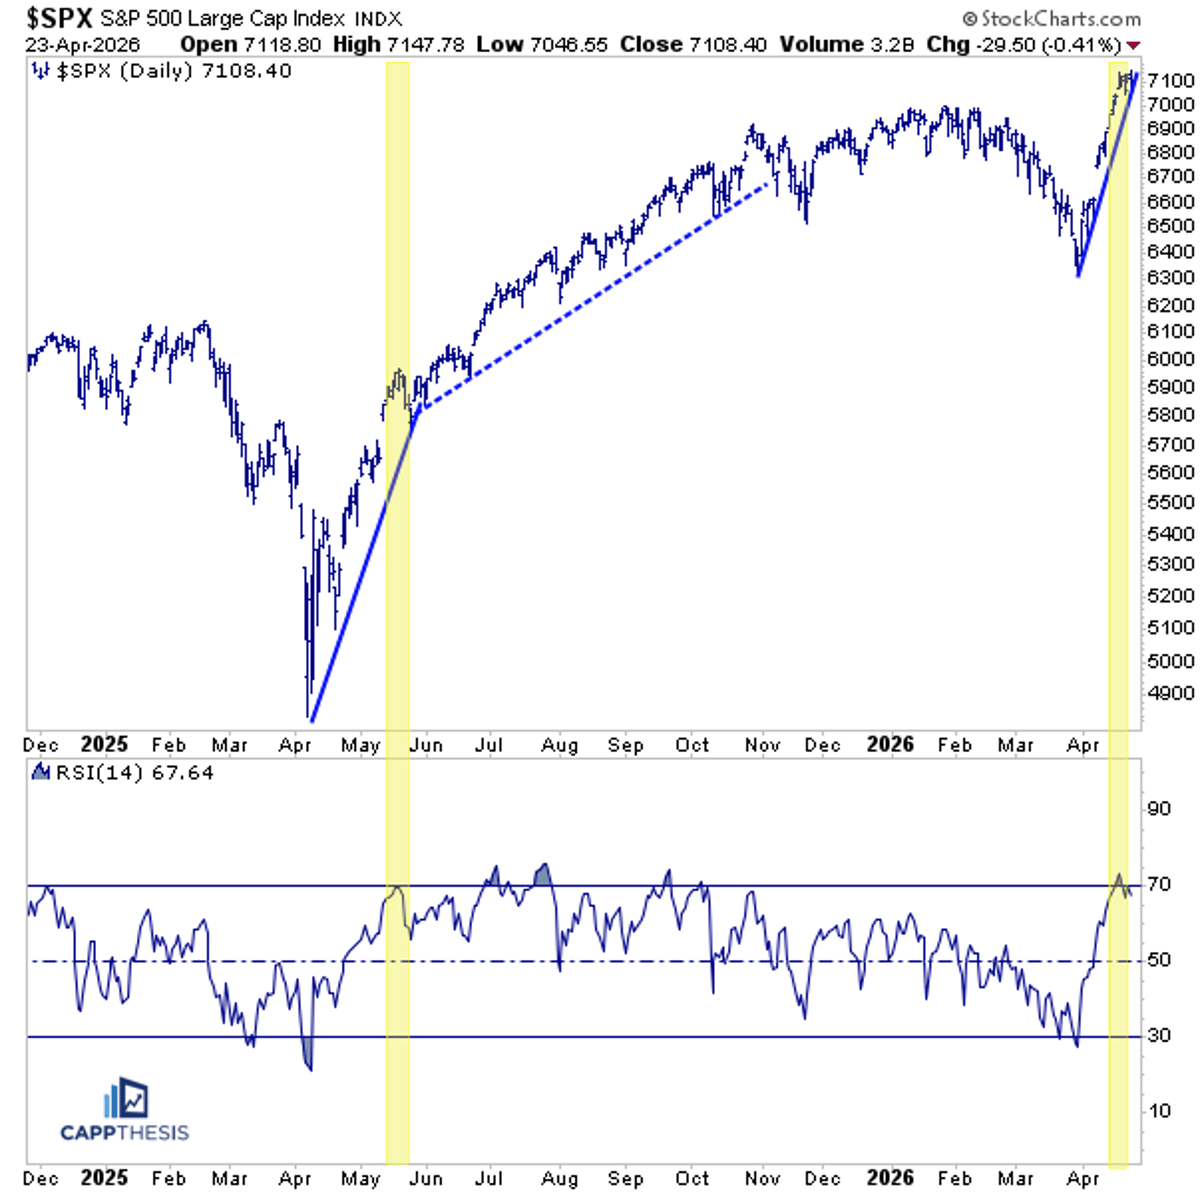
SPX Overbought, Trend Likely to Flatten Soon
$SPX just hit overbought for the first time since September and remains in a steep uptrend. This mirrors last spring: after first tagging the RSI’s 70 threshold, momentum cooled, but the trend held and simply flattened. The next phase now...
Morgan Stanley's Cynical Intel Call Misses Major Upside
MS is taking a L on their post-earnings note on Intel.. I get some of the risk reward debate, but cmon. "We have missed a large move here at EW, and we aren't trying to be stubborn - we just remain...
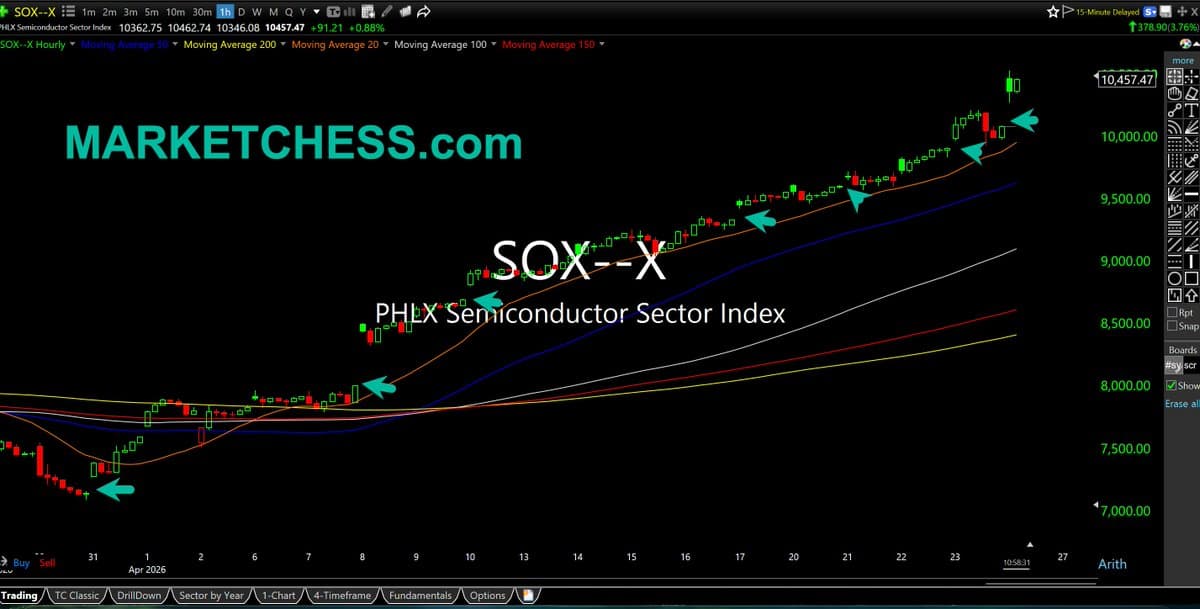
Unfilled Gaps Signal Potential Parabolic Blow‑Off Top
$SOX Hourly. Philadelphia Semiconductor Index. Easy to lose track of how many gaps (most unfilled) since just the end of March. This is outlier action, and rhymes with historical parabolic blow-off tops. https://t.co/IdzUeem8Ga
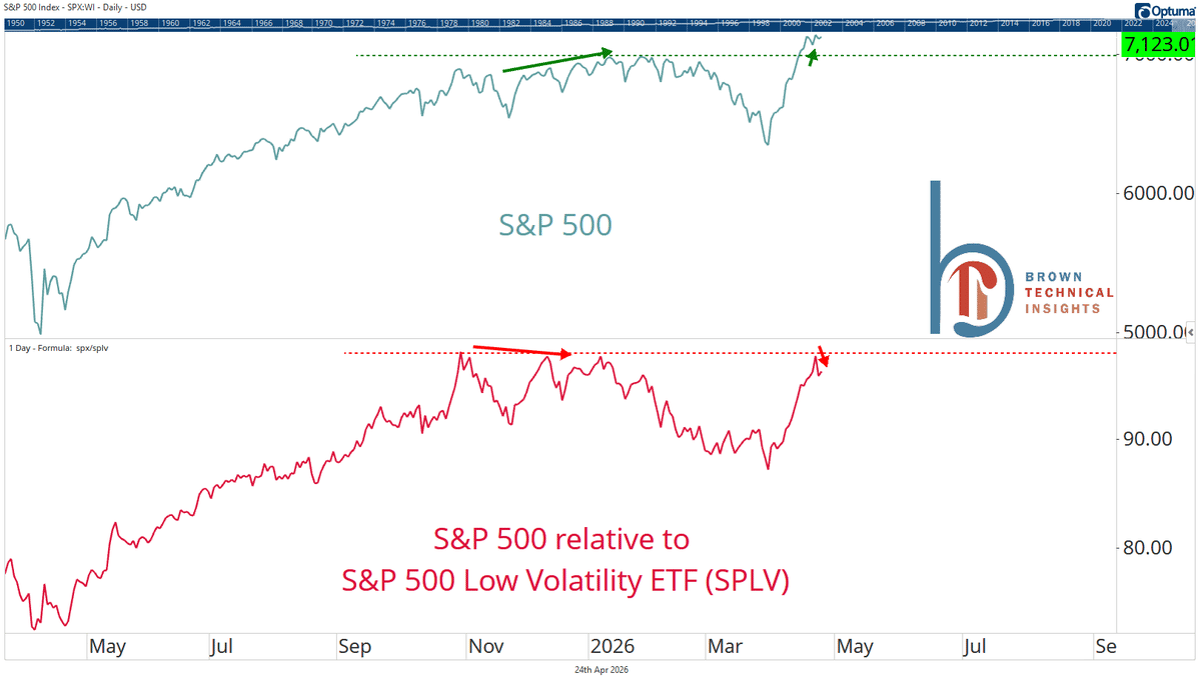
SPX Diverges From SPLV, Fails New Highs
Not fatal, but a divergence to watch near-term is SPX vs. SPLV. Failed to make new highs with the index last week (just like the fall) and turning lower at resistance this week https://t.co/Jvl11woJOk
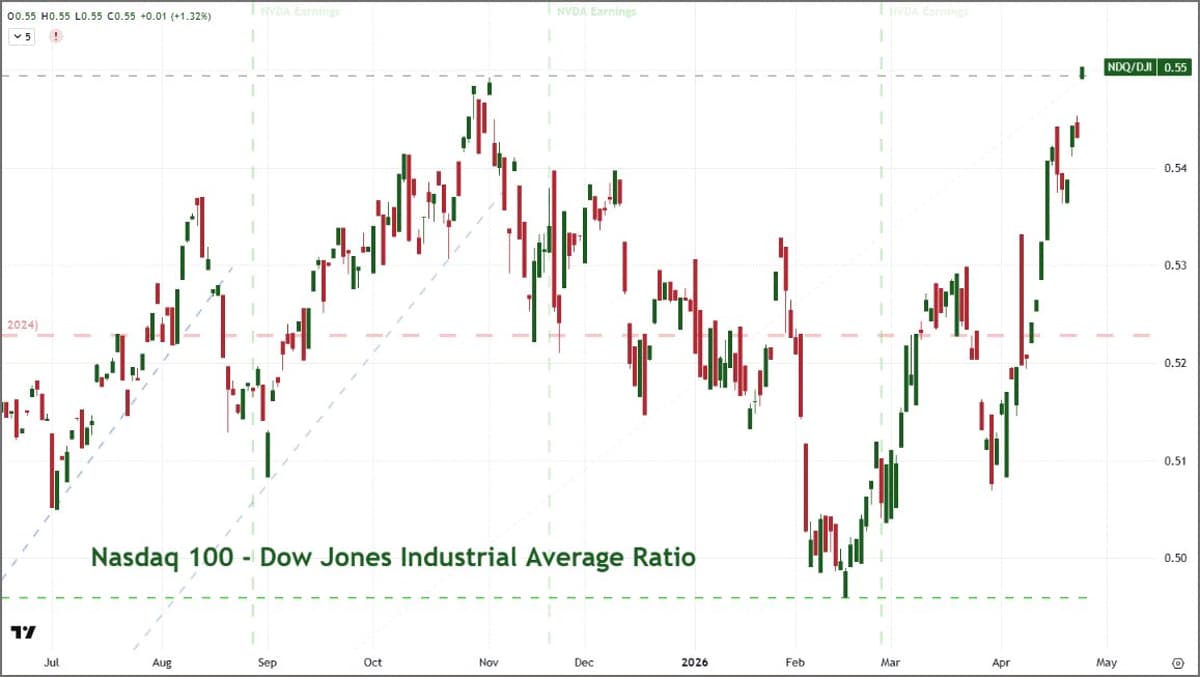
Nasdaq/Dow Ratio Hits Record, Tech Leads Market
The Nasdaq 100 to Dow ratio (tech to blue chip) gapped to a record high this morning - overtaking October's previous peak. Intel earnings certainly helped. Is this a sign that AI and tech is a leading theme again? Is...
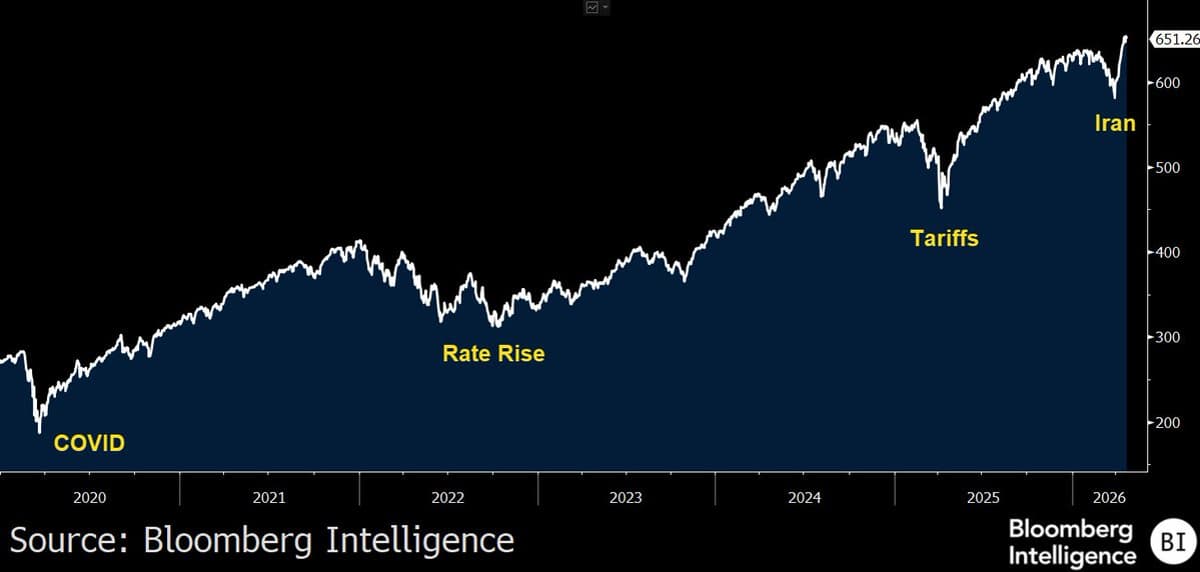
VOO and Chill Defies Doom, Stocks Jump 9%
Wrote today about how 'VOO and Chill' (America's #1 inv strategy) won again, claiming another victory vs the overthinkers and doomer columnists who told us it was all over a month ago as media mentions of "war" spiked. Instead, stocks...
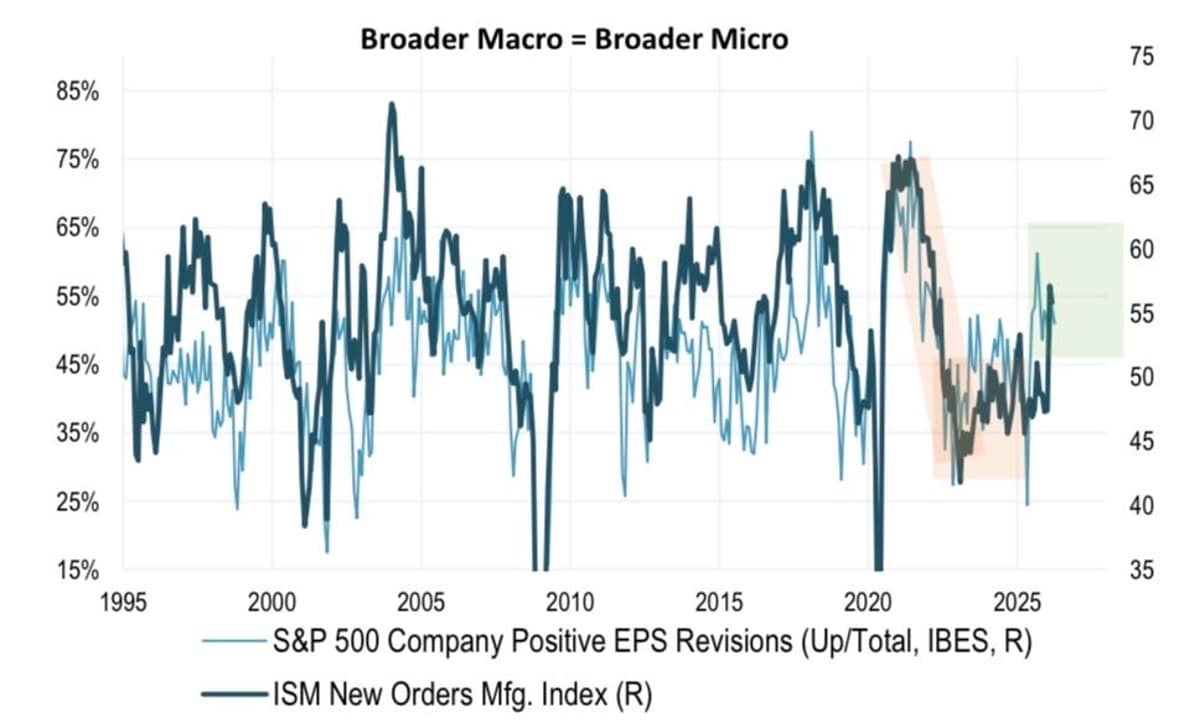
US Market Resilience Fueled by Broadening Earnings Revisions
Behind the resilience of the US market is broader earnings. While cap-weighted earnings’ contribution remains Tech heavy, as it’s been for years, we’ve move up to a broader number of companies seeing positive EPS revisions alongside the continue strength in...
Updated Equity Rally Outlook and Quant Model Status
Joined @TheKEReport yesterday to update our outlook for the equity rally & status of our quant models. Also touched on the technical picture for software, semis, and the metals complex. Check it out... $IGV $SPY $SMH $SLV $GDX https://t.co/stOrJq6zle
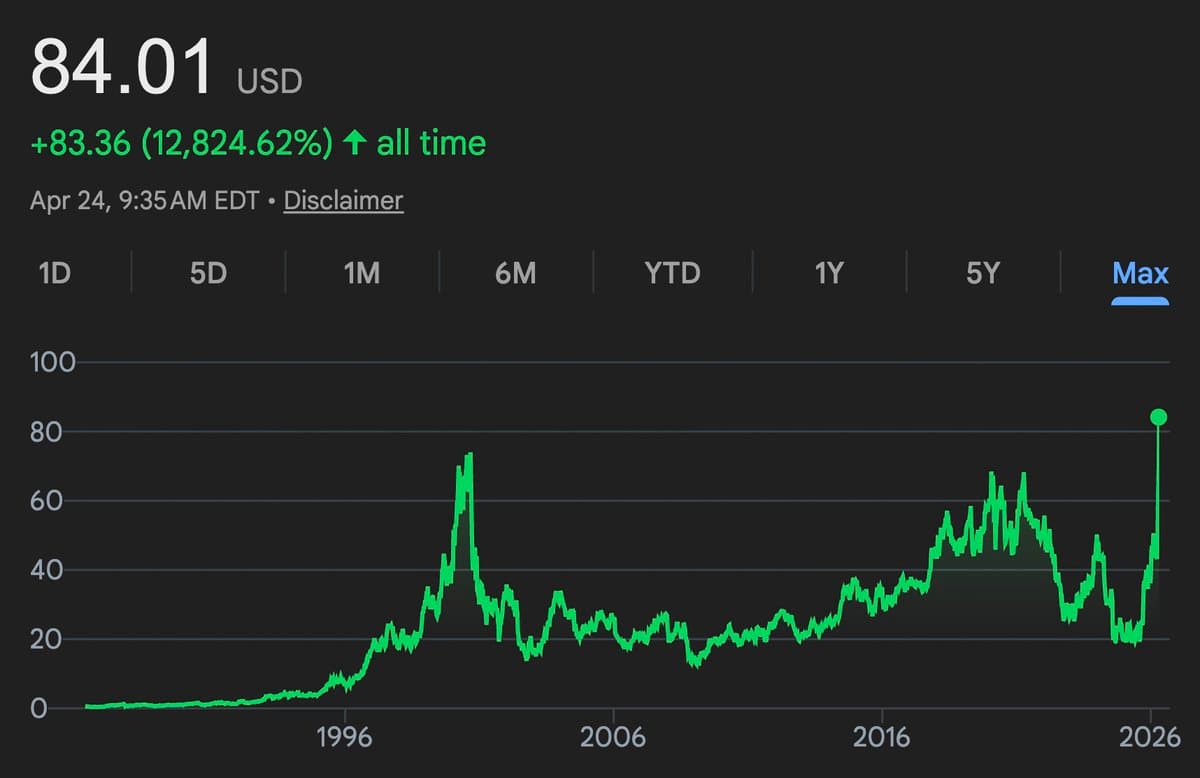
Intel Surges 24%, Reaches 2000‑era High
JUST IN: Intel $INTC jumps 24% at the open, passing its highest level since 2000 https://t.co/wmIFpIEeYC
Intel Sentiment Surges: More Buys, Higher 2026 Target
Wall Street Research on Intel $INTC 2026 Stock at $84 Buys: 17 Holds: 31 Sells: 4 2022 stock at $24 Buys: 11 Holds: 20 Sells: 12 *Bloomberg ANR data.

Geopolitical Whispers Fuel Market Volatility Ahead of Central Bank Decisions
Iran headlines are driving everything today $DXY pulled back hard off its highs $SPX whipsawing $CL all over the place No US data on the calendar, so every geopolitical whisper is moving markets. Add Israel/Lebanon missiles and China restricting US tech investment...

Commodities Surge While AI Trades Face Crowding Warning
2026 Oil Service $OIH +49% Natural Gas $FCG +29% Uranium $URNM +26% Commodities $BCOM +24% Micro Caps $IWC +14% All Metals $XME +14% Russell 2000 $IWM +13% Coal $COAL +11% Big Tech $QQQ+6% Mag7 $MAGS -1%* *Beware of crowded trades and capex funding vehicles for everything AI.
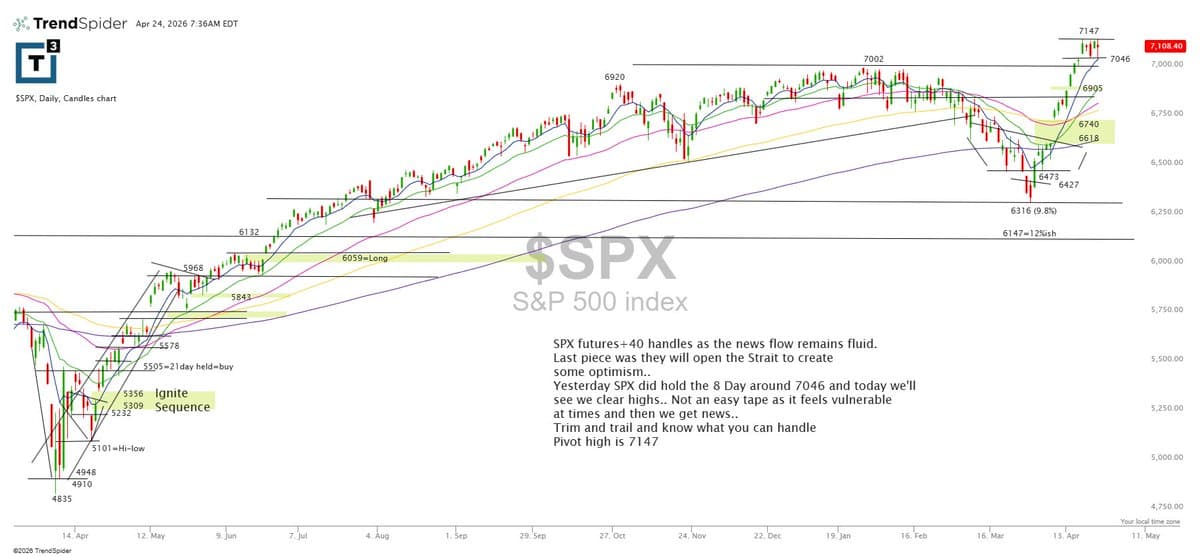
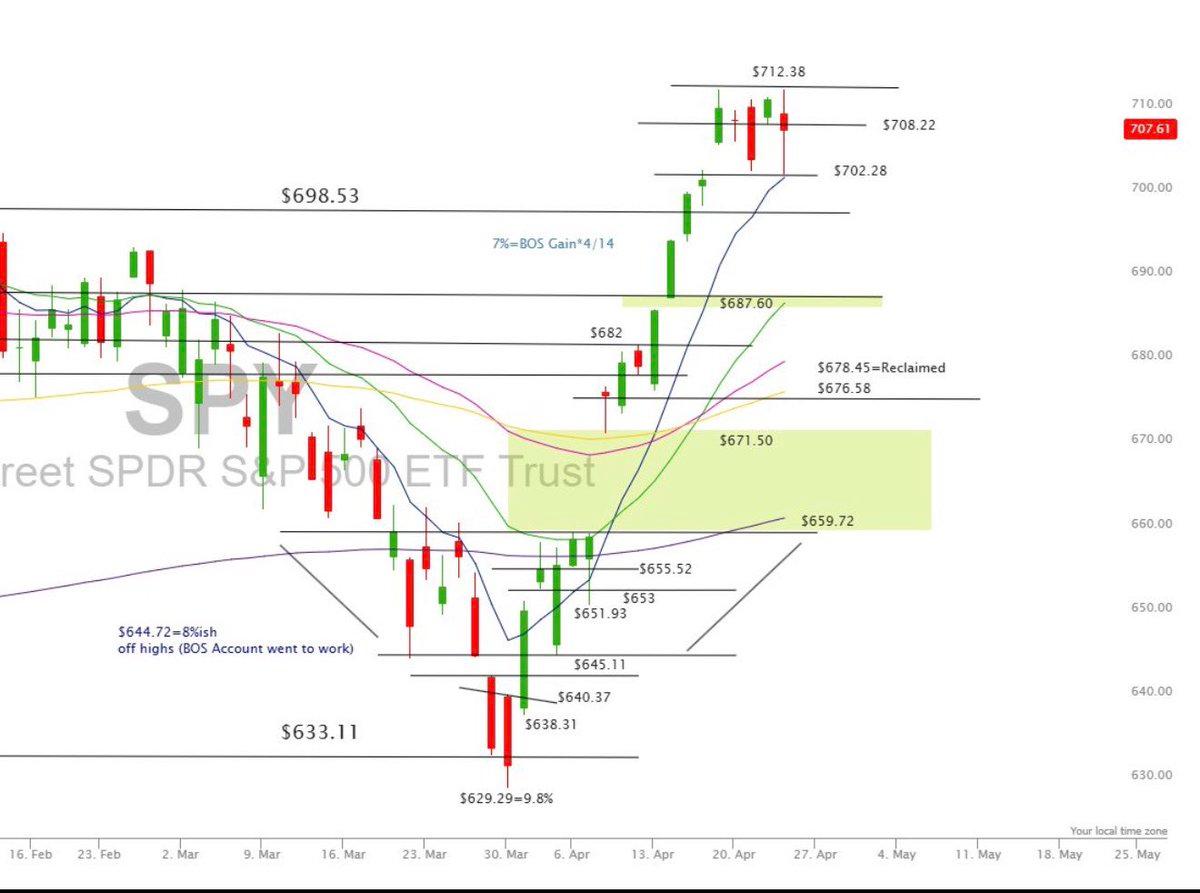
SPX Holds Near 7046, Eyes 7147 Pivot High
Yesterday $SPX held the 8-day around 7046, and now we’ll see if it can clear highs, though the tape can feel vulnerable when headlines hit. Trim and trail, know what you can handle, and the pivot high is 7147. https://t.co/tayVTcW34A
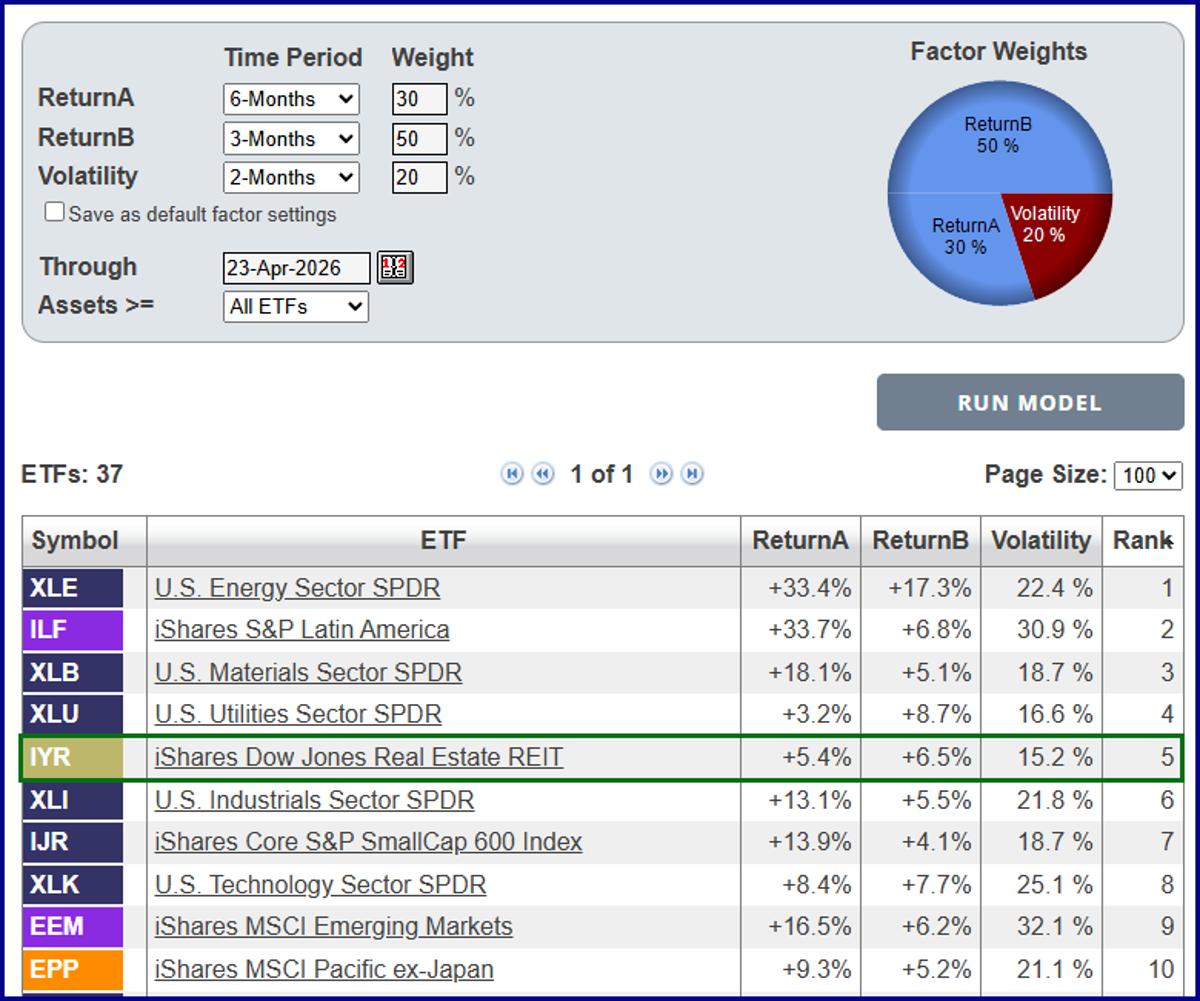
REITs Surge in Relative Strength, Model Shows
Anyone else noticing REITs climbing the ranks of relative strength. One of my models @ETFreplay https://t.co/eybq3g61Kl

Inflation Expectations Set to Drive Market Direction
🚨 Morning Market Rundown – April 24, 2026 🚨 Consumer sentiment day is here — inflation expectations will be the key market watch 👀 🗓️ Economic Events: 1000 - UMich Consumer Sentiment (Apr): Exp 48.5; Prior 47.6 1000 - UMich 5-Year Inflation Expectations (Apr):...

Amazon-Backed X‑Energy Secures $1.02 B IPO
Speaking of IPOs for exciting energy startups... Amazon-Backed Nuclear Firm X-Energy Raises $1.02 Billion in IPO https://t.co/K59eZ3ztTF
SPX Futures Rise, Testing Upper Range
$spx futures +2 as we try a digest above the upper range to let the oscillators go from +82 to Neutral. It hit +19 yesterday. $spy held $702.50 area https://t.co/tr9mUQvkxj
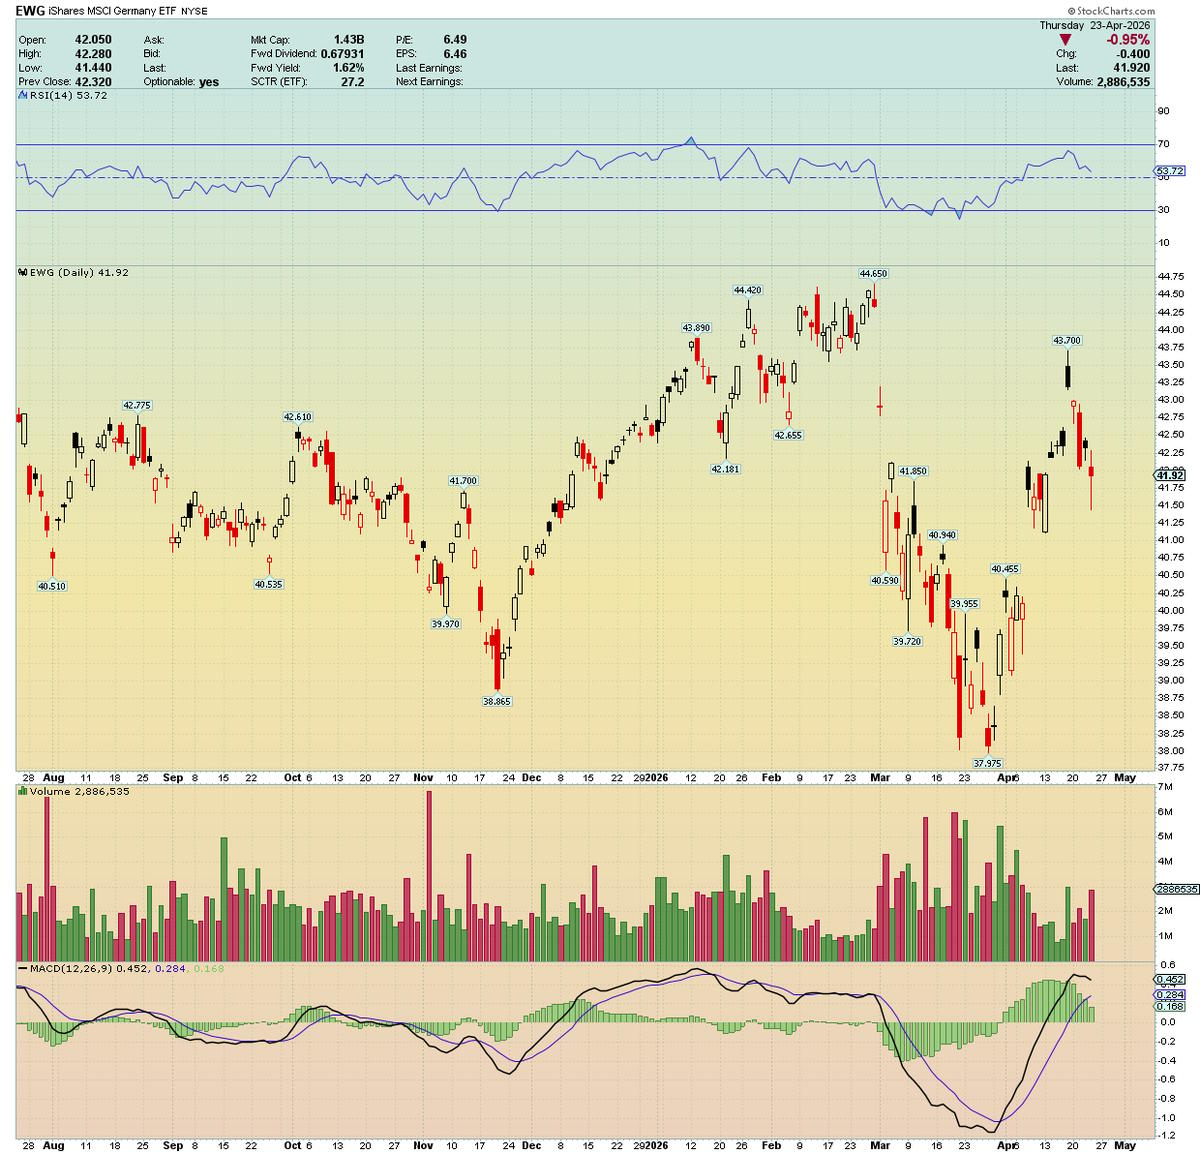
US Market Rally Leaves Europe, China Trailing
What's notable about the recent mega-insta-rally taking place in the majority of US indices is that it's not bringing in the European and Chinese market indices along for the ride?? German Index, Euro Stoxx50, FTSE and Shanghai exchange are noticeably...

Reason
ok. why is this guy wrong? honest question. the split between reasonable people being doomers and SPX ATH is odd.
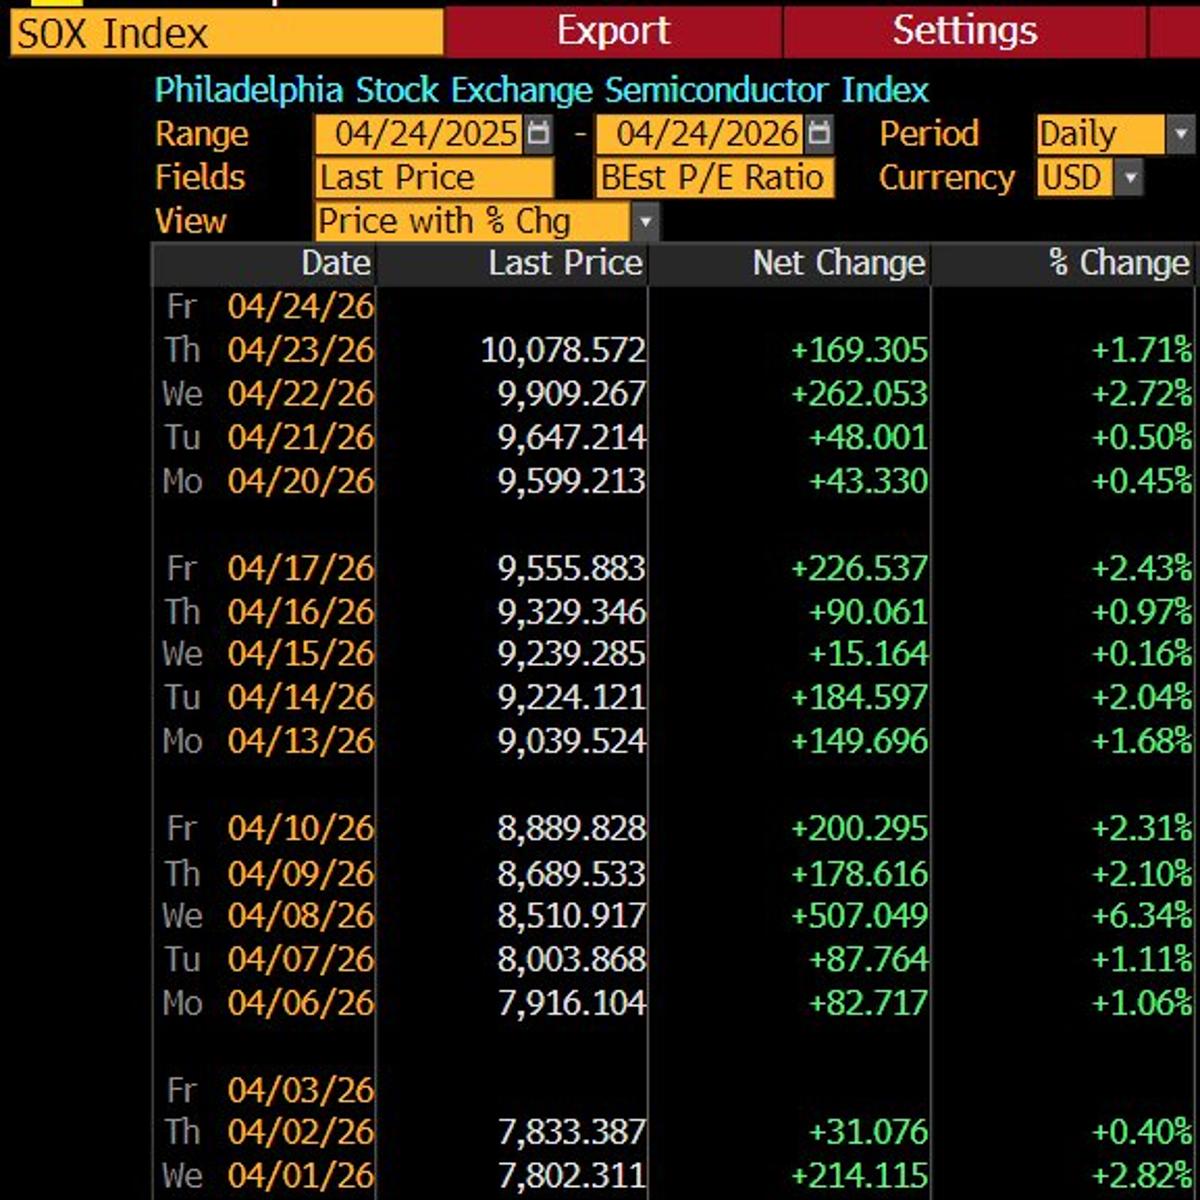
Philadelphia Semi Index Rises 17 Days Straight
Philly Semi Index has yet to closer this entire month. 17 straight days up https://t.co/FbcWeu4Z2b

Intel Hits Record High, Q1 Revenue Beats Forecasts
Intel is on pace for its first record high since 2000 after shares surged 20% in after-hours trading. Q1 revenue came in at $13.6B — more than $1B above some estimates
Options Surge Signals Intel’s 19% Earnings Jump
Heavy options activity + elevated call premiums preceded Intel's +19% post-earnings surge, as discussed earlier today with CNBC's Oliver Renick: https://t.co/HlZyHlUzwM
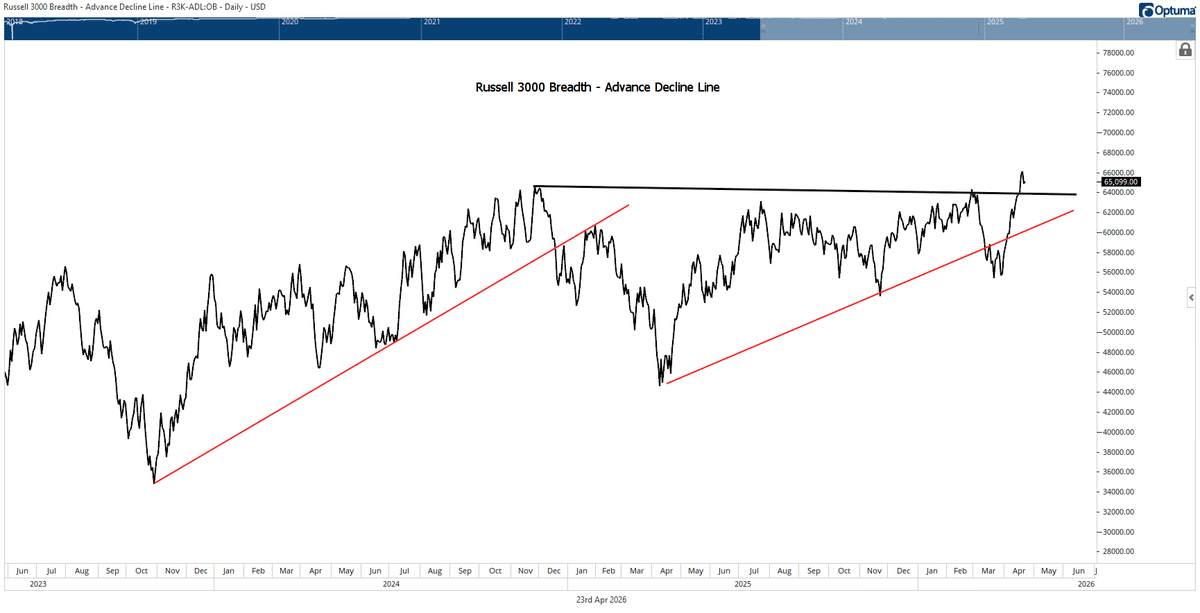
Russell 3k Breadth Hits New High After
While a number of different major sectors have not yet joined Technology's push back to new all-time highs relative to Equal-weighted $RSP, it is encouraging to see the Russell 3k Advance/Decline back at new high territory following the recent failed...

US Dividend Yield Near Historic Sub‑1% Threshold
A few more up days and the US stock market is going to take out the all-time low dividend yield of 1.1%. Do we see a sub 1 % dividend yield?!
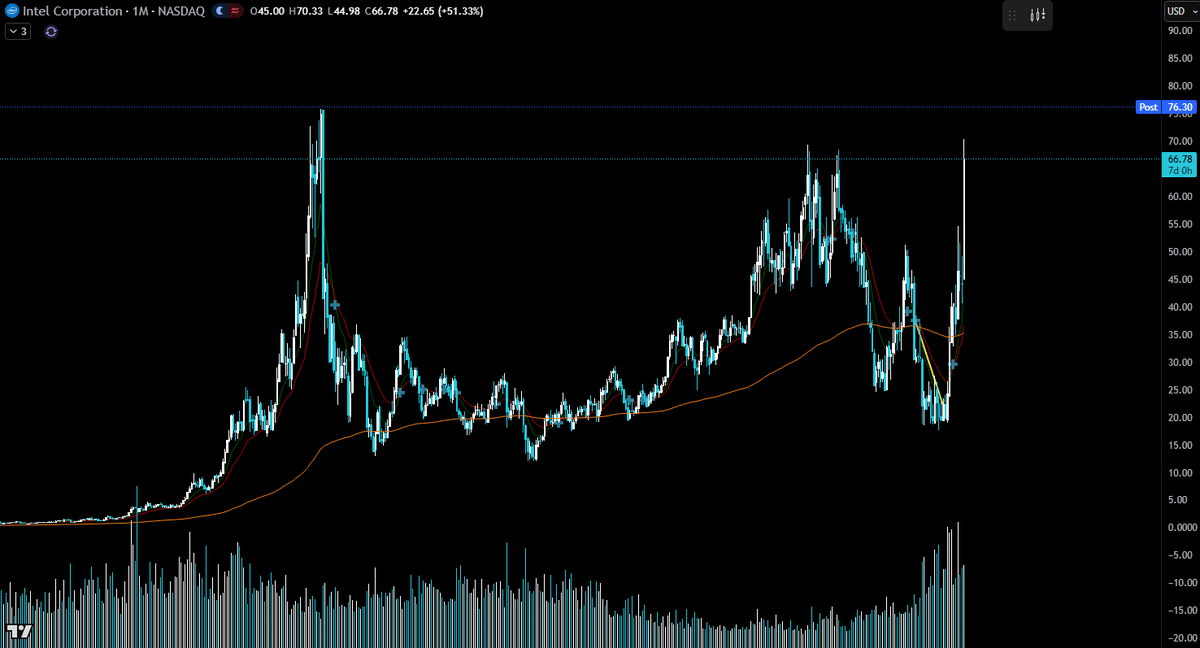
Intel Spikes to New All‑time High After Earnings
$INTC New All Time high less than a month later. Big pump after hours on earnings. https://t.co/gloCVTQUur
Large‑cap New Highs Outpace Lows 73 to 11
there are 73 large-cap stocks hitting the 52-week new highs list today... there are 11 large-cap stocks hitting the 52-week new lows list... #HighLowShow #marketUpdate #investing

Rally Fragile as Short‑Covering and AI Bull Run Fade
When This Non-Stop Rally Turns Fragile $SPX #crudeoil #IranWar An historic short-covering & AI/tech bull-run despite war escalation supply shocks & sticky-high oil prices as the mechanical buying peters out soon... makes for a fragile rally come May/June. https://t.co/4JsMqpa0x7
SPY Slides to 8‑day MA as Breadth Weakens.
$SPY into 8-MA here, as noted was likely earlier this week as saw under the hood weakness in breadth and stall out at that 1.236 level

Extended Leaders Signal Near-Term Pressure
With many leaders extended and fresh distribution in the major indexes, odds favor near-term pressure and consolidation. https://t.co/7NiHKuQ8rL

Strong Quarter Misses Expectations, AI Growth Debate Persists
$NOW: in show me mode which makes the May 4th analyst day a big one. Q was strong w RPO g +23.5%, sub revs +19%, OM 31.8% - but expectations were higher and guide underwhelmed. Debate will continue...

Warner Discovery Shareholders Overwhelmingly Back Paramount Merger
Warner Discovery stockholders overwhelmingly approve sale to Paramount, WBD says. "Based on the preliminary vote count from today's Special Meeting, WBD stockholders voted overwhelmingly to approve the adoption of the merger agreement with Paramount."
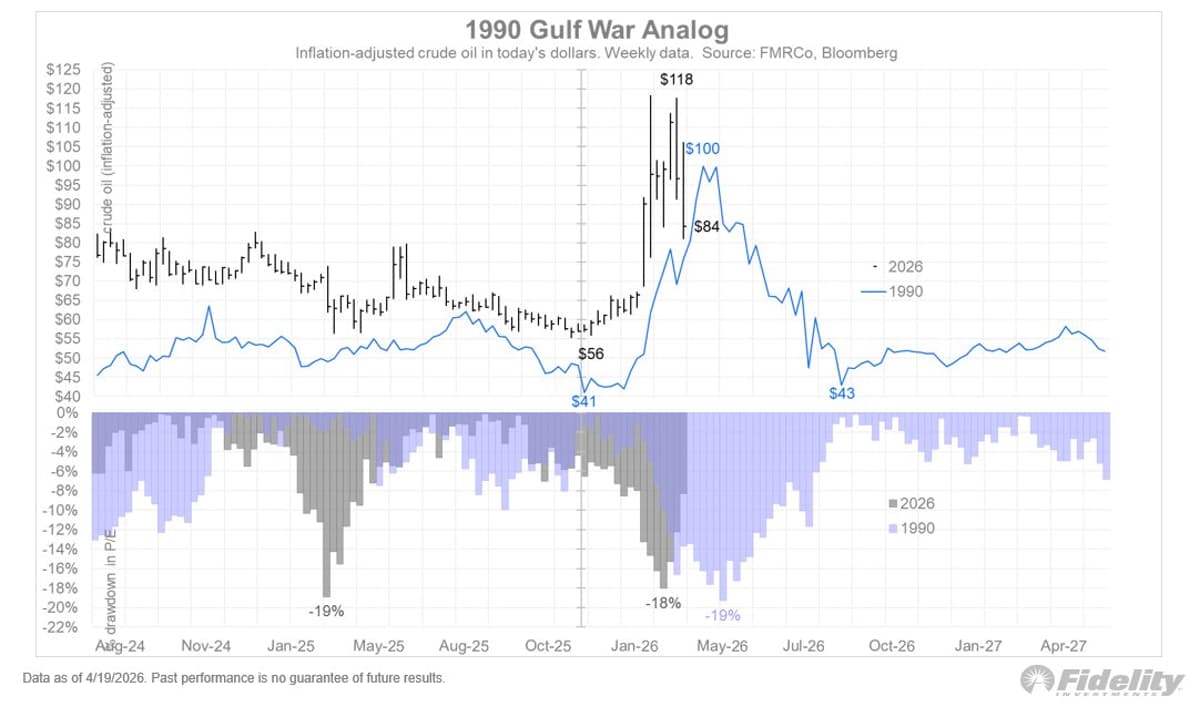
Prolonged Oil Price Spikes Extend Equity Market Correction
With crude oil prices driving equities right now, let’s take a look at two examples of oil shocks. The 1990 Gulf War took oil prices from $41 to $100 (in today’s dollars) was short-lived and caused only a brief 19% drawdown...
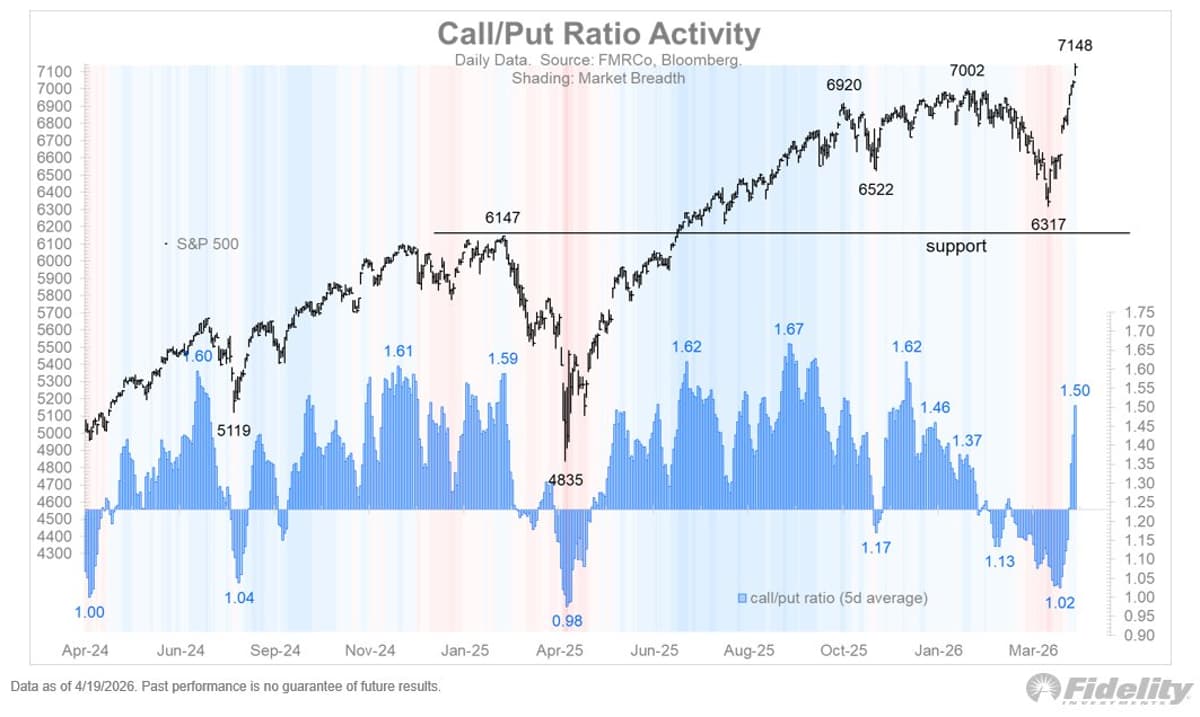
Short Covering Fuels Equity Melt‑up as Call/Put Ratio Spikes
The equity melt-up of the past two weeks was surely driven (in part) by short covering. The call/put ratio below has now surged from 1.02 to 1.50. https://t.co/jGi0QAJW3f

S&P Hits 103 Highs; Inequality Defies Policy
The $SPX has made 103 all-time highs since the Fed started shrinking the balance sheet. If inequality increases with QE and low policy rates and also increases with QT and high policy rates, maybe inequality is not about monetary policy. Warsh knows...
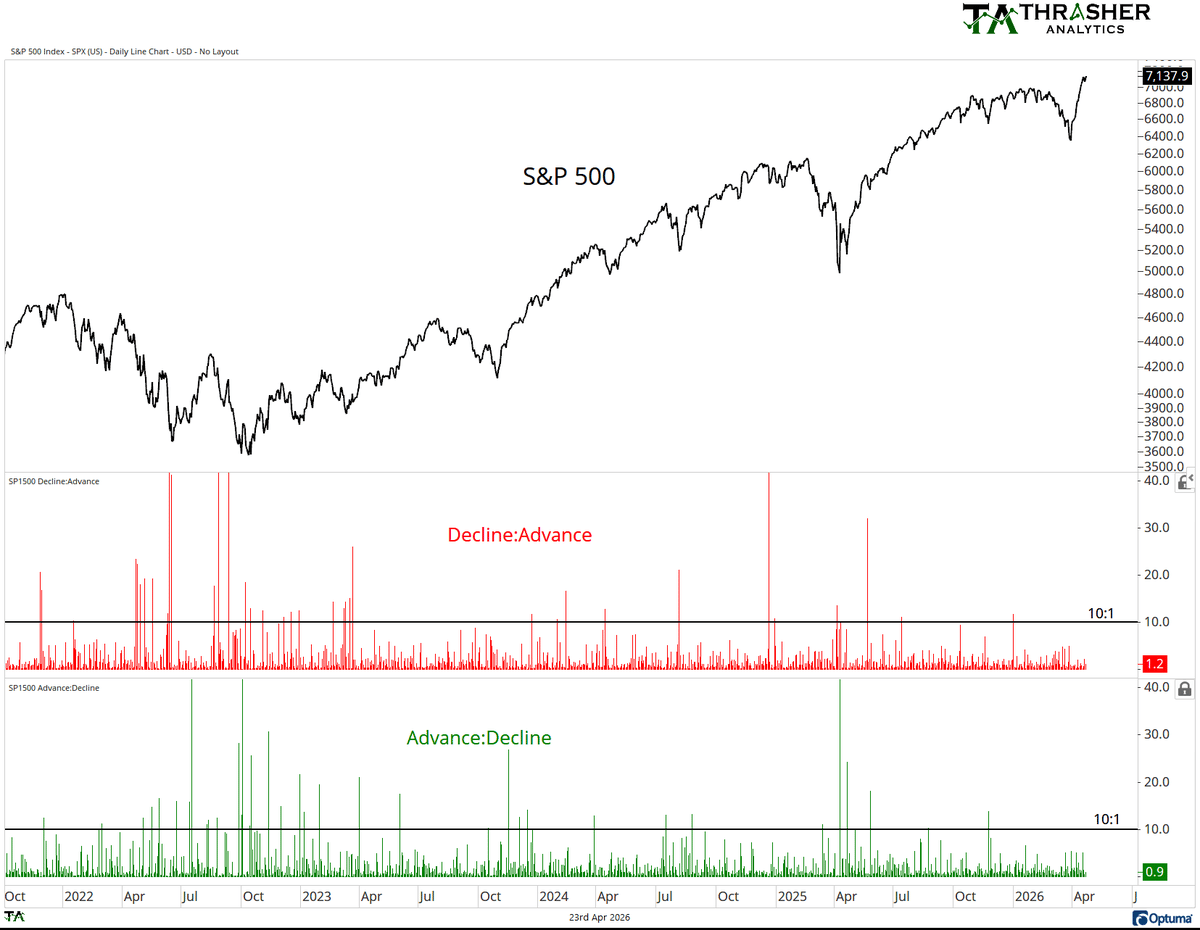
2026 Market Breadth Stays Calm, No Major Moves
2026 has yet to see any major Advance or Decline moves as measured by 10:1 days. All considered, markets have remained fairly calm from a broad breadth perspective. https://t.co/V1JoXj6fXz
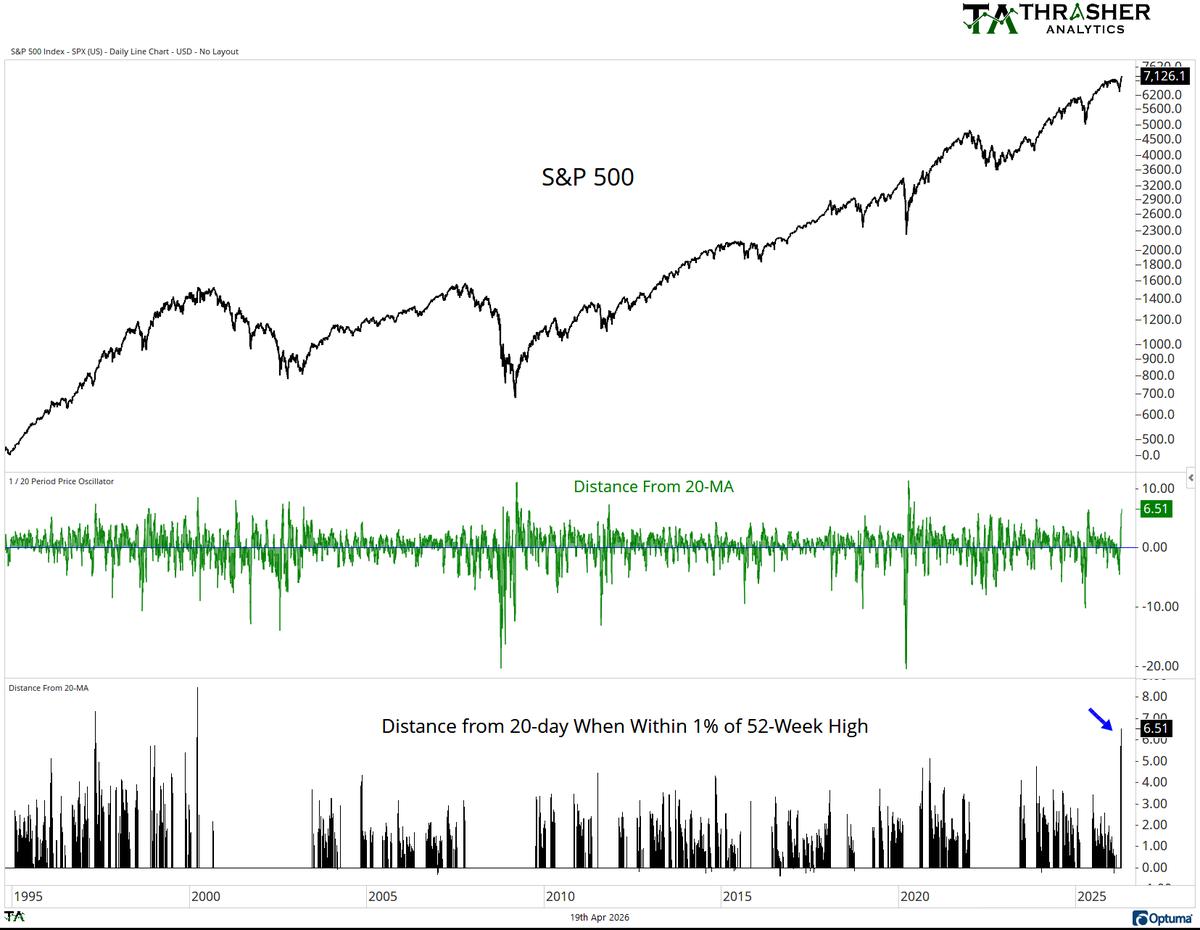
S&P 500 Hits Highest 20‑Day MA Gap Since 2000
A chart from Sunday's Thrasher Analytics note... The S&P 500 was 6.5% above its 20-day MA, the highest it's been above the short-term average since March 2000 when filtered for periods within 1% of a 52-week high, meaning not within a...

SpotGamma’s Early Alerts Navigated Q1 2026 Market Turbulence
Q1 2026 was turbulent. How did SpotGamma support subscribers through the craziness? ✓ Jan: Flagged a "window of weakness" post-OPEX — S&P dropped 2% the next session ✓ Feb: Called SPX 6,900 as key risk pivot — vol spiked for 3 days...
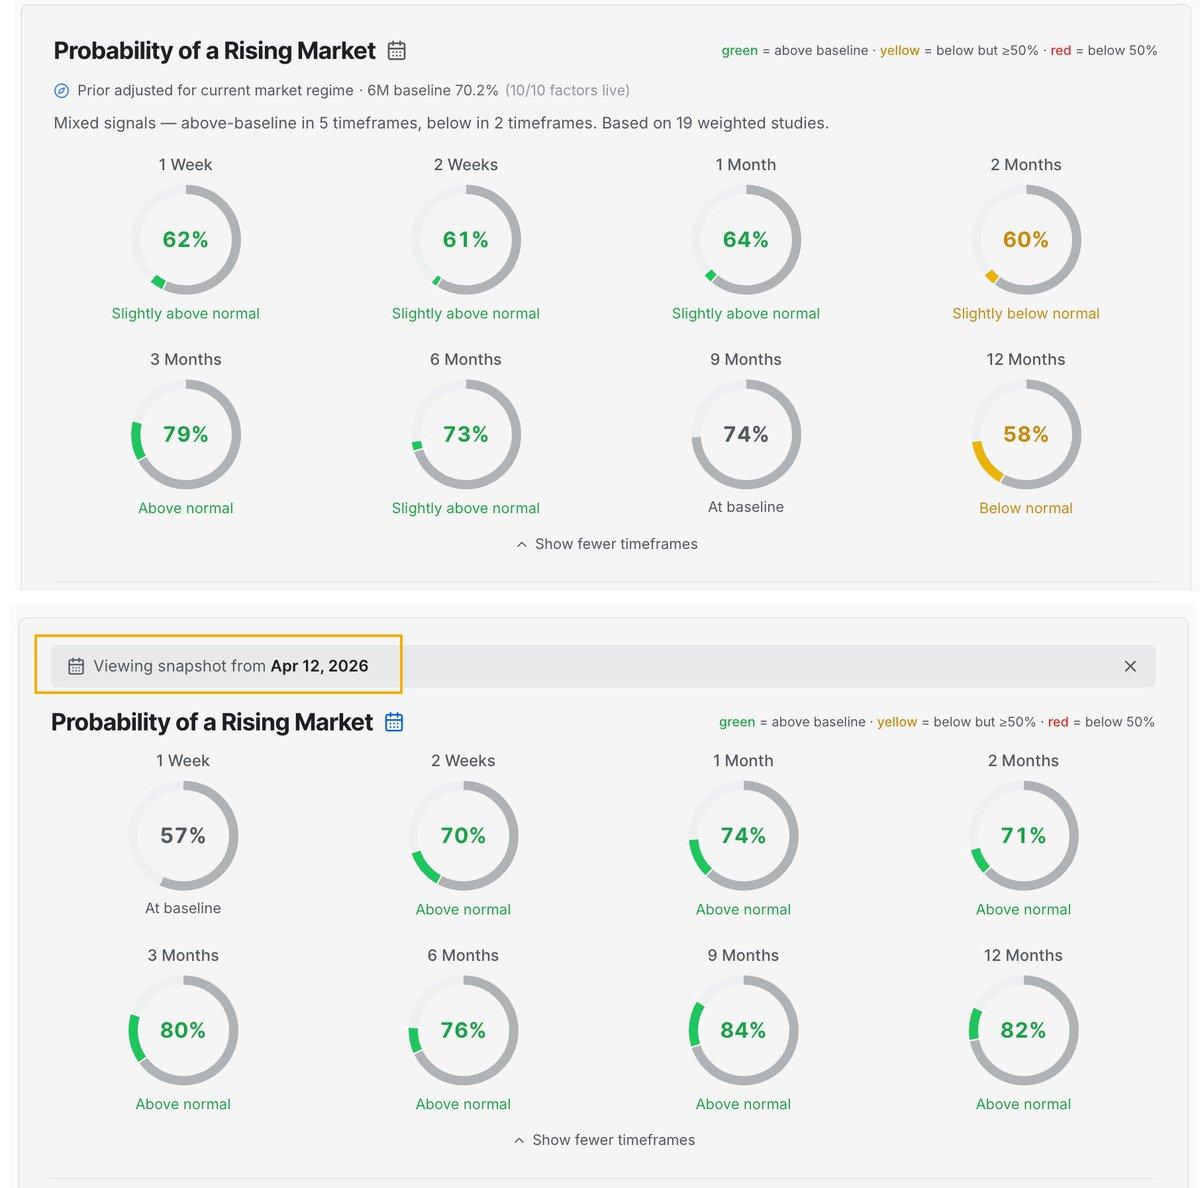
Bullish Odds Slip: 58% Chance S&P Rise
Probabilities are becoming less favorable for bulls. Roughly a 58% chance for a higher S&P 500 a year from now, down from 82% a little over a week ago. https://t.co/IpLeBfyhKL
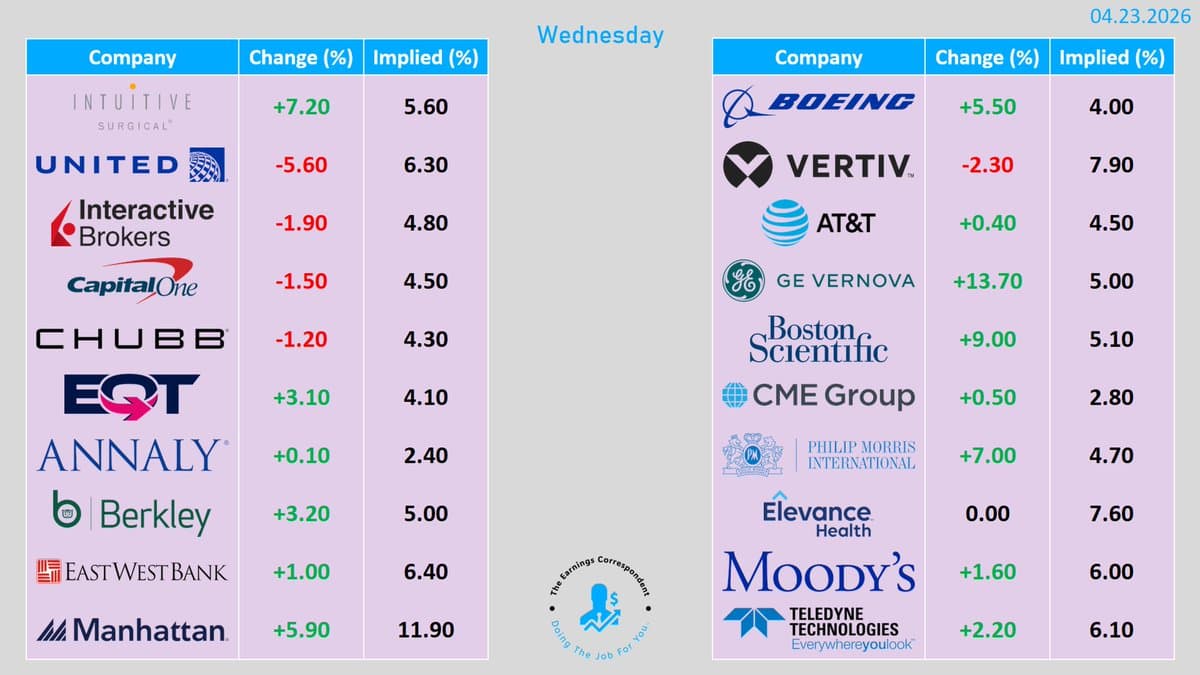
Yesterday's Performance Snapshot of Major Reporting Stocks
This is how the stocks of the reporting companies performed yesterday: $ISRG $UAL $IBKR $COF $CB $EQT $NLY $WRB $EWBC $MANH $BA $VRT $T $GEV $BSX $CME $PM $ELV $MCO $TDY https://t.co/gQAiiCdStw
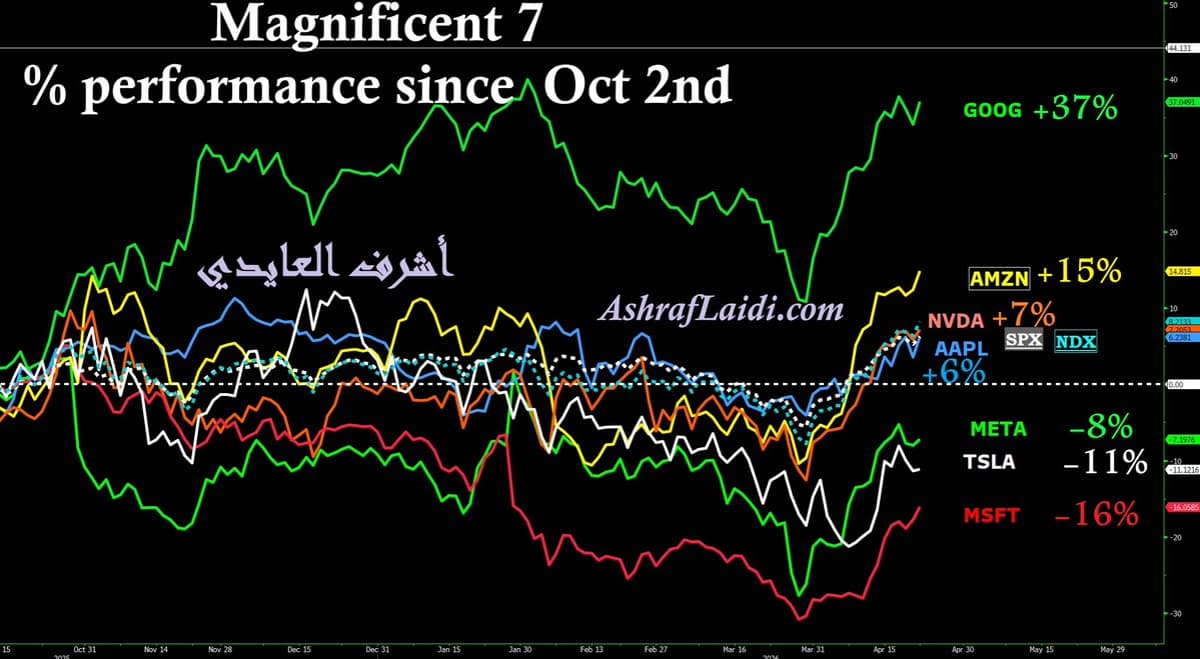
Google Leads Magnificent7 as Nasdaq Climbs 18%
Despite 18% jump in #Nasdaq100 no #Magnificent7 stock regained its record. $AMZN is closest to doing so, but $GOOGL remains by far the highest performer since last autumn, +37% vs 15% , 7% and 6% for $AMZN , $NVDA &...

Software Weakness Drives Pullback, SPY Support Holds
📺 THIS PULLBACK IS ABOUT SOFTWARE, NOT THE MARKET The market is opening lower today, led by weakness in software $IGV. Despite that, the pullback in $SPY is relatively small. Yesterday’s gap has already been filled, which resets the chart and removes...
Market Rally Drives Bullish Sentiment to January Highs
From Peter Boockvar @pboockvar "Nothing like a stock market rally to lift sentiment as mood always follows price. In the most fickle and volatile sentiment survey, the AAII retail one today saw Bulls jump by 14.3 pts to 46, the...

Tesla Earnings Preview Leads Pre‑market Focus
📊 Pre-Market Brief | Thu, Apr 23 ─────── 📅 MACRO DATA Nothing today ─────── 💰 MAG 7 EARNINGS TSLA Wednesday Est 0.35 🏛️ FED No Fed speakers today ─────── 🎬 Trade it live 9am NY: https://t.co/66dSROeuCi
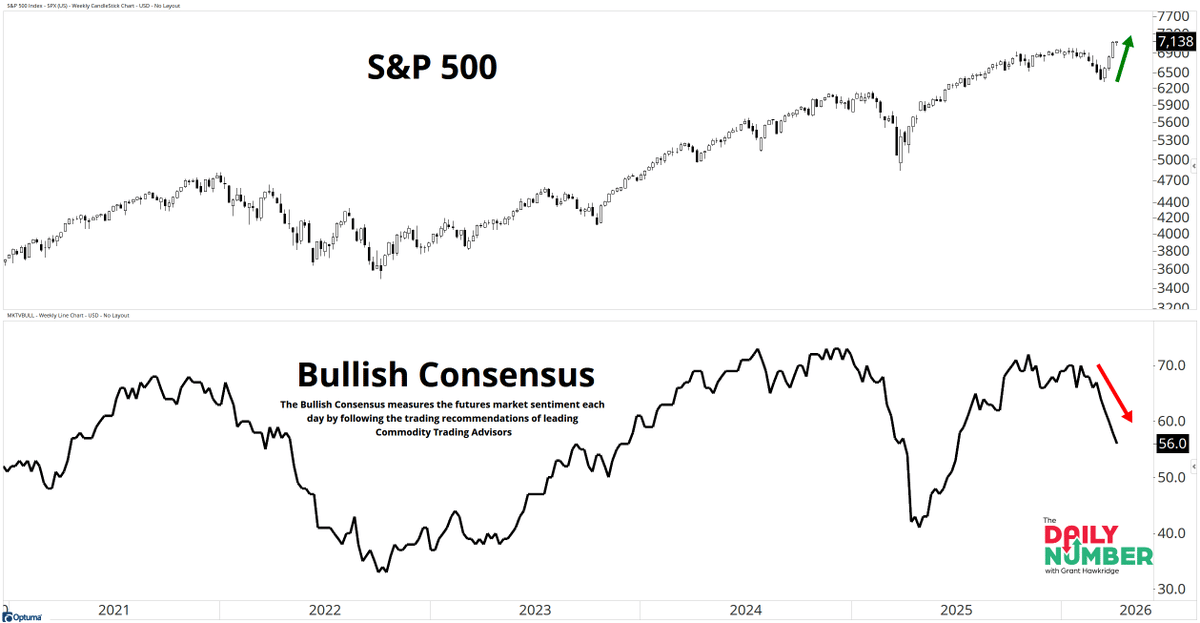
Markets at All‑Time Highs, Crowd Misreads Pullback
Stocks ripping to highs... and the crowd is clueless. Bullish Consensus is in the middle while the S&P 500 prints all-time highs.... The crowd is waiting for another pullback that isn’t coming. Are you following price, or them? 👉 https://t.co/dxD8qHBlrB https://t.co/bHh3Rlvvqs
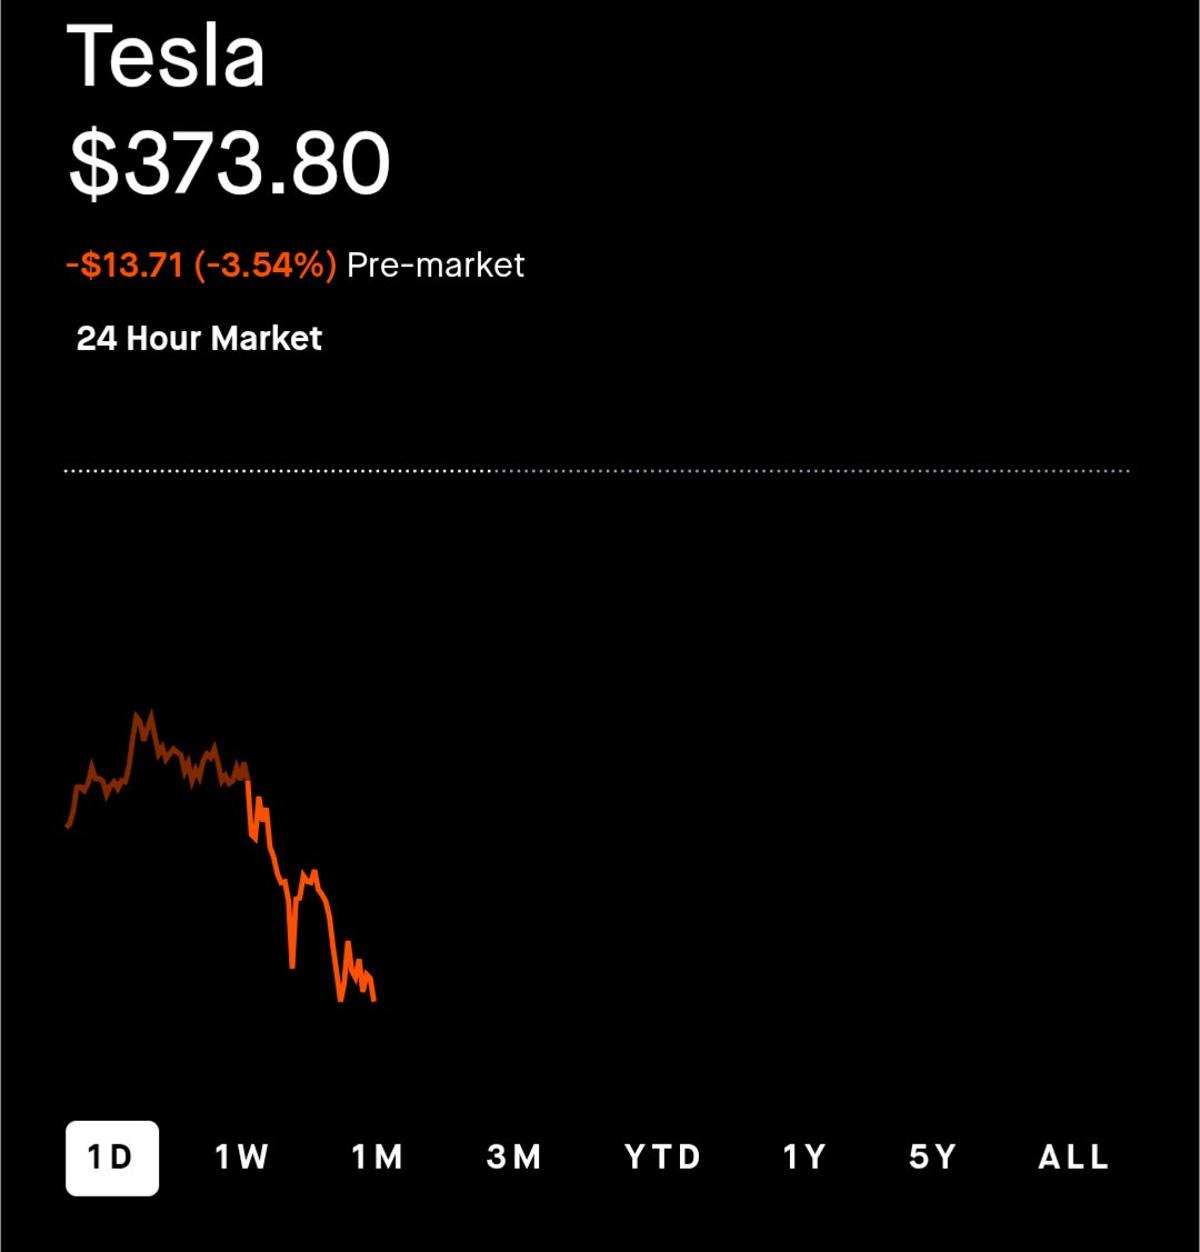
Tesla Spikes 5% on Earnings, Then Slides 8%
$TSLA pumped 5% on earnings yesterday to over $400 and now it's down 4% pre market (8% from the highs) Brutal price action https://t.co/lskX5iVwAN
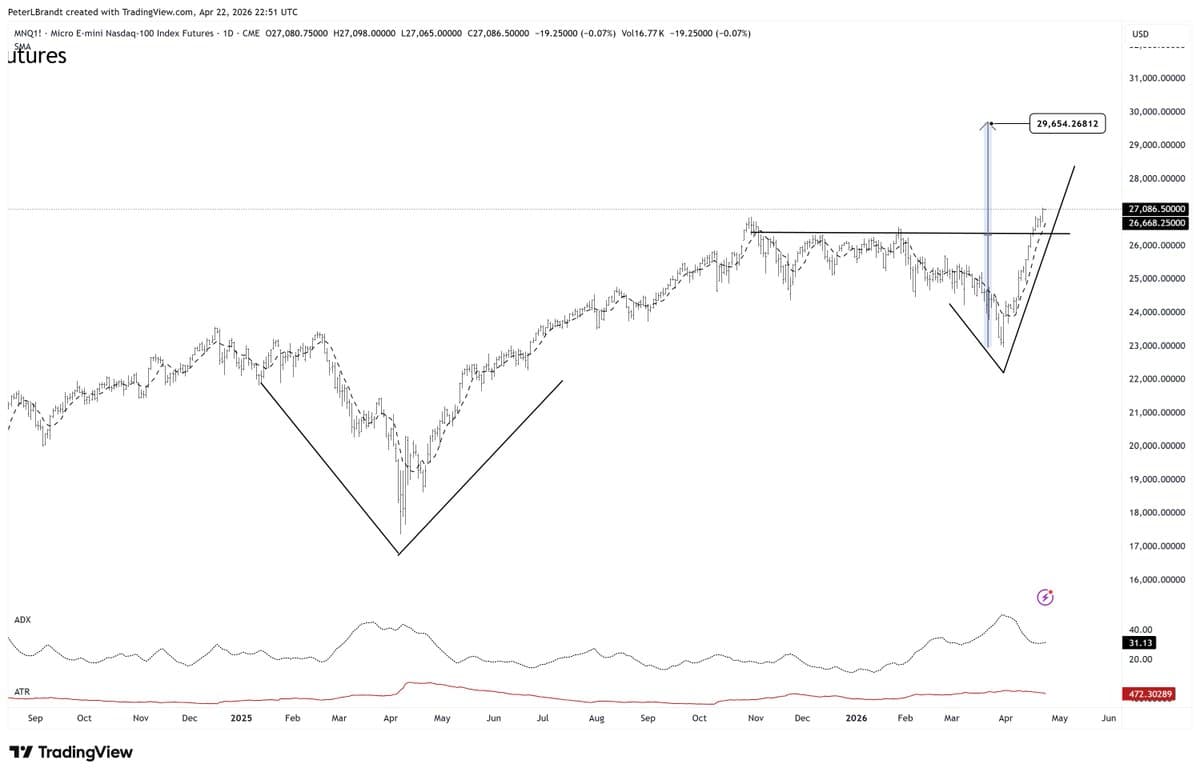
Second V‑Extended Bottom Signals NASDAQ Surge to 29,600
V-extended bottoms are very rare, but they do occur. In fact, this is the second "V"-extended bottom in the NASDAQ in the past year. Now, that is rare. It portends higher prices with an initial target of 29,600 $NQ_F https://t.co/2qSB0vKXhk
IBM Beats Earnings Yet Stock Falls, Mainframe Soars
Headline says it all. “ $IBM Stock Slides Late Despite Earnings Beating Expectations” It’s silly season, it seems. Triple beat. - Software +11% - RedHat +13% - Data +19% - Z Mainframe +48% (remember Feb 23 AI was going to kill COBOL...