SOX at 60× P/E: Euphoric, Limited Upside
SOX index at 60x P/E is what you would call ‘euphoric’ or ‘priced to perfection’. Market doesn’t care to consider the alternative, yet, but that also doesn’t give it a lot of upside room - outside of a meltup ala 2000.
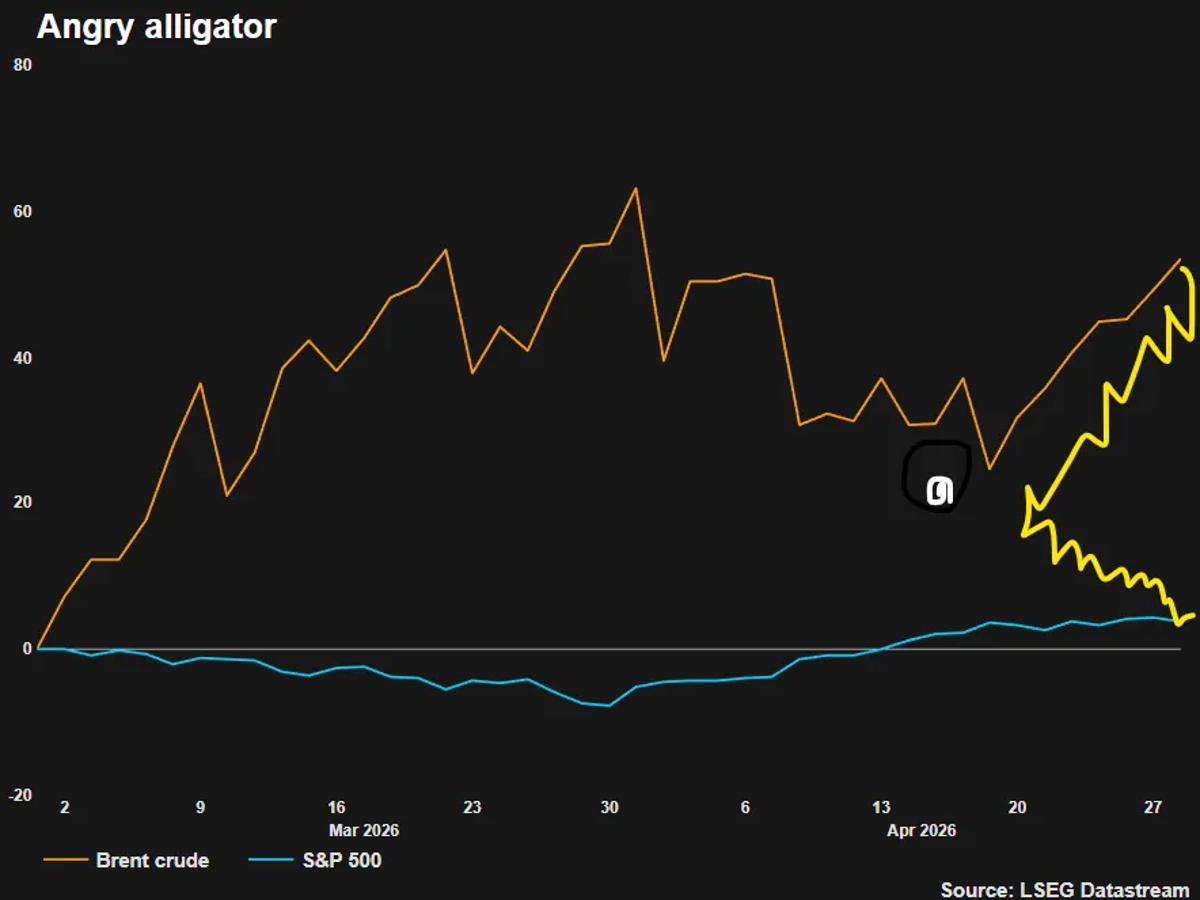
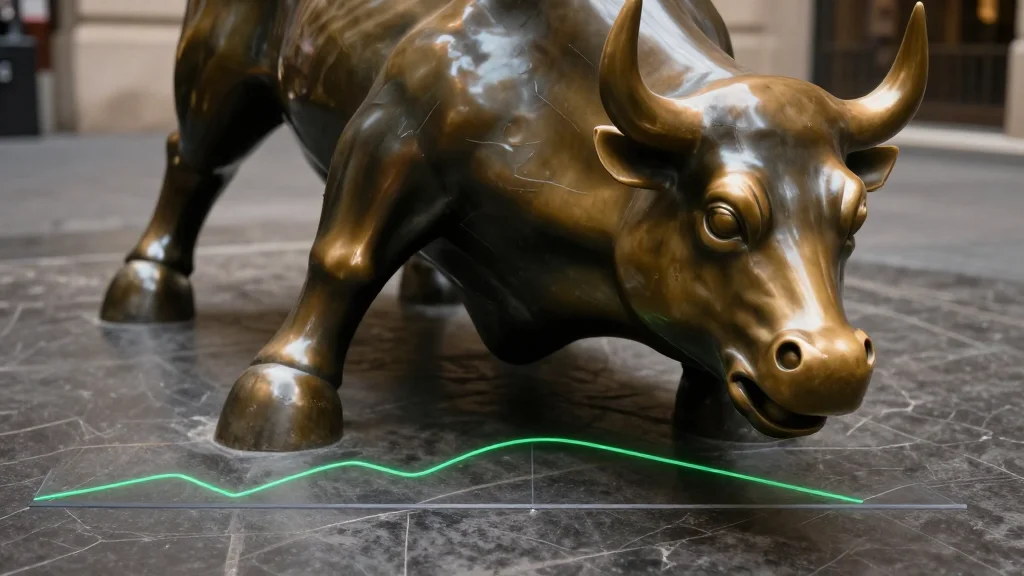
Equities and Oil Form Angry Alligator Pattern
Equities and oil making the well-known Angry Alligator technical pattern. (rebased from the start of the U.S.-Iran conflict) $SPX $SPY $VIX $USO https://t.co/kt1phTUNoS
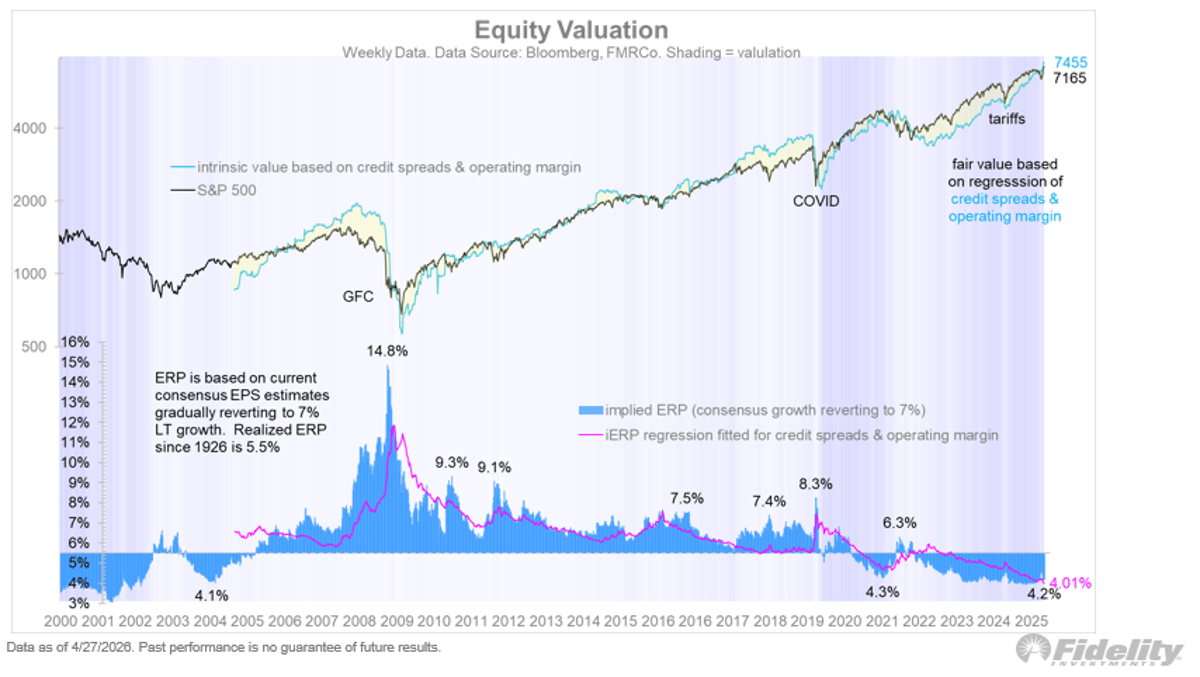
Equity Risk Premium at 4%, S&P Fair Value 7,455
While valuations in the US remain a concern for many investors, in my view they are justified by the macro fundamentals of all-time high (and rising) margins and tight credit spreads. Those two variables are the independent variables in my...
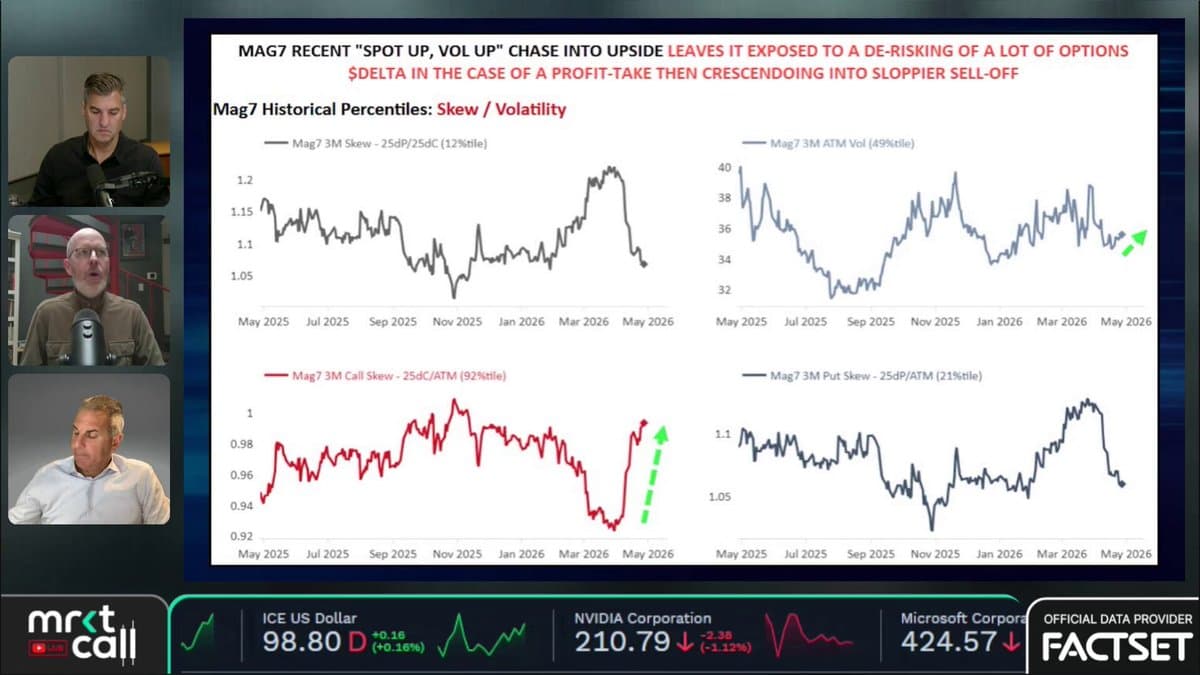
Options Market Shows Bigger Picture Beyond Tariffs, Iran
Tariffs. Iran. Parabolic price action. Each one looked like a big deal in the moment, but zoom out and the chart tells a different story. Kevin Davitt, Head of Index Options Content @Nasdaq, joined Dan & @GuyAdami to break down what the options...

SPX Hits New Highs While Dow Stalls Below Bondi Top
Pointing out that in spite of the SPX making new highs, the Dow has still not taken out the PAM BONDI TOP
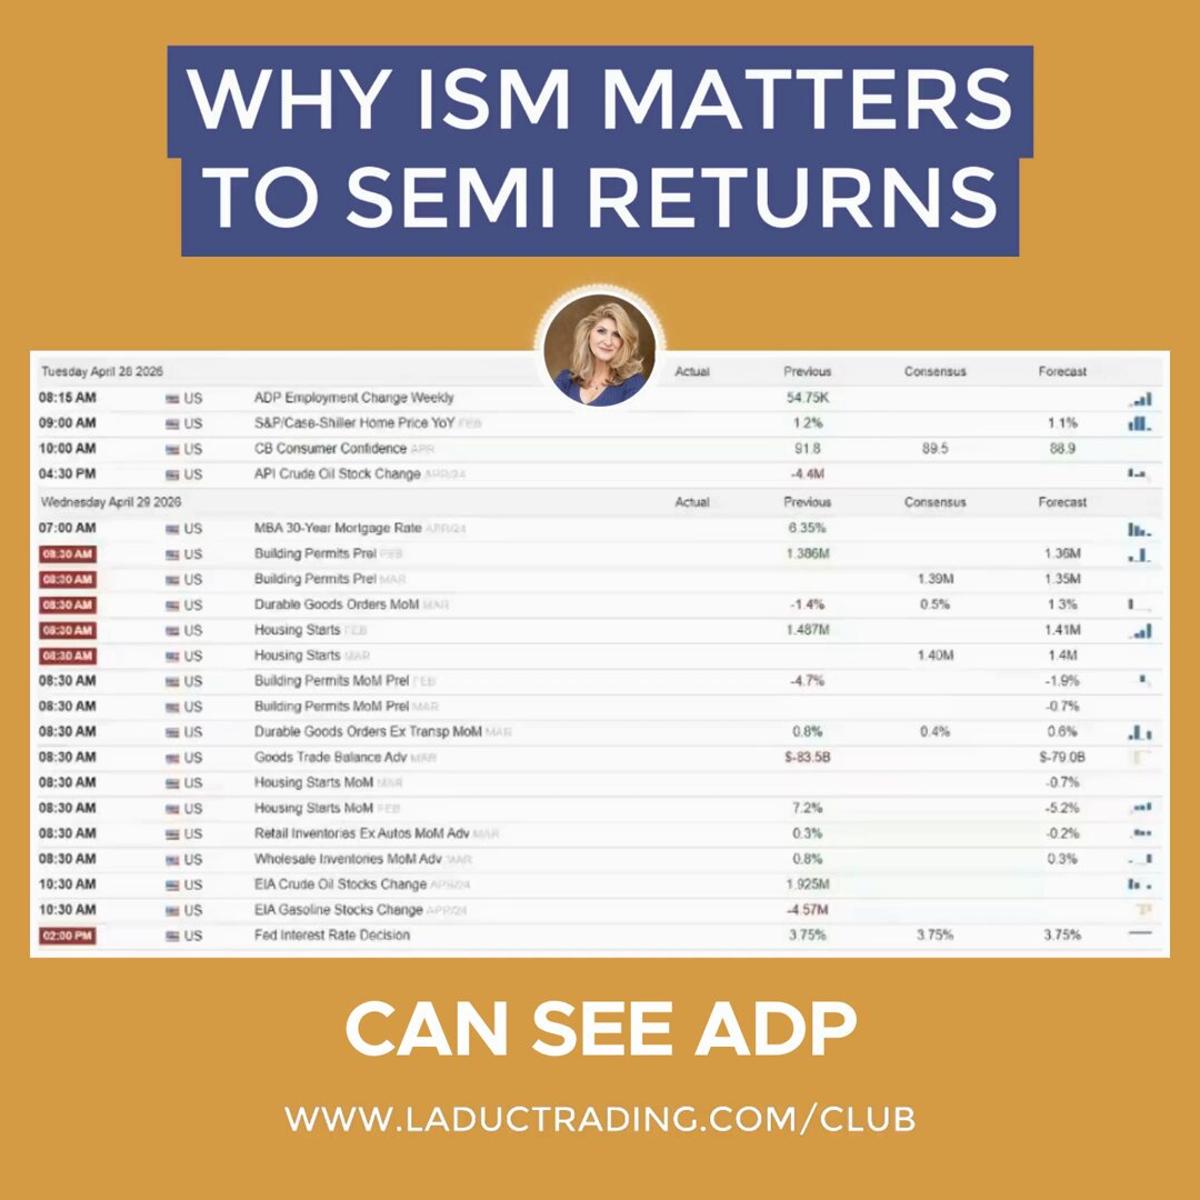
ISM Data Could Pivot Semiconductor Rally and AI Capex
ISM Thursday... Why it could matter to semi returns $SMH sentiment & fundamentals as driver to market’s bullish momentum & AI capex cycle should show in ISM manufacturing. If it doesn't... rotation into defensives can trigger exposing the fragile upside to markets....

Market Misreads Risk, Tail Lies in 4pm AMC Tape
Today is the most asymmetric single trading day of Q2. In nine hours, four mega-caps representing $10.5 trillion of market cap report (GOOGL, MSFT, META, AMZN — all AMC), Jerome Powell delivers his final FOMC presser as Chair, and the...
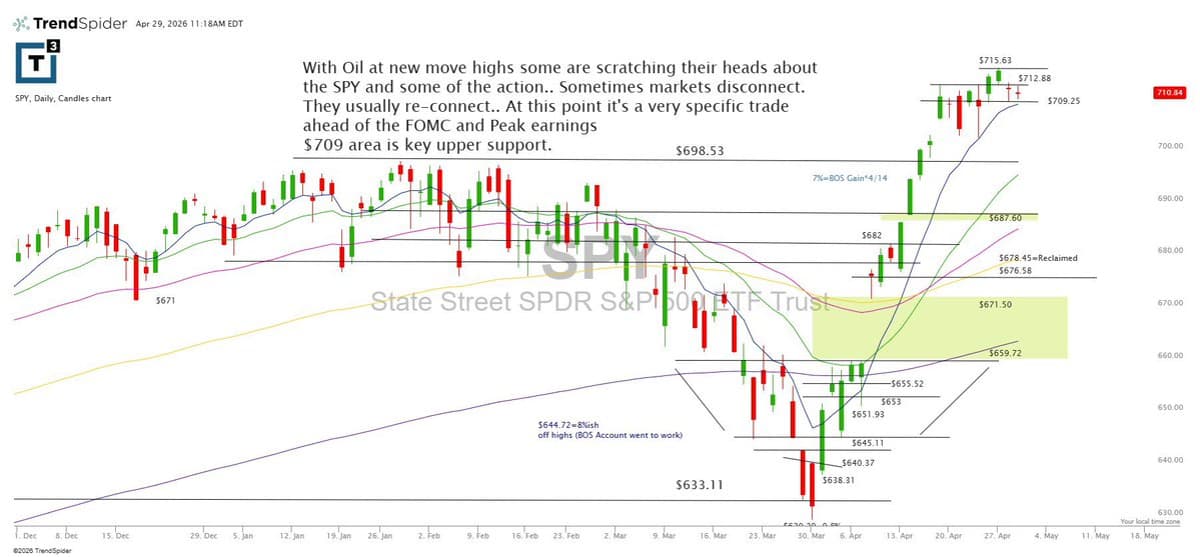
Stocks Digest Oil's New Highs, SPY Stalls
$spy morning glance as indices and stocks try and digest new move highs in OIL https://t.co/ywBD1SxyHC

AI-Linked Firms Now Represent Nearly Half of US Market
"AI-linked companies, from “hyperscalers” to chip makers and power providers, already make up about 45% of the U.S. stock market" --@Spencerjakab https://t.co/iiypmMavNI
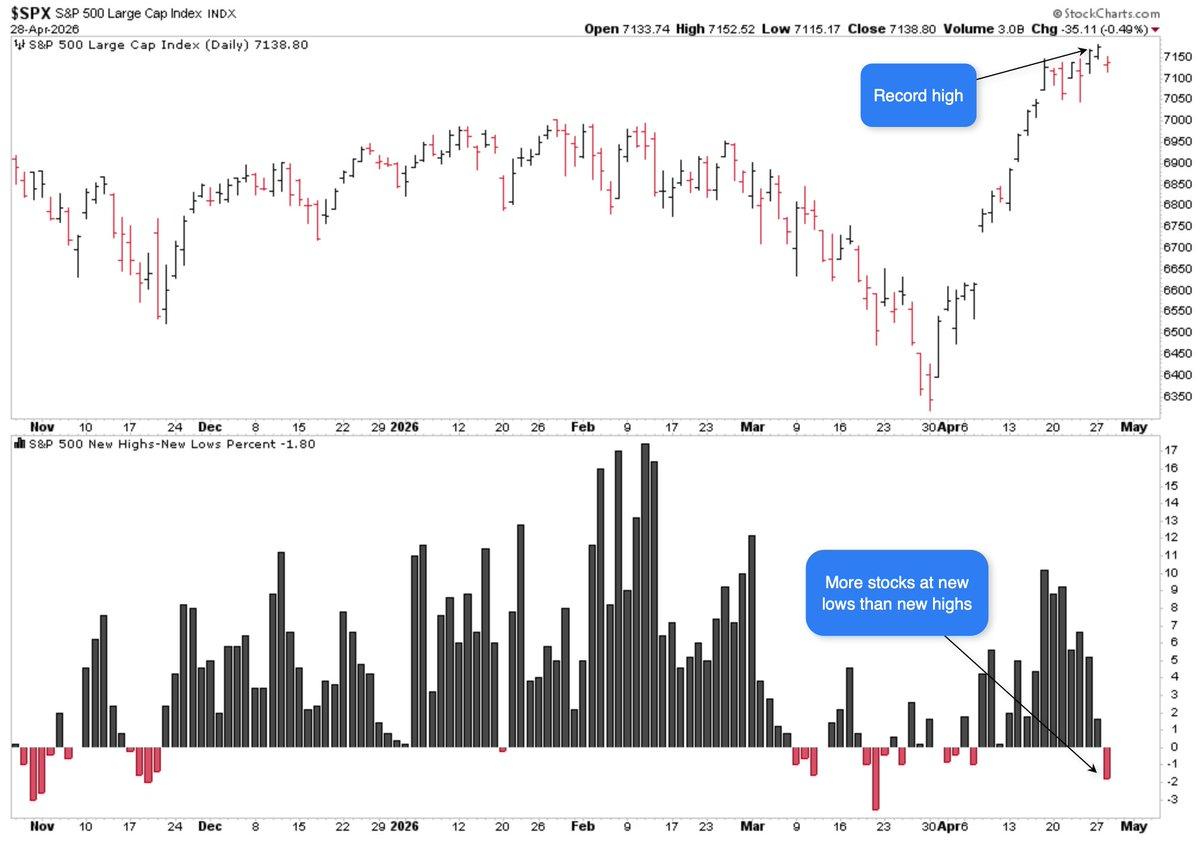
Rare Market Divergence: More Lows Than Highs After Record S&P
On Monday, the S&P 500 $SPY closed at a record high. The next day, at least 1% more stocks hit a 52-week low than a 52-week high. In 70+ years of history, that's happened twice. Yesterday was one. January 3, 2000 was...
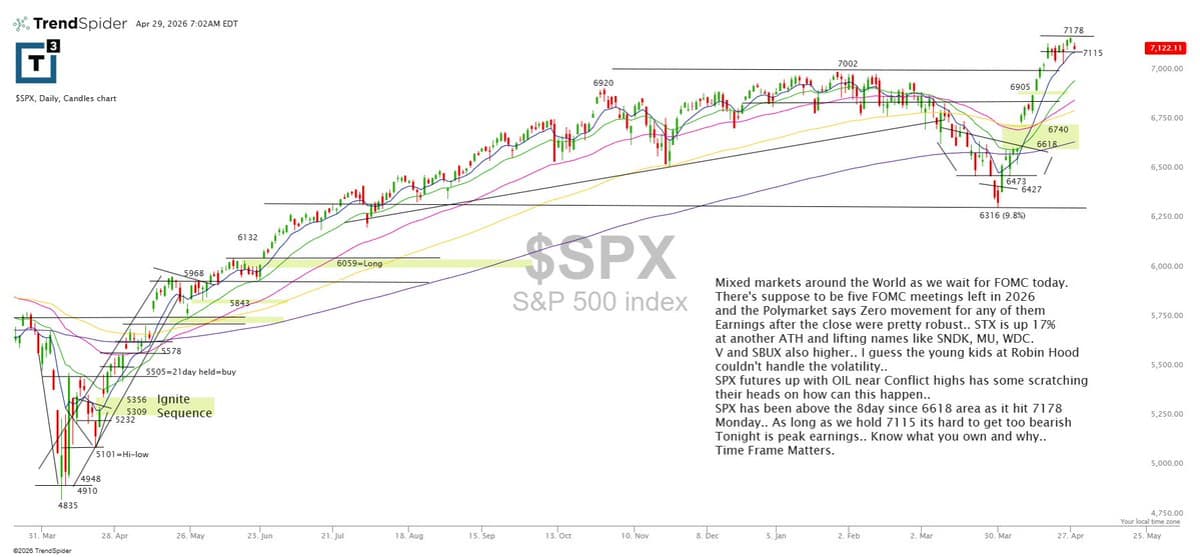
Tech Earnings Lift Markets as FOMC Approaches
Markets are mixed ahead of today's #FOMC. Prediction markets see zero movement for the remaining 2026 meetings. Strong earnings are lifting tech, with $STX hitting new highs and boosting S&P names. Tonight marks peak earnings-know what you own. https://t.co/xVYU4GfNBQ

AI Capex Gains Matter Only When Revenue Follows
Earnmaggedon tonight: Microsoft Alphabet Amazon Meta all report within minutes of each other after the closing bell. AI capex is only bullish if it’s translating into real, measurable revenue and higher forward guidance. Brace.

Live on Fox Business: Oil, Tech Earnings, Market Outlook
I'll be on with Cheryl Casone today at @FoxBusiness live at HQ around 8:20 am EST talking Oil, Tech Earnings, markets and what's in store for the days ahead

Tech Earnings Set to Outpace Fed Decision Impact
🚨TODAY: FOMC VS. TECH EARNINGS 🍿 *My money is on earnings = bigger mover 2:00PM: Fed Rate Decision 2:30PM: Powell's last press conference as Fed Chairman Earnings: 4:00PM: $GOOGL $META $AMZN 4:05PM: $META https://t.co/MHymxCHk0O
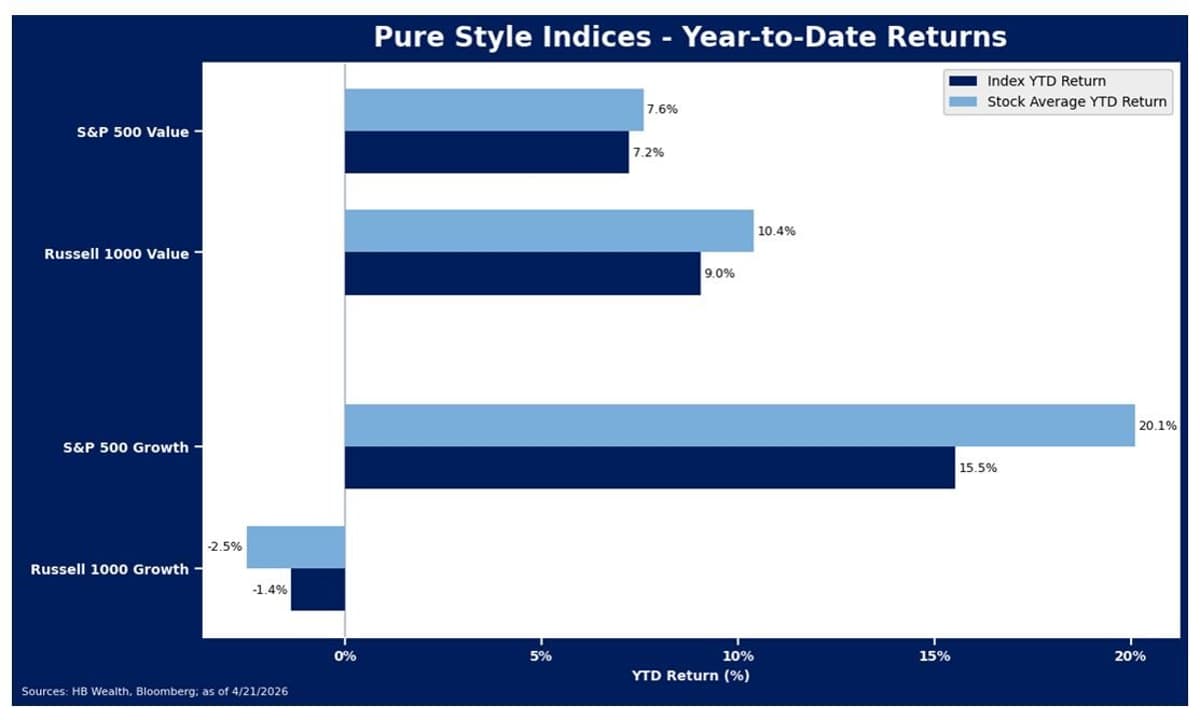
Growth's Rally Powered by Mega‑Caps, Broad Value Outperforms
The largest of large cap growth stocks have roared back from late-March lows as investors have gravitated back to perennial favorites on the presumption that recovery from war-time strain may prove similar to recovery from tariff-policy stress. However, there is...
Oil Jumps 3.5% as Markets Stay Flat
$SPY +0.1% $QQQ +0.4% $SMH +0.9% $IWM +0.1% $EEM +0.5% $TLT -0.2% $USO +3.5% $IBIT +1.0% $GLD -0.4% @finviz_com https://t.co/opW23XtMOB
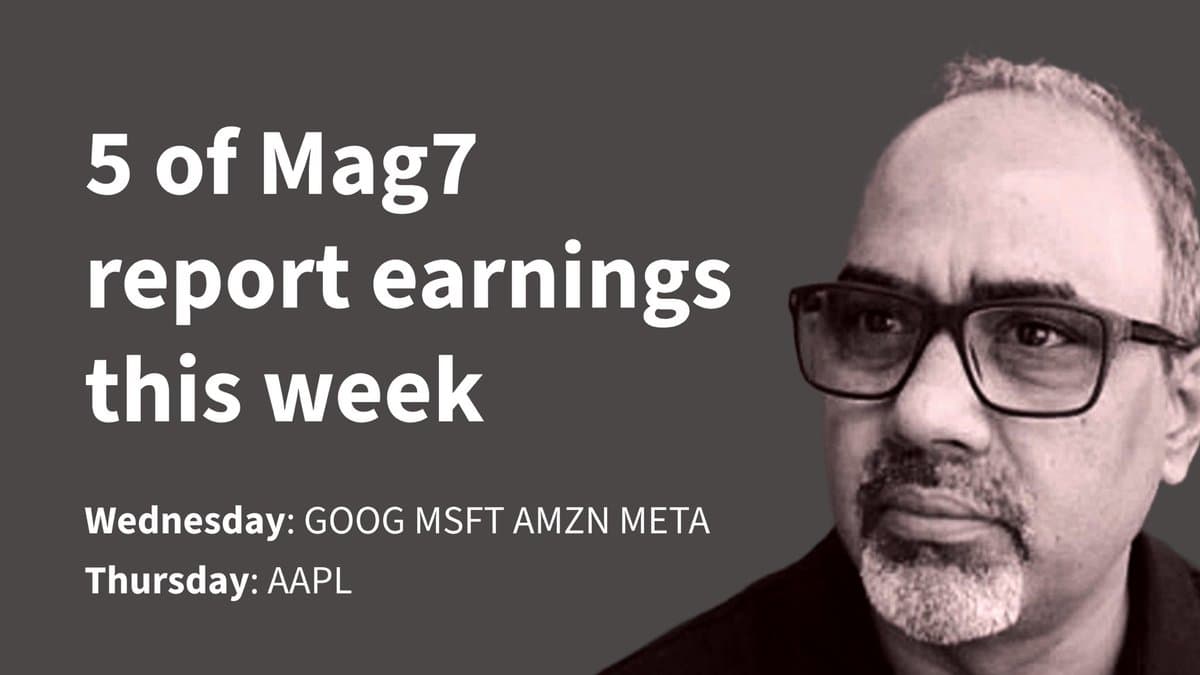
Big Tech Earnings Surge: Google, Microsoft, Amazon, Meta, Apple Report
Are you ready for tomorrow? Five of Mag7 (and 5 of top 10 companies by market cap) report earnings this week, on Wednesday it’s @Google @Microsoft @Amazon and @Meta — on Thursday it’s @Apple https://t.co/QWVcAVXzNW
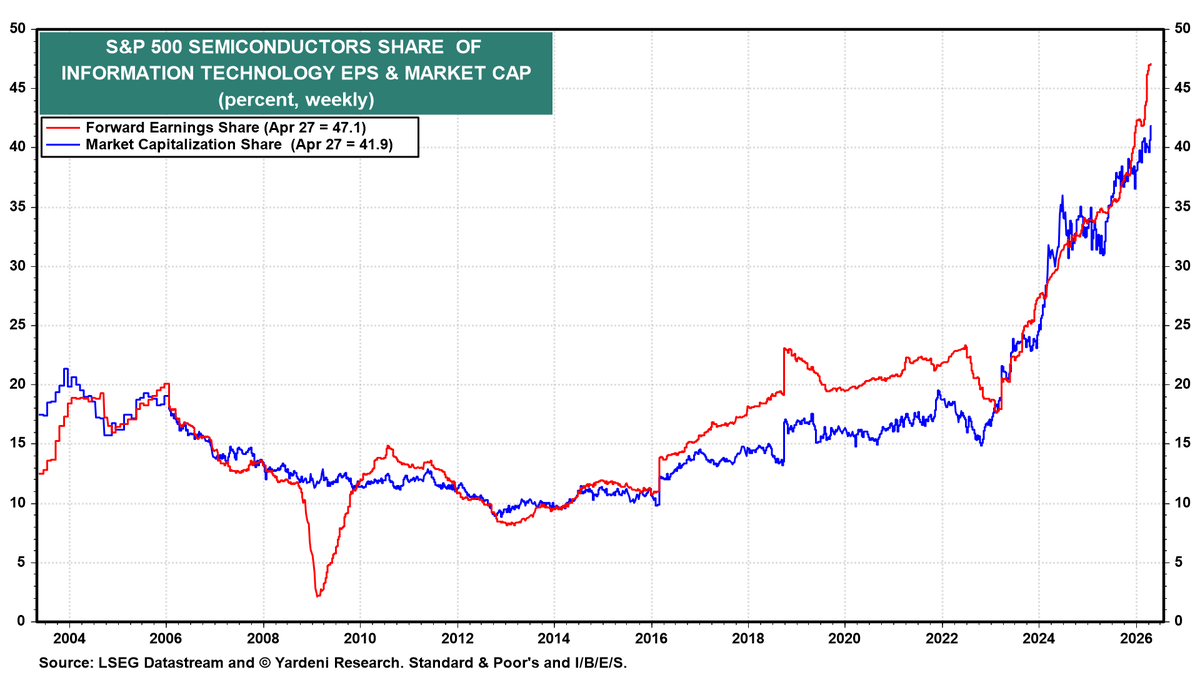
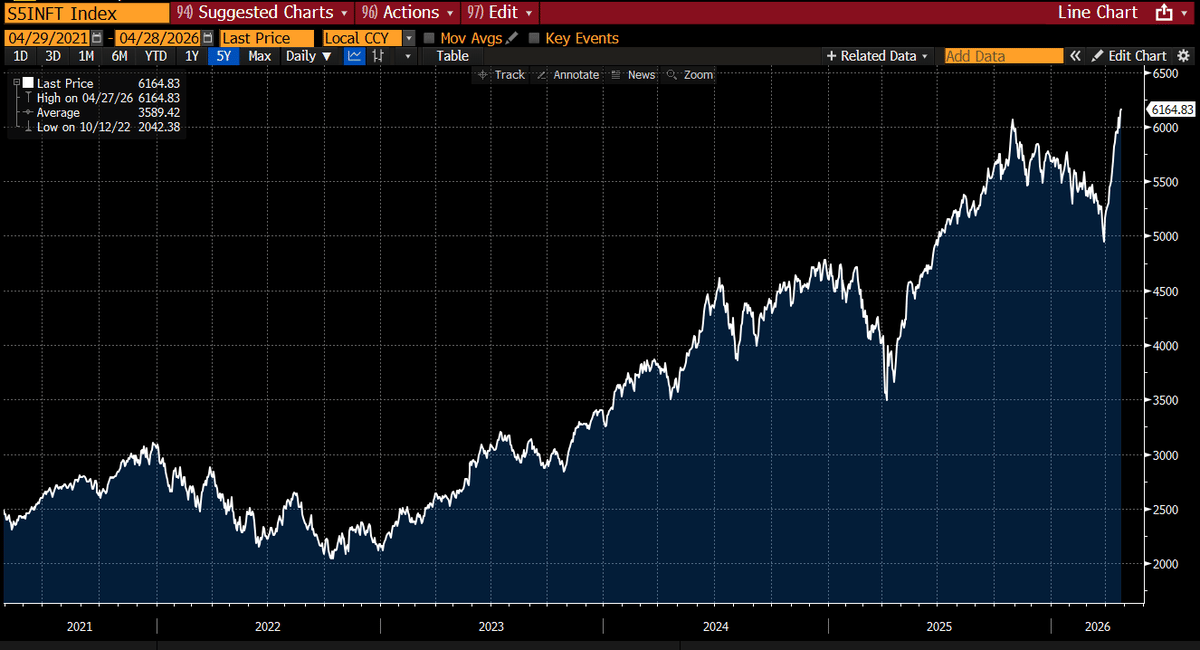
Semiconductors Claim Record Share of S&P 500 IT
Yardeni Research Chart of the Day (April 28, 2026) The S&P 500 Semiconductors industry now accounts for a record 41.9% and 47.1% of the S&P 500 Information Technology sector's market capitalization and forward earnings. Do you think this is sustainable? https://t.co/mmJzuPj5Sb

S&P Slides; Fed Meeting and Mega‑cap Earnings Dominate
MARKET RECAP 📉 S&P 500 fell lower today, but all eyes are on tomorrow 👀 We have the FOMC and potentially Jerome Powell’s last meeting as Fed chair, alongside 4 of the largest 10 companies in the world reporting earnings. Those...
WSJ OpenAI Miss Report Triggers AI Rally Collapse
April 28, 2026 close. The record rally got stopped today, but not by what most people expected. Not by Iran. Not by the Fed. By a single Wall Street Journal story saying OpenAI is missing its own revenue and 1-billion-user...
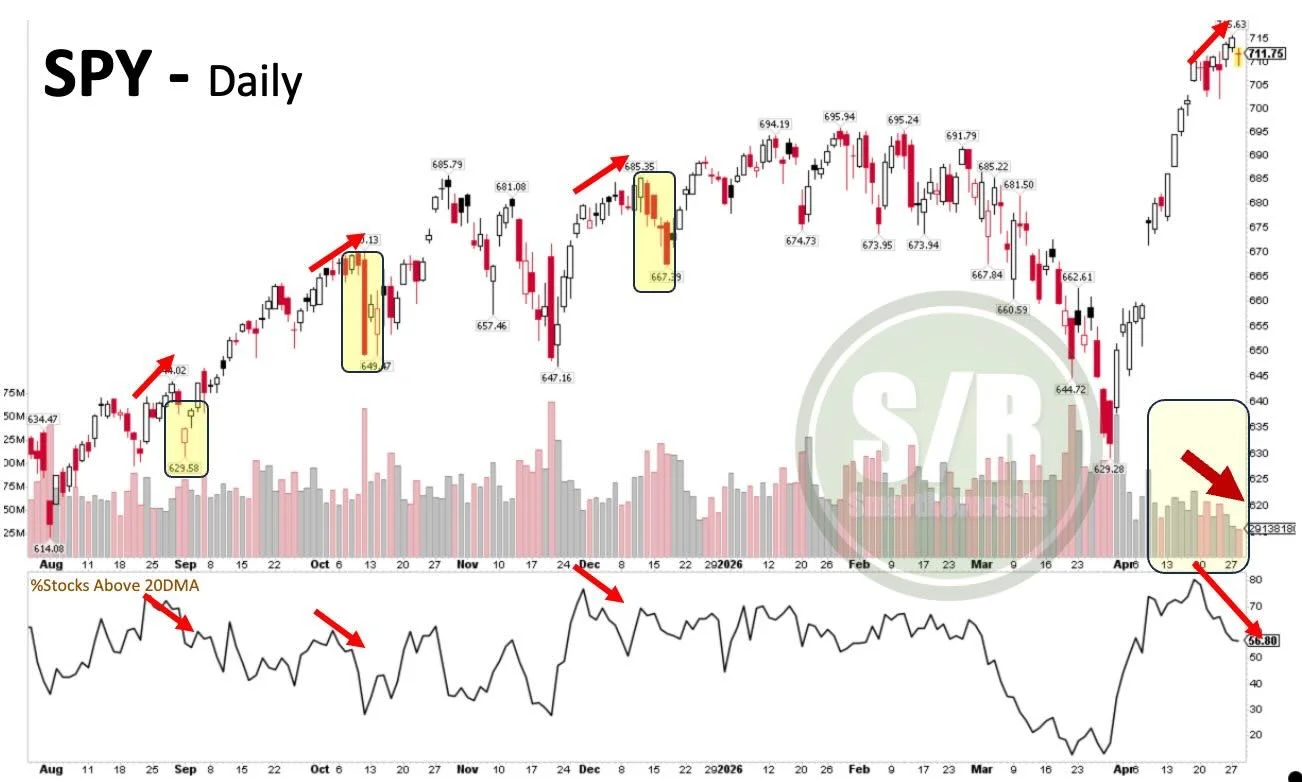
Diminishing Participation Signals Bearish Divergence and Low Volume
SPY: Stock participation has deteriorated over the last days, creating a bearish divergence similar to those that preceded healthy pullbacks last year. What makes this occurrence particularly intriguing is the vanishing volume, adding a layer of divergence and caution. #SPX

Starbucks Lifts Same‑store Sales Target to 5%+
Starbucks raised its expectations for same-store sales this year to 5% or better globally and in the U.S. $SBUX

Starbucks' Top 10 International Markets Finally Post Positive Same‑Store Sales
All 10 of Starbucks' 10 largest international markets generated positive same-store sales for the first time in nine quarters last period. $SBUX

Today's TICK Hits Low -605, High 395: Quiet Market
Low TICK today just -605 and high of 395, one of the quietest days in a long time
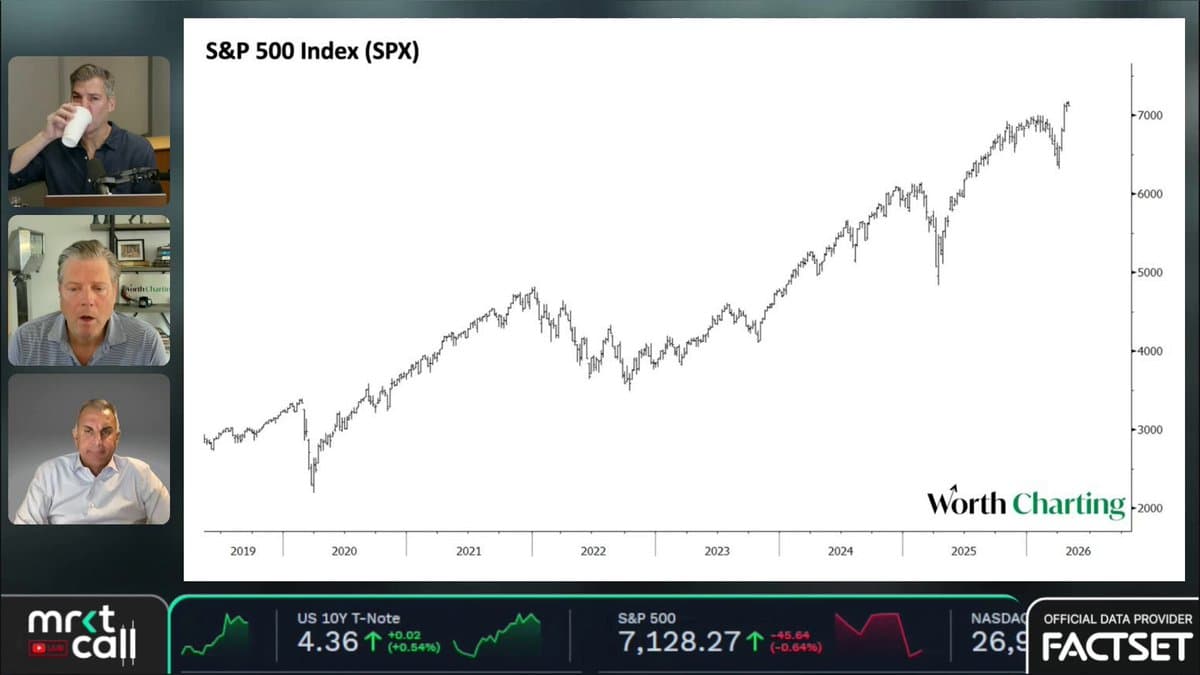
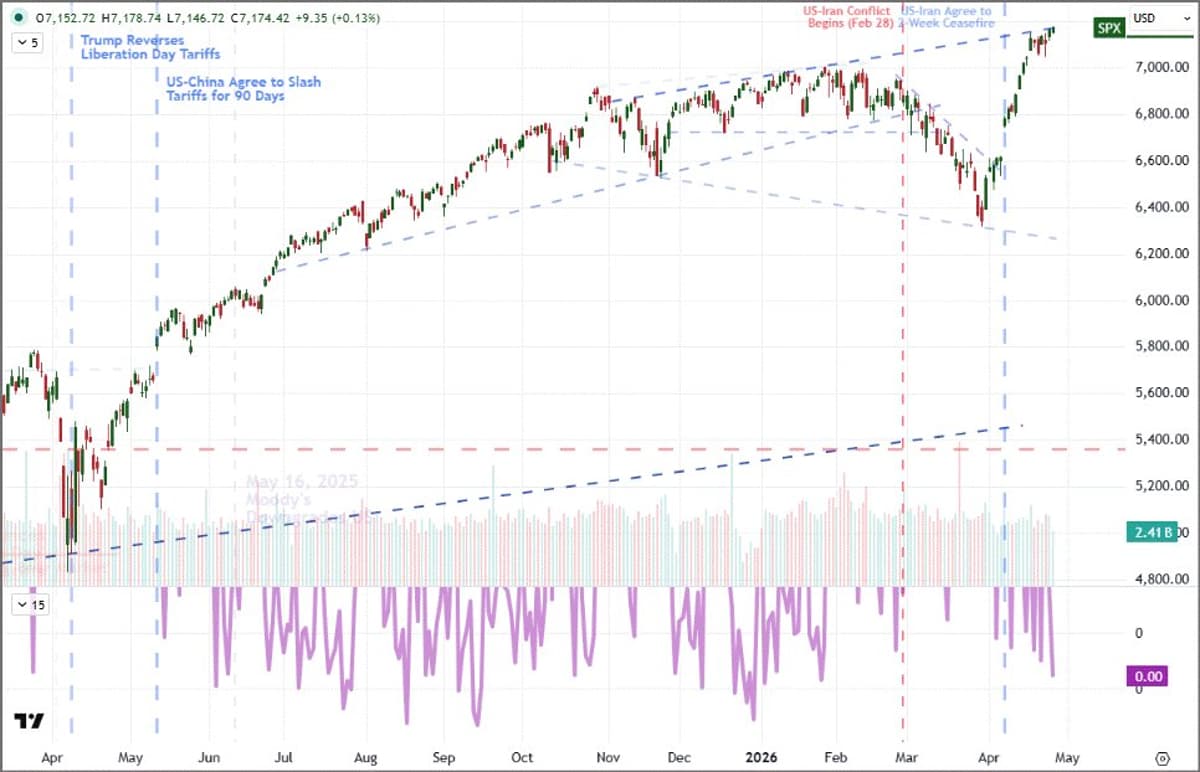
S
The $SPX has basically returned pre-Iran conflict levels. The question is whether or not we'll see more upside from here... @CarterBWorth runs through the technicals with Dan & @GuyAdami on MRKT Call 🎙️ https://t.co/DhyvowxPOq
Earnings Surge Shields Market, Fuels Potential Upside
Booming earnings growth has been a dominant feature of the market’s resilience amid some unsettling geopolitical headlines. Were it not for earnings estimates accelerating to a 20% year-over-year rate, surely the recent 9.8% drawdown would have been closer to the...
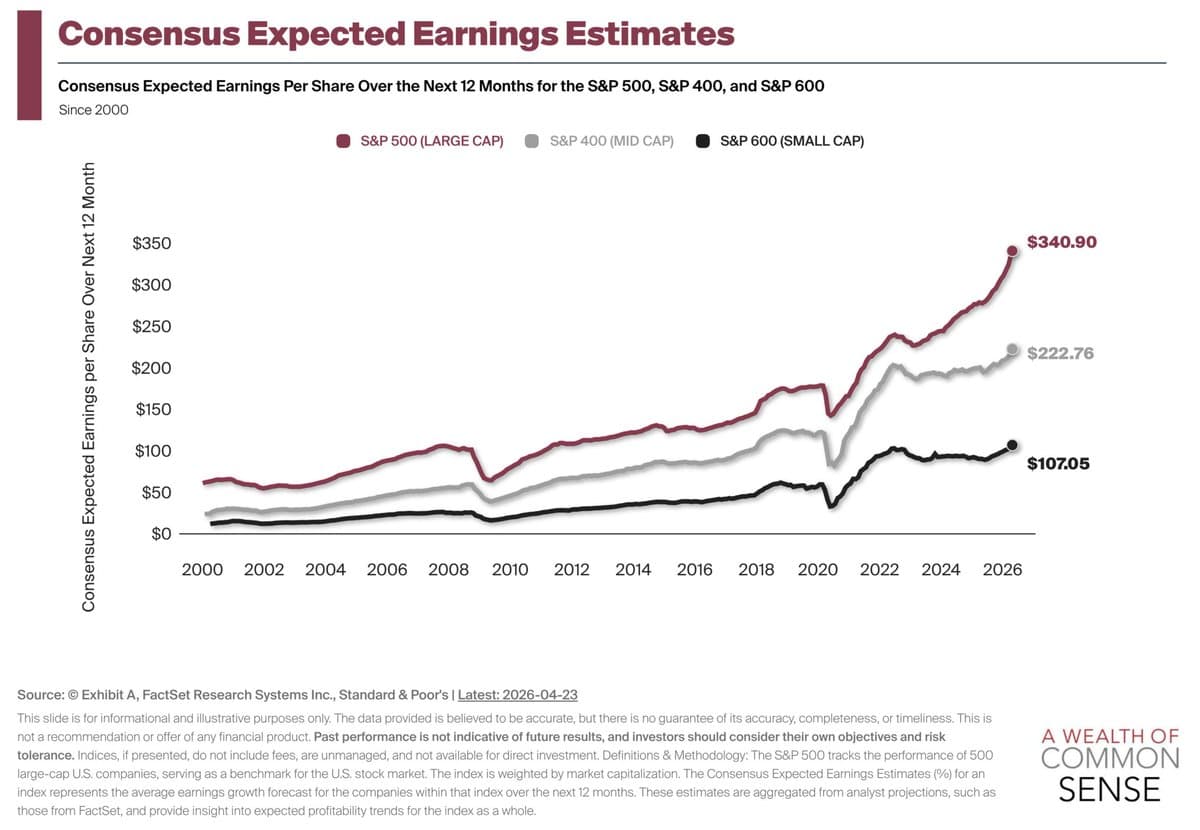
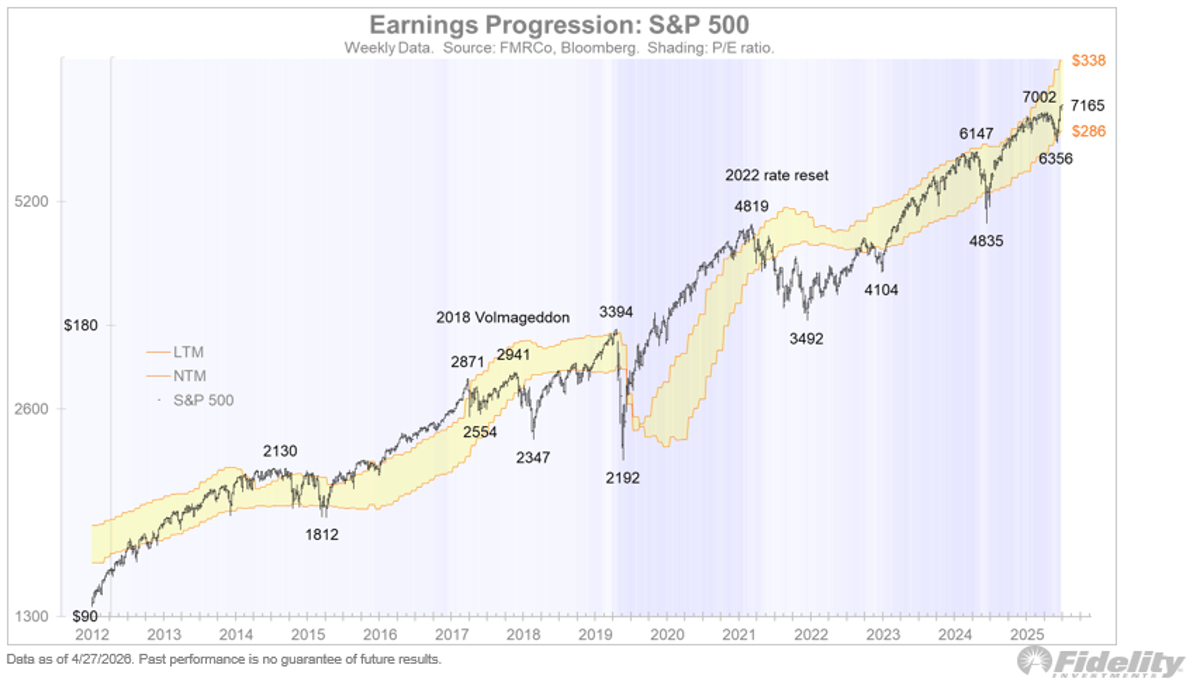
Earnings Power Drives Market to New Highs Amid Conflict
Why didn't the stock market fall further in the face of a war in the Middle East and an oil price spike? Why are we already back at new all-time highs? In a word -- earnings https://t.co/qfWzRKurxU https://t.co/2MrOBldvIL
AMD Slides 9% as OpenAI Misses Revenue Targets
AMD just gave back 9.4% in two sessions, from Friday's $352.99 all-time high to $319.97 this morning. The trigger wasn't AMD itself. It was a Wall Street Journal report that OpenAI quietly missed its own revenue and weekly-active-user targets, and...
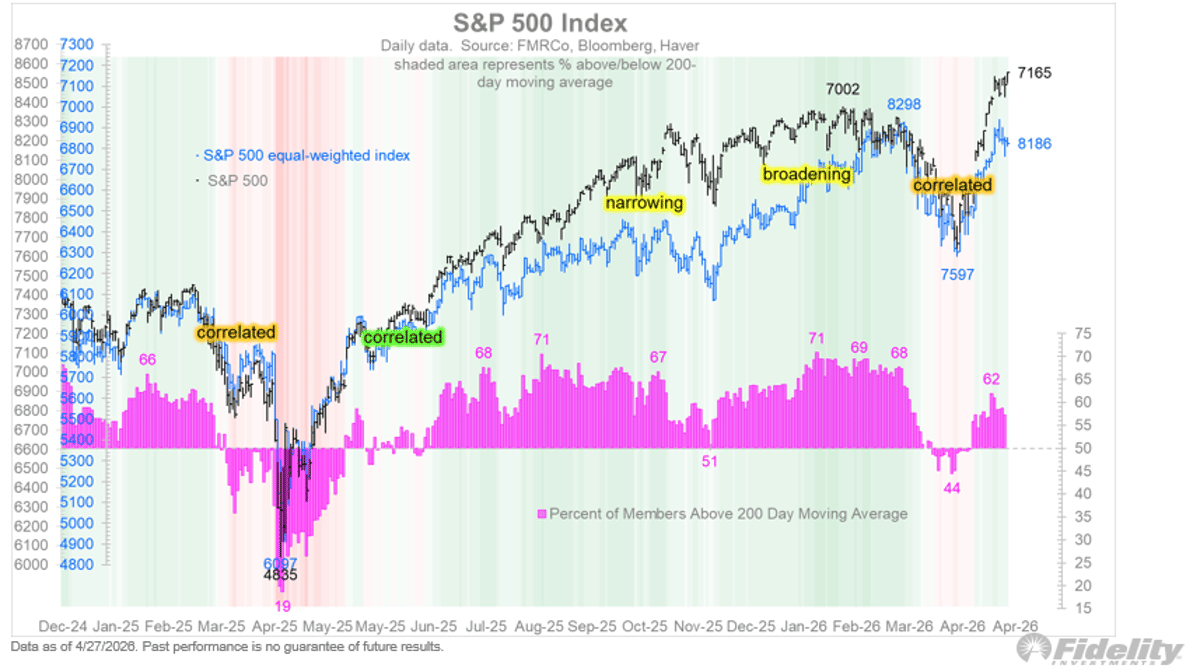
Cap-Weighted Index Outpaces Equal-Weighted, Still Below Jan Highs
While the rally from the March 30th low has been fairly uniform in absolute terms, the cap-weighted index has dominated the equal-weighted index, which remains below its January highs. https://t.co/IIplljdzDN
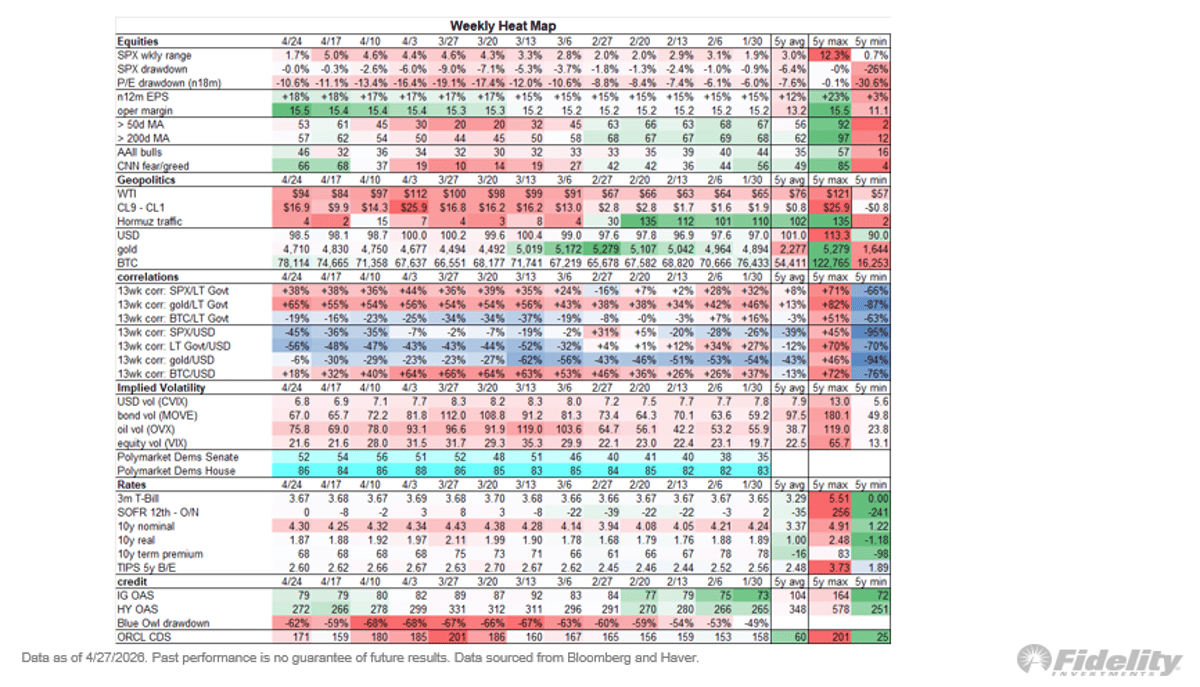
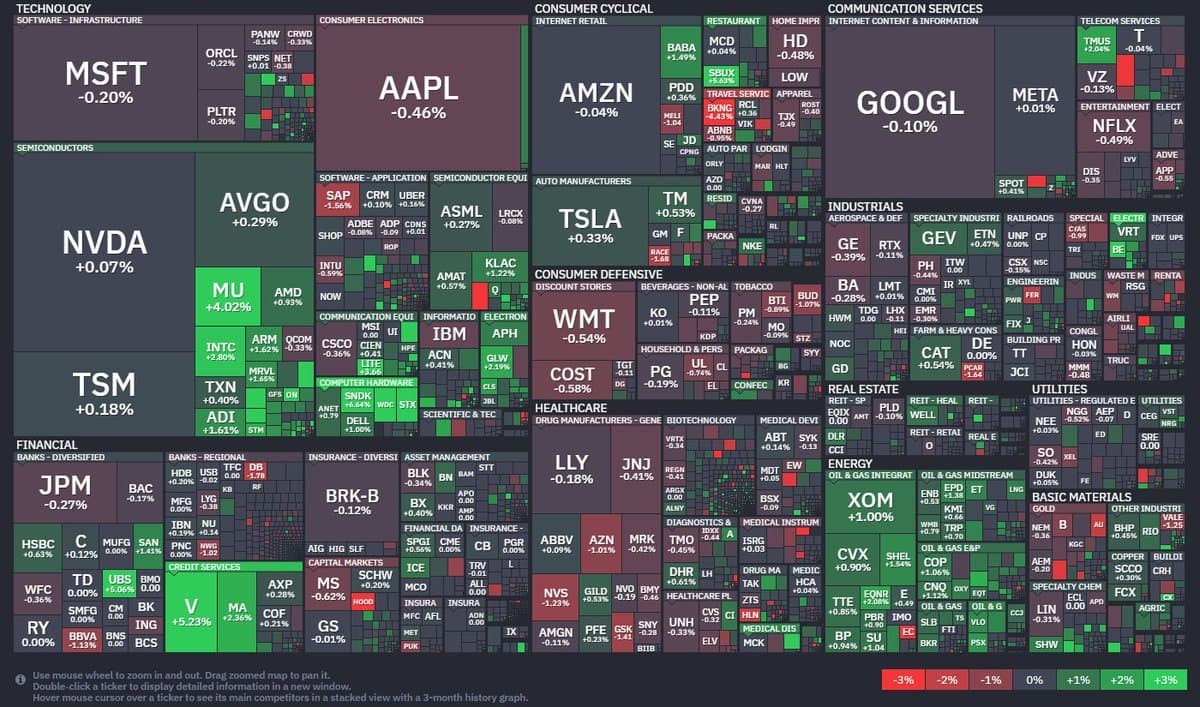
Tech AI Fuels S&P Highs as Breadth Stays Modest
For the markets, last week was more of the same, with strong momentum in the tech/AI space propelling the market away from concerns about oil shortages as the Strait of Hormuz remains mostly shut. Per the heat map below, the...
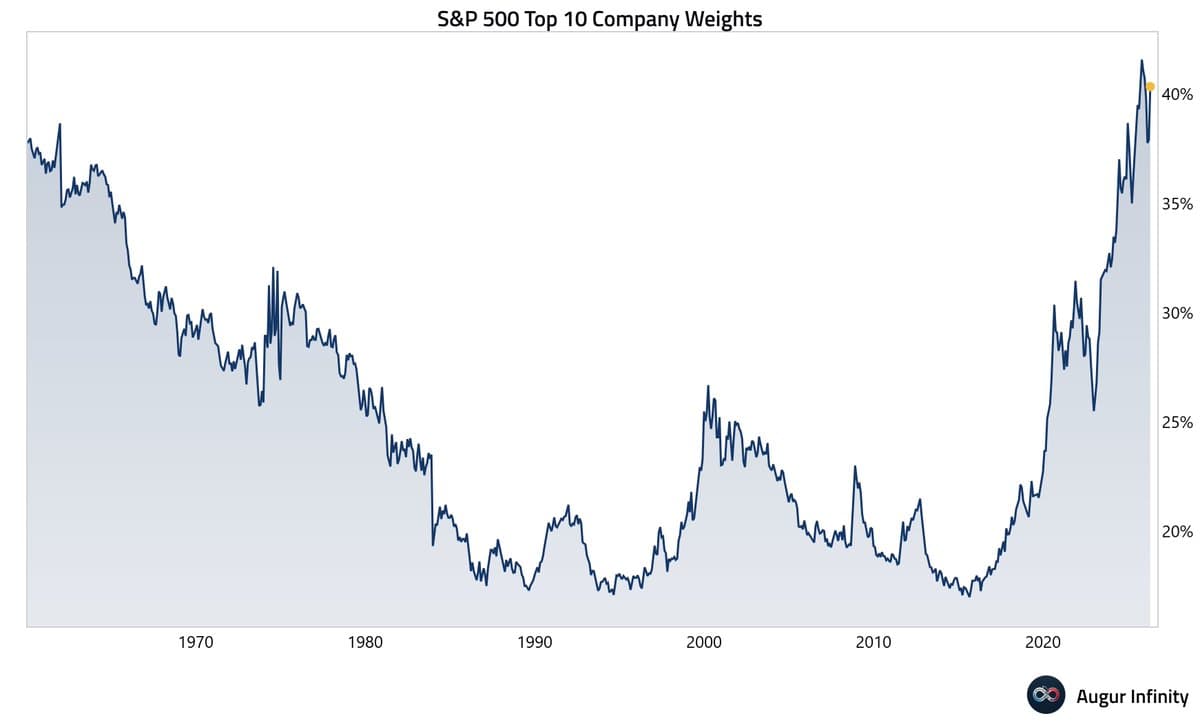
Top 10 US Firms Hold >40% of S&P 500
10 largest US companies back > 40% of total S&P 500 market cap @augurinfinity https://t.co/yyCg7bayuE
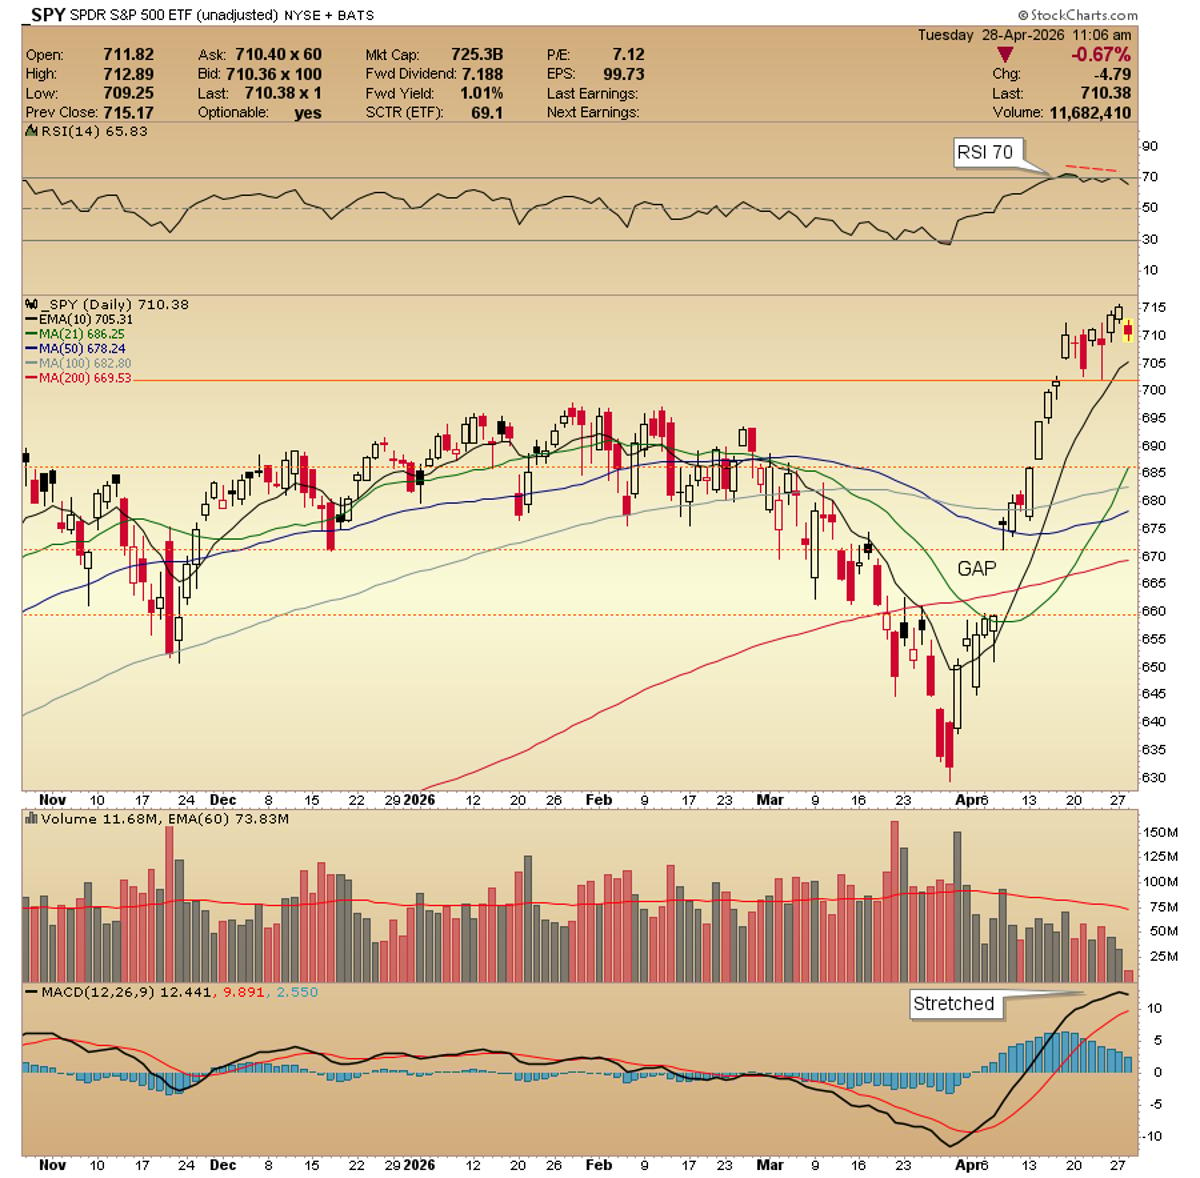
SPY RSI Negative Divergence Signals Need for Basing
$SPY RSI negative D kicking in today with the gap down. Lots of levels of support below. Basing needed to unwind. First level I am watching is the 10ema and April 16 close. Basing needed and chop chop...
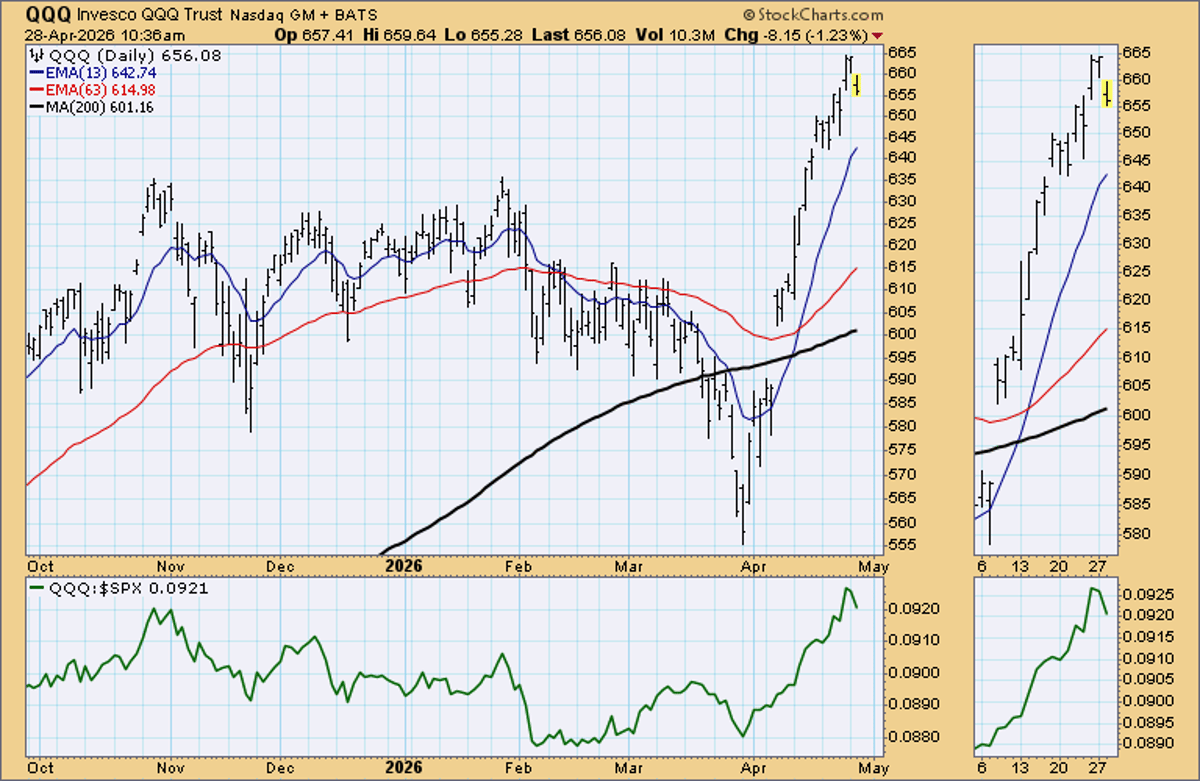
First QQQ Downside Gap Tests Trend Strength
Lo and behold: We have a downside gap in $QQQ this morning. It needs to rally to 660.69 to fill it. (There’s no gap in $SPY.) The gap doesn’t look terribly significant; I’m mainly pointing it out because it’s the...
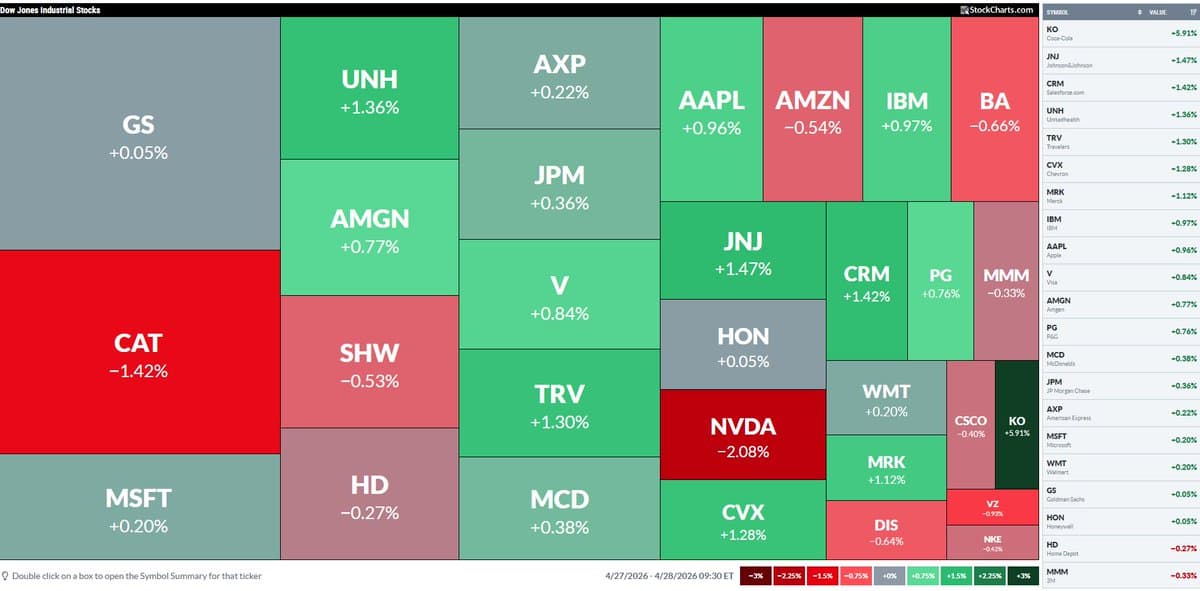
DJIA Climbs Despite CAT Drag; KO Jumps, NVDA Dips
$CAT weighs on the DJIA, but the Index is up $UNH $AMGN @stockcharts $KO popping 6% $NVDA -2% https://t.co/jNhwJV2stv
SPY Holds, But Shakeout Looms Ahead of Fed
A SHAKEOUT IS COMING & WHY OIL IS BACK ON WATCH 💌 VIP Mailing List: https://t.co/Rqp84Wg39F $SPY is still in a clean, powerful uptrend, holding above 8/21-day EMAs since early April. This “sequence” (higher highs + holding support) has created broad gains across...

Markets Pressured; GM Shines as Oil Drags
Markets under pressure from multiple fronts, with Open AI missing internal targets and Oil causing the brunt. $GM bucks the trend with strong EPS growth but already starting to sell, while $HOOD and $SBUX await their earnings after the bell. $IBIT...

Higher Inflation Dampens S&P 500, IG, HY Returns
"Periods of higher inflation are associated with weaker returns in the S&P 500 and the IG and HY indexes, consistent with a policy backdrop of elevated interest rates that restrain risk-taking" -Apollo Slok

Live Premarket Update: Redler Highlights NV
⏰ Scott Redler’s #630club - LIVE Premarket Stock Market Update ➡️ Free VIP List Newsletter: https://t.co/EW4O2nbz8N $NVDA $TSLA $IBIT $SNDK https://t.co/rkr3EsfFnw
Tech S&P Surges 20% in April, Nvidia Adds $1.25T
Tech stocks in the S&P are up almost 20% so far in April, poised for the best monthly performance since 2002. Nvidia's market cap has risen by $1.25 trillion in the past four weeks, reaching $5.26 trillion. https://t.co/sCOSqOQYgT
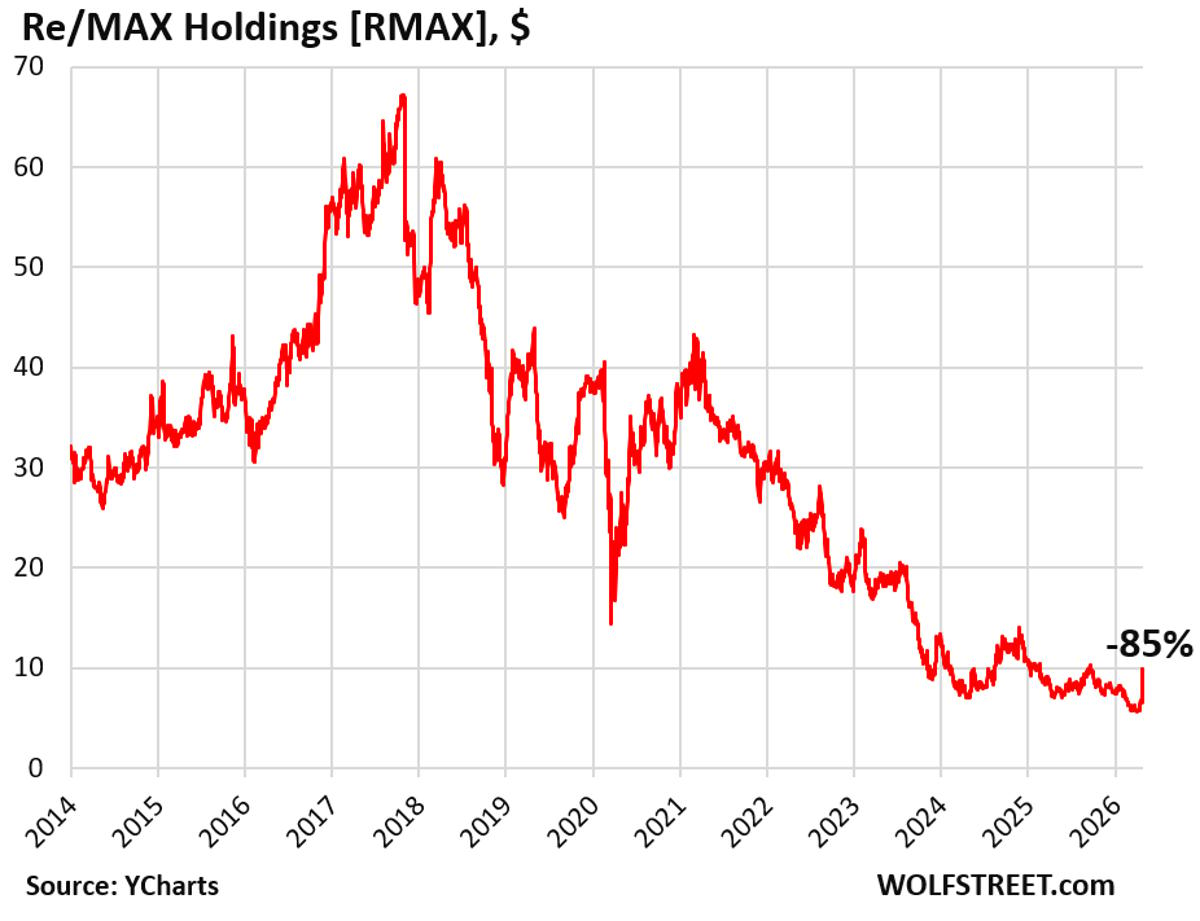
Real‑Estate Brokerage Stocks Crash 70‑85% Amid Debt Crisis
Two More Imploded Real-Estate Brokerage Stocks Tie the Knot: REMAX -85% from Peak, Real Brokerage -70%. Been brutal for real-estate stocks plunging from overhyped or meme-stock valuations amid thick losses, lots of debt, frozen housing market https://t.co/0ex7YYwN5x https://t.co/PNvZEUojQM
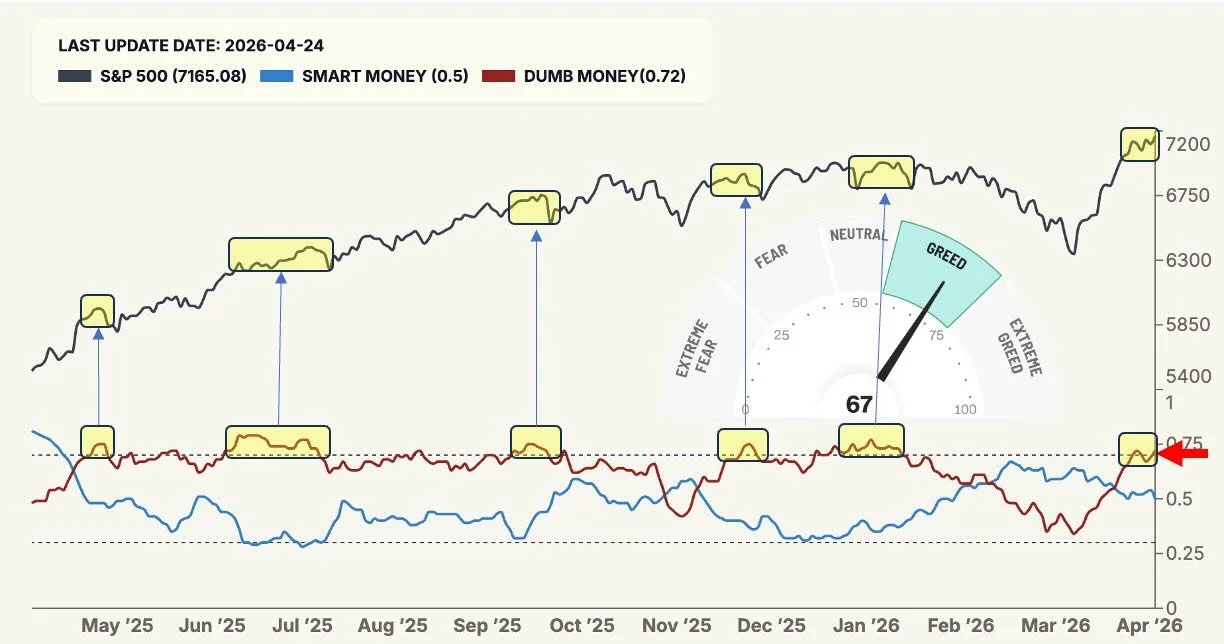
Dumb Money Extreme Optimism; Expect Pullback Despite Greed
SPX: Dumb Money Confidence has entered the Extreme Optimism zone, a level that historically coincides with index consolidations or healthy pullbacks. Furthermore, the Fear & Greed Index sits at 67 (Greed), while Smart Money Confidence is neutral ahead of major...
S&P Hits Record Highs Amid Weak Market Breadth
New all-time highs on the S&P 500, and breadth still won't confirm. NYSE advance-decline line is below its 13-week cumulative average, an entire quarter of narrowing participation. Time will tell.

AI Exclusivity Ends; S&P Hits Record, Markets Mixed
Mon Apr 27 close. The S&P just stamped another record at 7,173.91 — but the Dow was red, only four of eleven sectors finished green, and the real news of the day wasn't the print. It was Microsoft and OpenAI...
S&P 500 Futures Breakout, Yet Internals Signal Weakness
S&P 500 futures hit 7,211 today on a breakout, but the internals are concerning. Areas of concern that the bears will point out are light volume on up-days and open interest declining into the rally. Looks a little more like...
S&P Hits Record, Barely Climbs, Tightest Range
Fresh record high for the $SPX, but an absolute crawl with just a 0.1% advance and the smallest daily trading range since January 27th. Partly returning to the dead conditions before the US-Iran conflict, partly anticipation of FOMC and Mag...
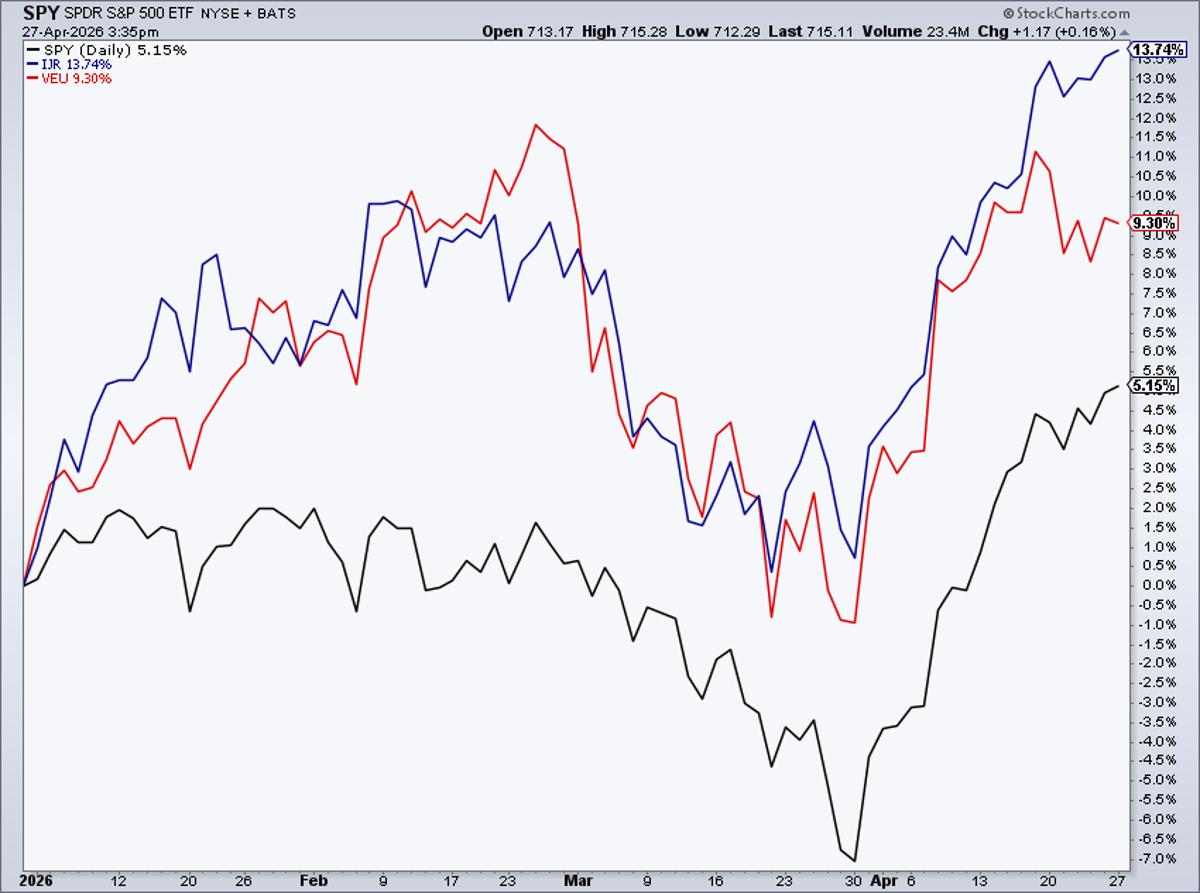
Small Caps Lead US Returns, Beating Large Caps
Narrow breadth? YTD returns... US large caps +5.2% US small caps +13.8% International stocks +9.3% https://t.co/ch8YH720NS
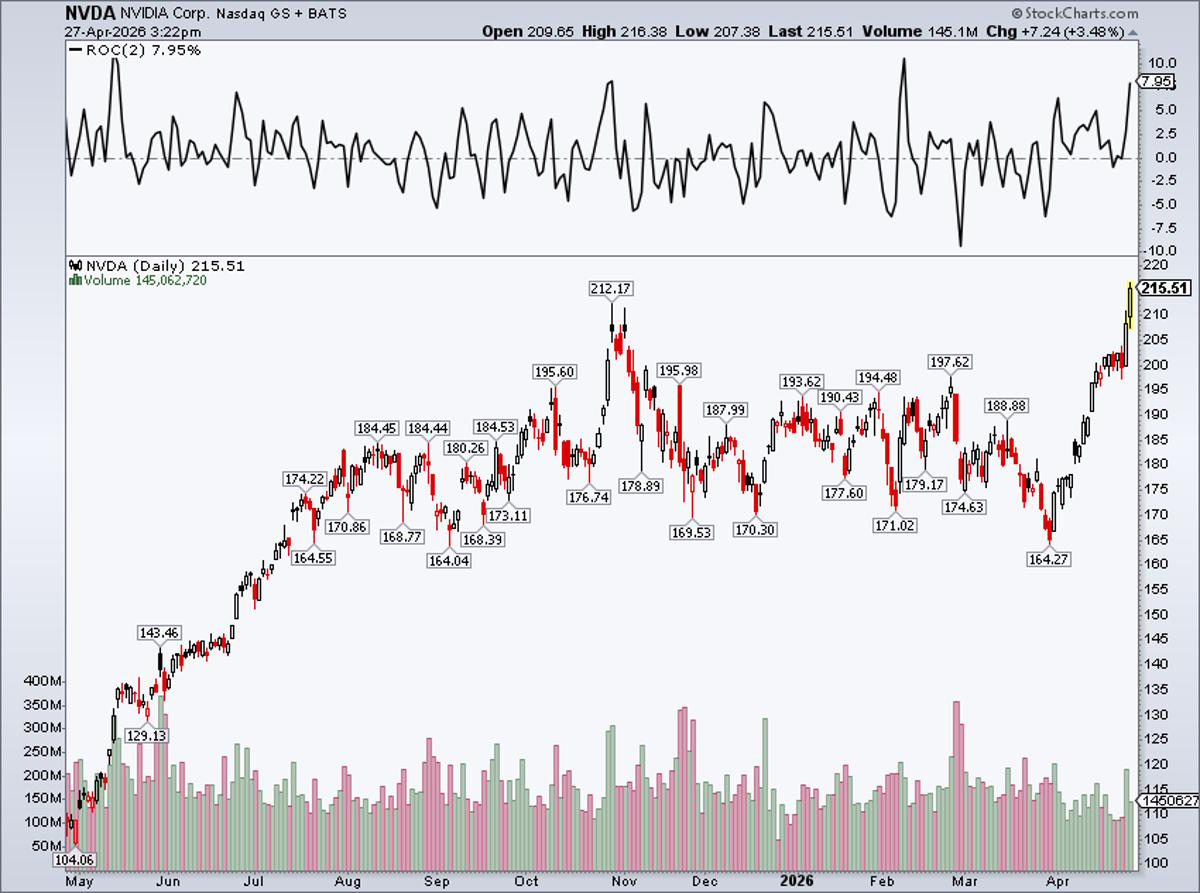
NVDA Surge Raises Questions for SOXX, SMH
$NVDA +8% last two days... record high. But is that bearish for $SOXX $SMH? My thoughts... https://t.co/dRPc37eWjs https://t.co/Kt4G5qdi98
Chip Stocks Pause After Historic Surge, Future Uncertain
Chip Stocks Take A Breather After Historic Run. What's Next For Semiconductor Group? https://t.co/cNHeCAUhdp $SOXX $QCOM $NVDA $INTC $SNDK
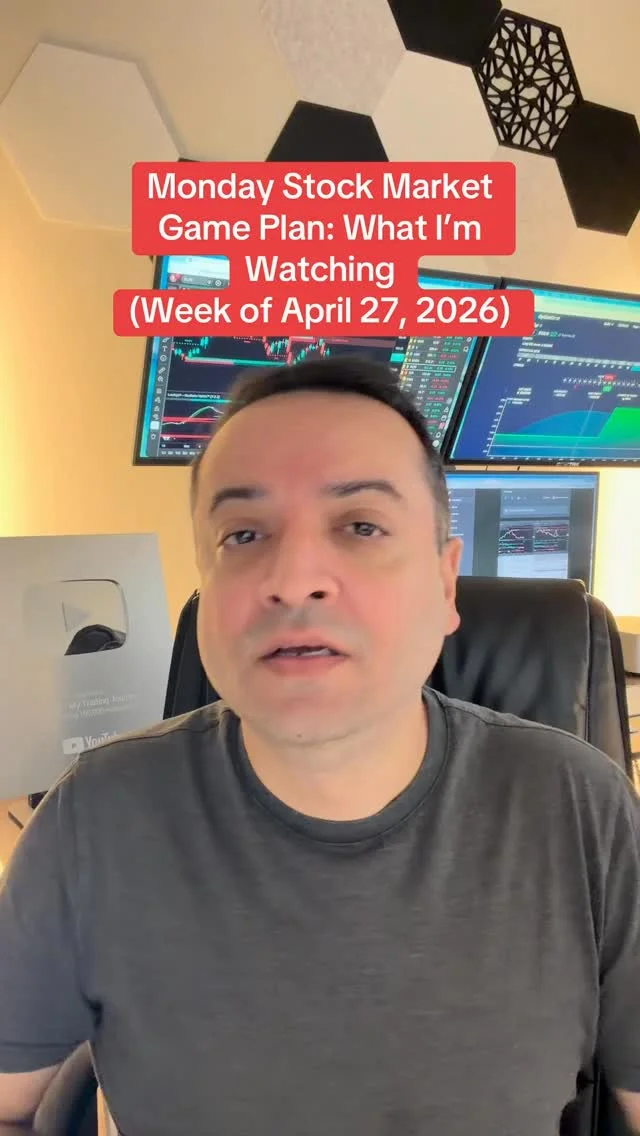
Monday's Must-Watch Stocks for the Week
Monday Stock Market Game Plan: What I’m Watching�(Week of April 27, 2026) #investingforbeginners #tradingeducation #stockmarket #stocks
CoStar's Stock Plummets 65% Amid CRE Data Slump
CoStar Group, a long-time leader in CRE data, is currently facing a significant downturn, with its stock price dropping 65% over the last nine months. https://t.co/5iVo9yIX1L