
Market Ignores Apple CEO Change Amid Bigger Shocks
Daily US Market Review — Monday, April 20, 2026 Apple changed its CEO for the first time in 15 years today. The market barely blinked — because it was too busy absorbing three bigger shocks: an Iran ceasefire teetering on Wednesday's cliff, a custom AI chip supplier flip that wiped ~$55B off Broadcom, and the first US airline to pull its 2026 profit guide. Mildly bearish into Tuesday, confidence 60%. The Nasdaq's 13-day win streak (the longest since 1992) ended today.

Goldman Forecasts S&P 500 Hitting 7% Gain by Year‑end
Goldman: “The US equity market should continue to make new highs in coming months on the back of continued earnings growth. We expect a 7% rise in the S&P 500 to our year-end target of 7600”
Citadel Proposes Half‑penny Tick Pilot to Test Market Quality
Citadel just urged the SEC for a 2-year pilot on tick sizes. 30 of the 60 most liquid stocks & ETFs would get half-penny ticks ($0.005) + lower access fee caps. The other 30 stay at the current penny tick ($0.01)...
S&P Short‑Range Oscillator Hits Extreme Overbought Level
Neither overboughts/oversolds nor sentiment/surveys are good clocks... but they are (especially in the extreme) a good weather forecast .. S&P Short Range Oscillator at close stands at 7.61% - very overbought. @SquawkCNBC @andrewrsorkin @BeckyQuick @CNBCFastMoney @HalftimeReport @carlquintanilla @ScottWapnerCNBC @SullyCNBC @saraeisen @tomkeene...

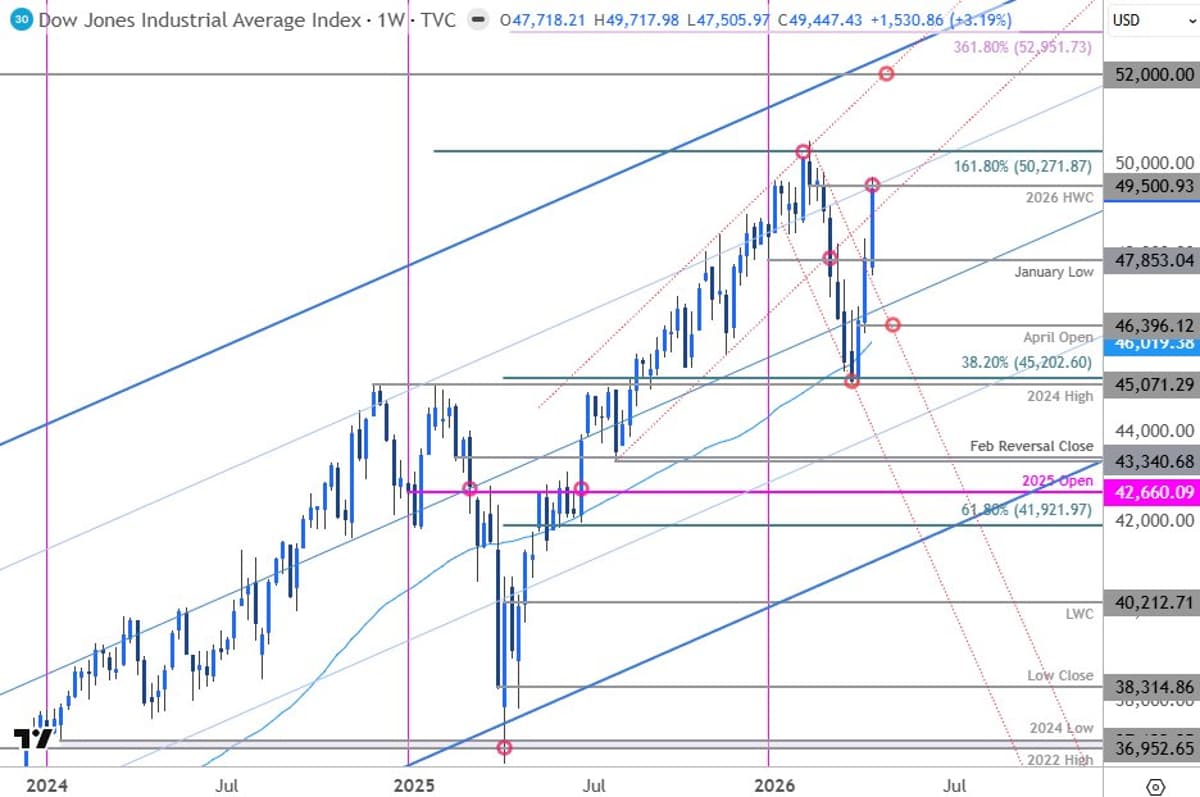
Dow Shows Bullish Bias Near Resistance, Strong Support
#DOW doji Candle. Resistance ATH 50512. Support 48788, 48000, 46978. RSI 64 not high. 13/21 day EMAs Bullish. Top Bollinger Band 49914. Midpoint Line 48338. Bottom Band 46762.
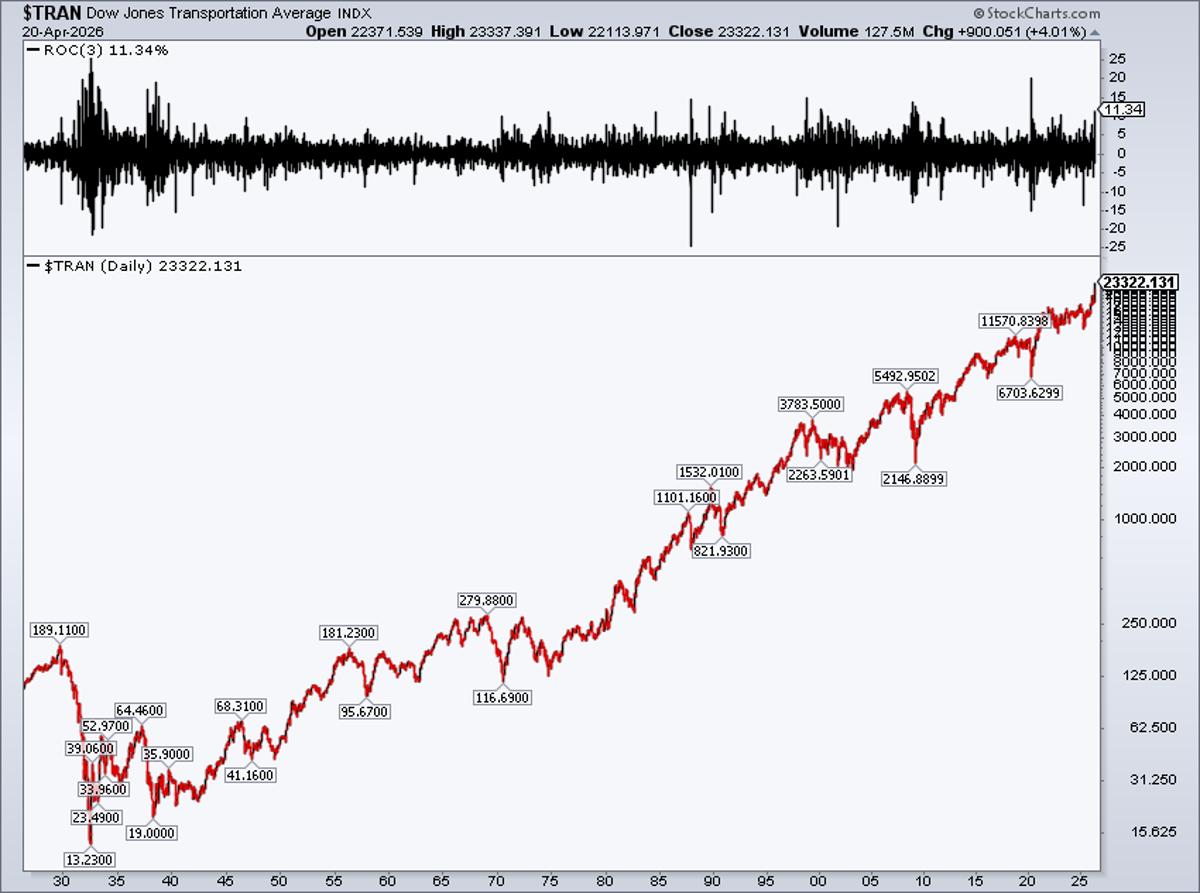
Dow Surges 11.3% in Three Days, Biggest Rally Since 1930s
Dow Transports +11.3% last 3 days.. best rally since COVID...among the biggest jumps back to the 1930s @stockcharts https://t.co/Ng9Zzel9yw
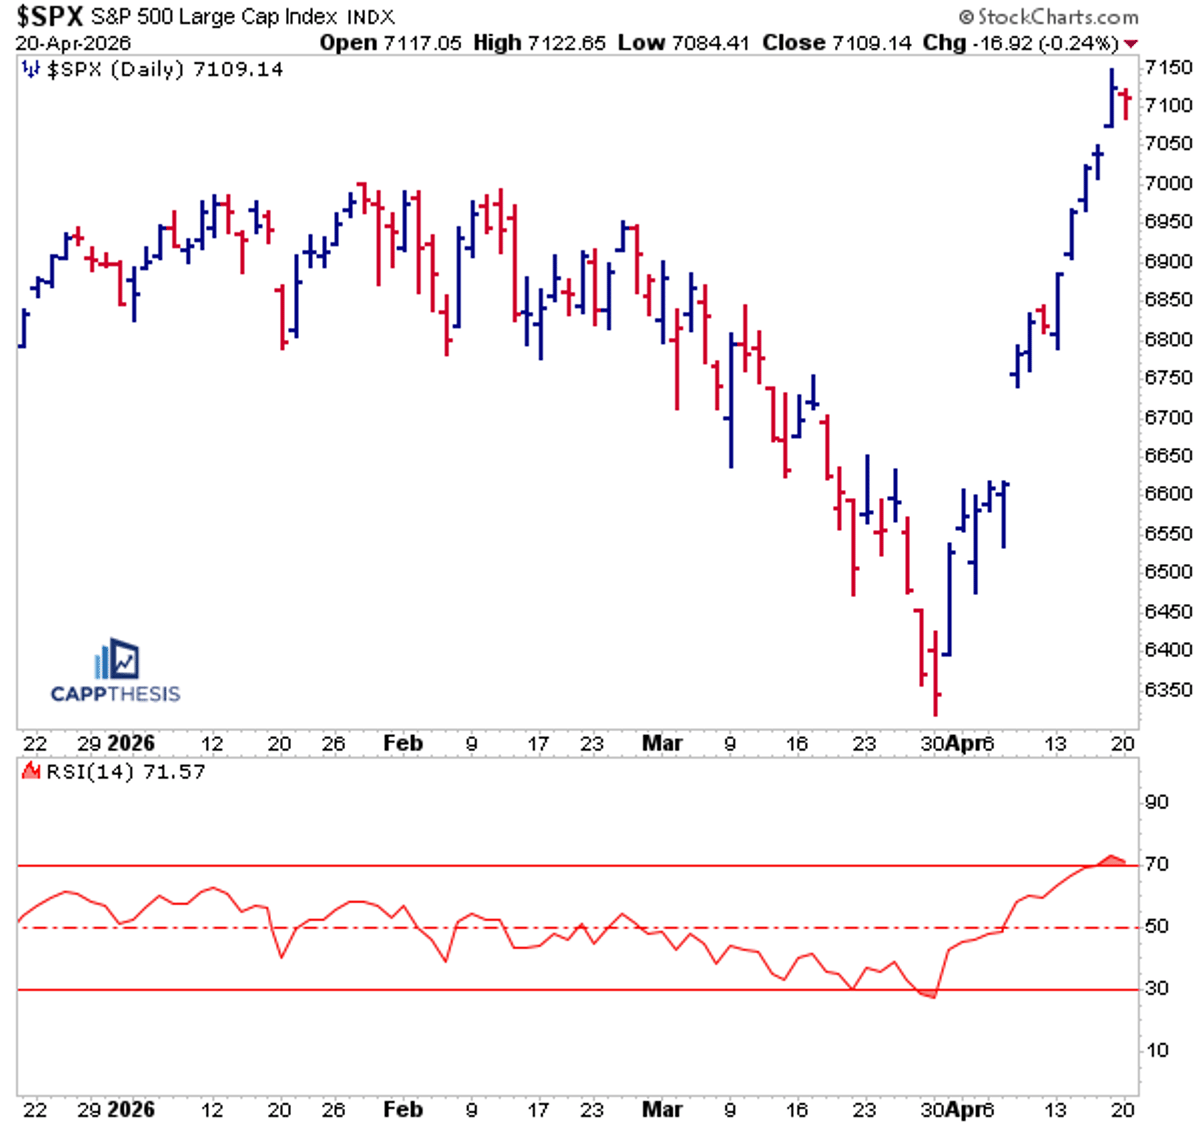
S&P 500 Stalls, Over
$SPX - Fails to make a higher high for the first time in 9 days. Finishes near the top of its intra-day range and remains overbought. Does this show a failure to go up or the inability to go down?...
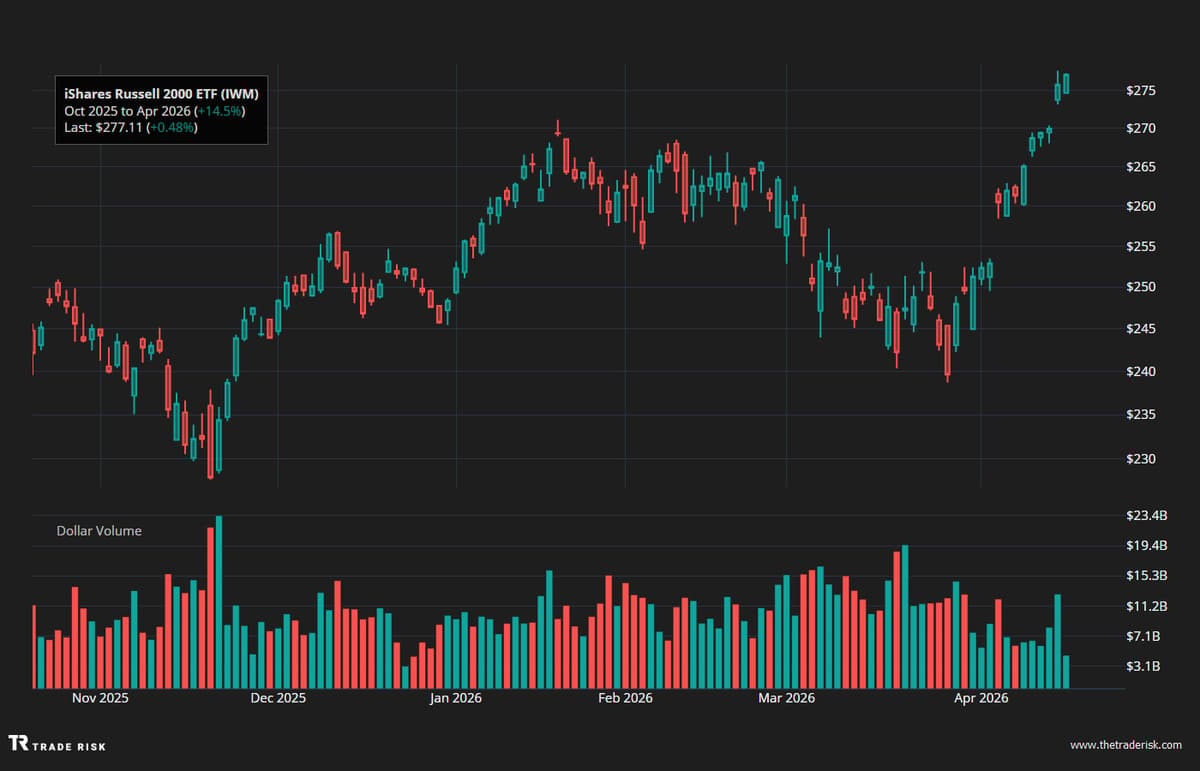
Small‑cap Russell 2000 Struggles Amid Light Volume
Digestion for most of the market to kick off the week. Small caps Russell 2000, still trying to advance. Light volume all around. $IWM https://t.co/nY4hEIkbDp

2026 May Mirror 2023 Market Gains, Says Morgan Stanley
"...We respect the “wisdom of the crowd” and appreciate that last year, markets ultimately rose more than 16% on 12% earnings growth. In fact, with the US economy no longer as sensitive to oil prices, consumer sentiment and the level...
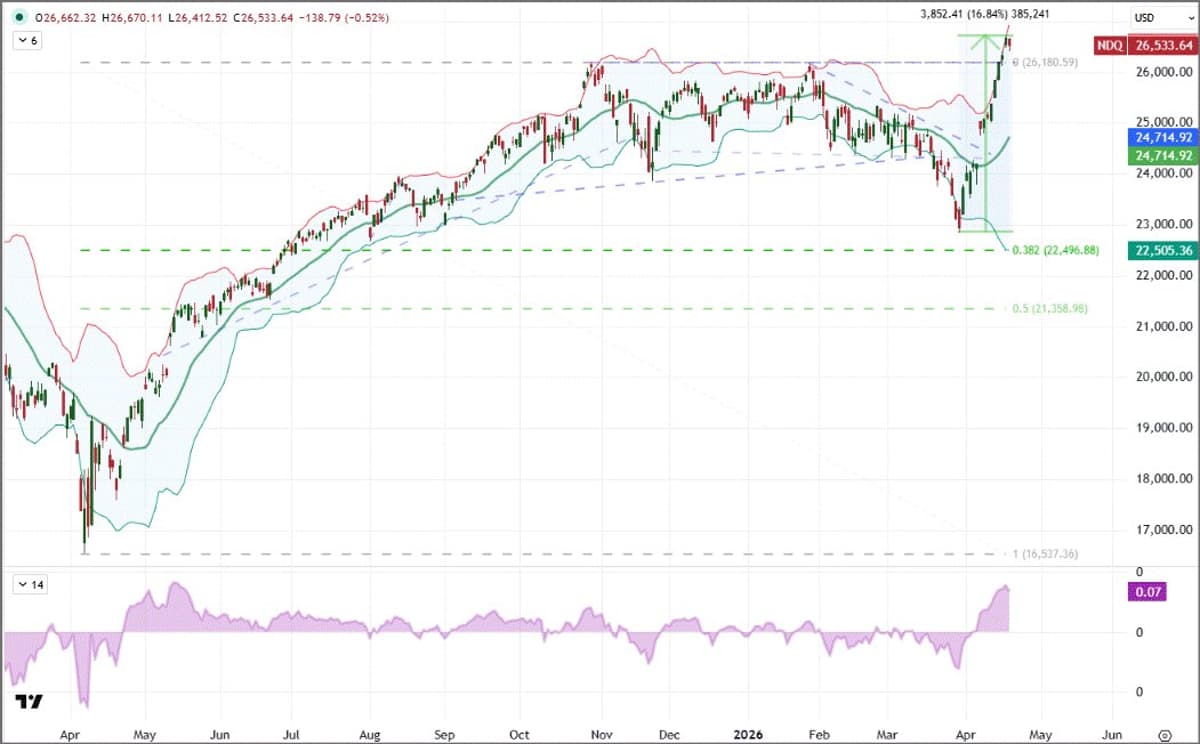
Nasdaq 100 Overextended: 8% Above 20‑Day SMA
A look at some of the 'over-extended' aspects of Nasdaq 100: $NDQ rallied peak-to-trough 17% over 13 trading days. The index was more than 8% above its 20-day SMA Friday. Stretched above the 2 std deviation above the 20-day SMA. What now? Steady,...

War Premium Mispriced Both Ways, Market Clings to Wrong Script
The war premium trade is mispriced in BOTH directions. US seized an Iranian ship Sunday night. Ceasefire expires tomorrow. WTI jumped 5.5% to $88. And yet defense stocks are RED today — LMT -1.3%, RTX -0.3%, NOC -0.8%. The market is still...
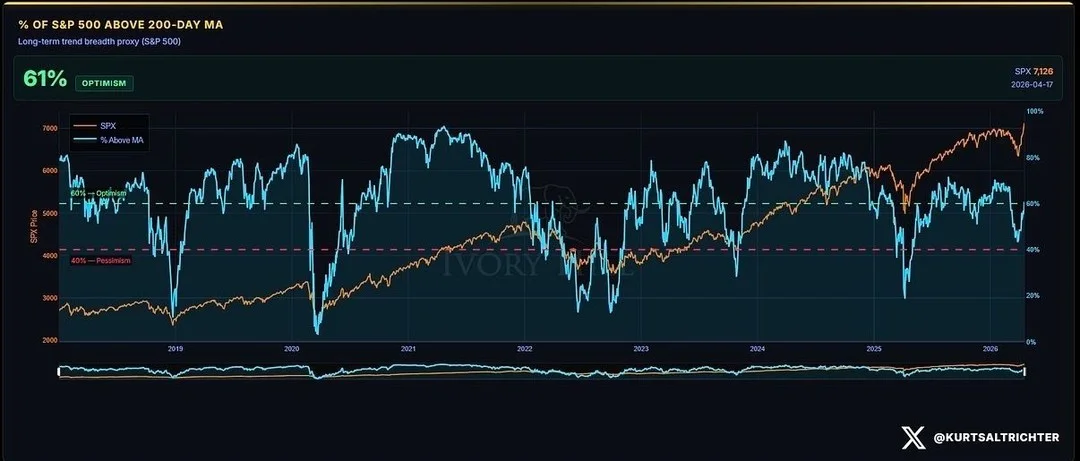
S&P 500 Crosses Optimism Threshold, Majority Above Trend
A few weeks ago, fewer than half of the S&P 500 components were trading above their long-term trend. Today, the majority is. Participation has cleared the optimism threshold. Now let’s see if it can hold.

Earnings Season Hits Record Volatility: 63 S&P Stocks Surge
Earnings season has been getting more volatile "Last quarter, 63 SPX stocks moved more than 10% on earnings. That is a record and compares to just 10 on average from 2012 to 2021" --Citi
S&P 500 Rallies 12% in Broad Melt‑up
The S&P 500 is up 12% since it bottomed on March 30 "This is a broad melt-up. For now, animal spirits are back in the stock market" --@yardeni
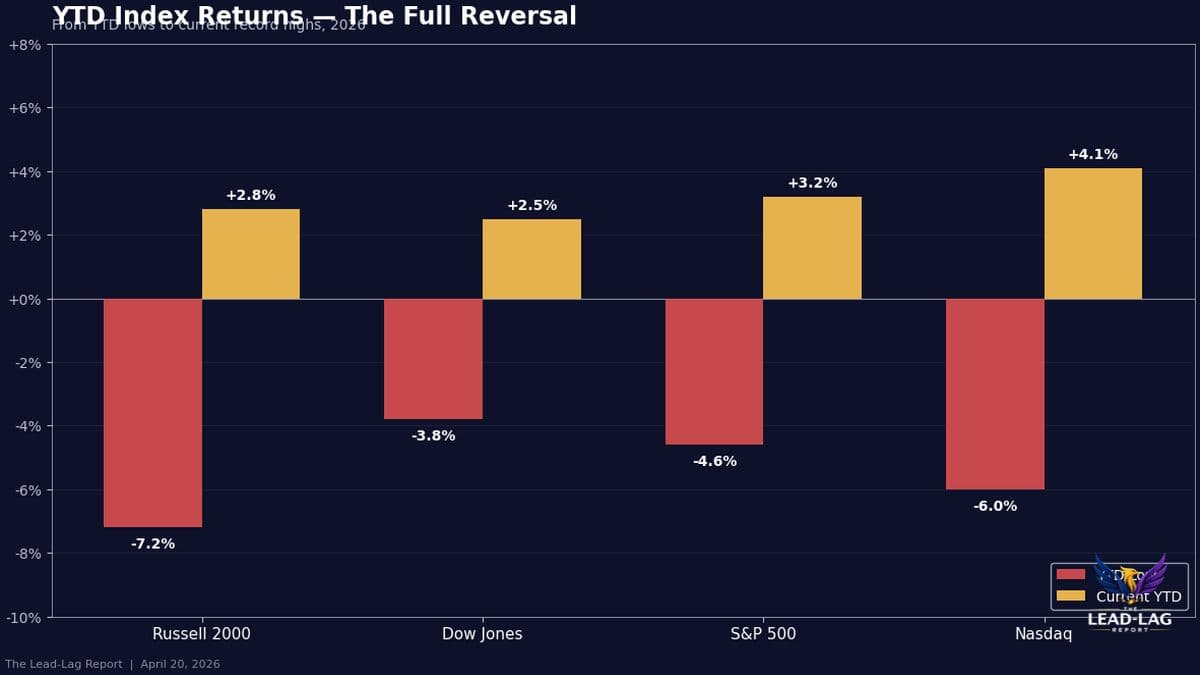
All U.S. Indexes Flip From Red to Record Highs
At the March 30 low, every major U.S. index was RED for 2026. $SPY. $QQQ. $IWM. $DIA. All negative. Four weeks later: all at ALL-TIME HIGHS. The full reversal from across-the-board red to across-the-board records is historically rare. Don't dismiss it. https://t.co/NzijN02BMy
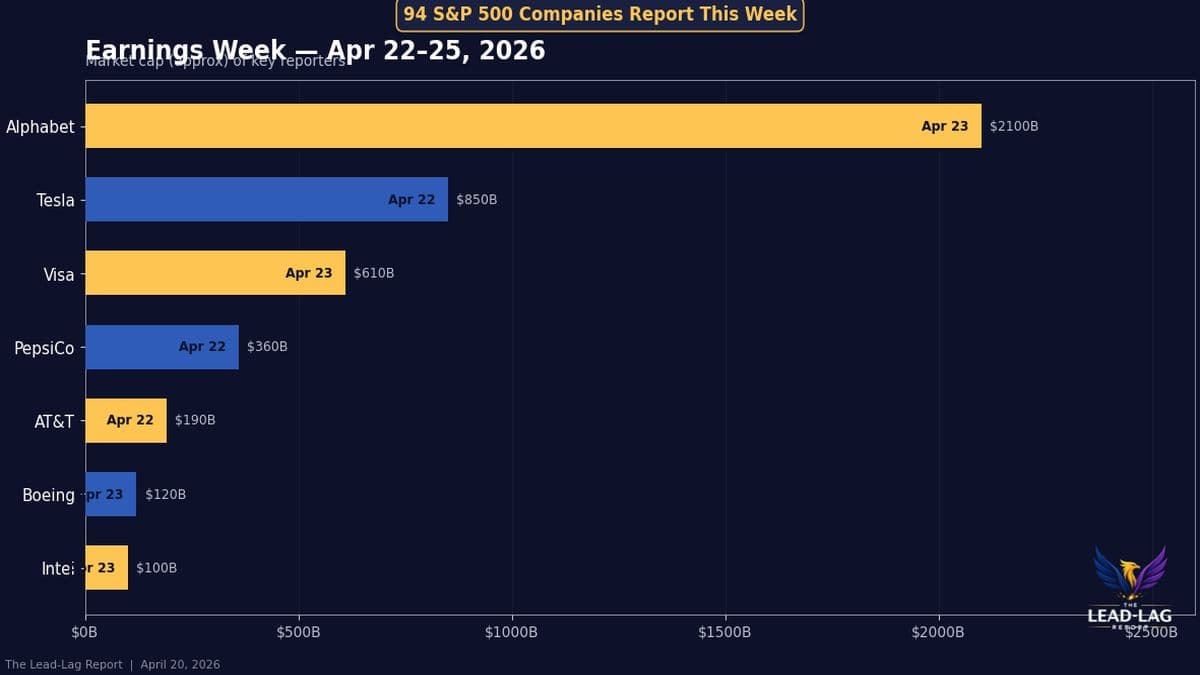
Earnings Week at Market Peaks: Rally Test or Bear Trigger
$TSLA reports earnings April 22. That same week: 94 $SPY component companies report. The busiest earnings week of the year hits when markets are at ALL-TIME HIGHS. Earnings either validate this rally — or give every reluctant bear a reason to act. https://t.co/bWW5e4qLEy

Tuesday's Triple Threat Sparks Market Volatility
This is the market right now 🤯 Ceasefire expires Tuesday. US-Iran meeting Tuesday. US Retail Sales Tuesday. Expect volatility $SPX $SPY $QQQ $DJI $CL $USO $XLE $GC $GLD $DXY
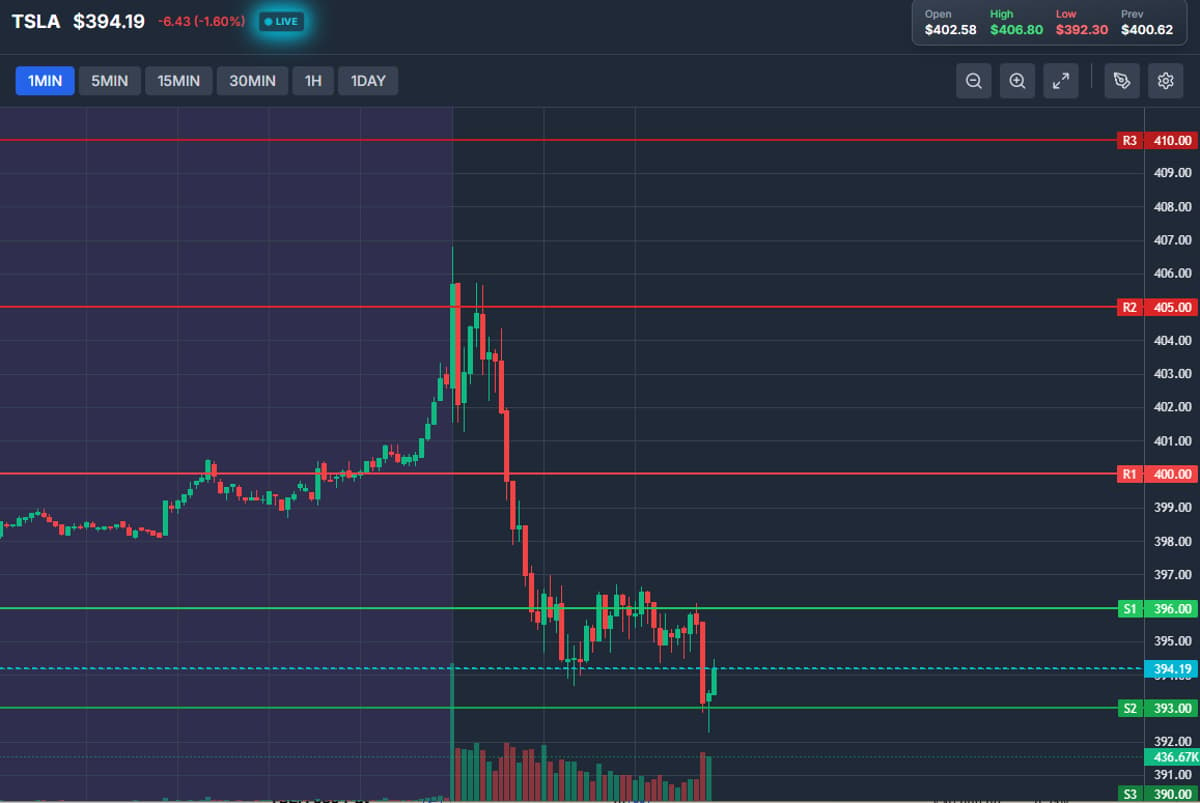
Chasing Tesla Buyers Stopped Out Before Earnings
chasers punished in $TSLA this morning. --buyers at R2 this morning just stopped out below S2. --earnings on wednesday after the close. https://t.co/4IEY6Dyx2r
Fermi Shares Tumble 20% at Open, Biggest Fall Since March
JUST IN: Fermi stock plunged 20% at the market open, the largest drop since March.
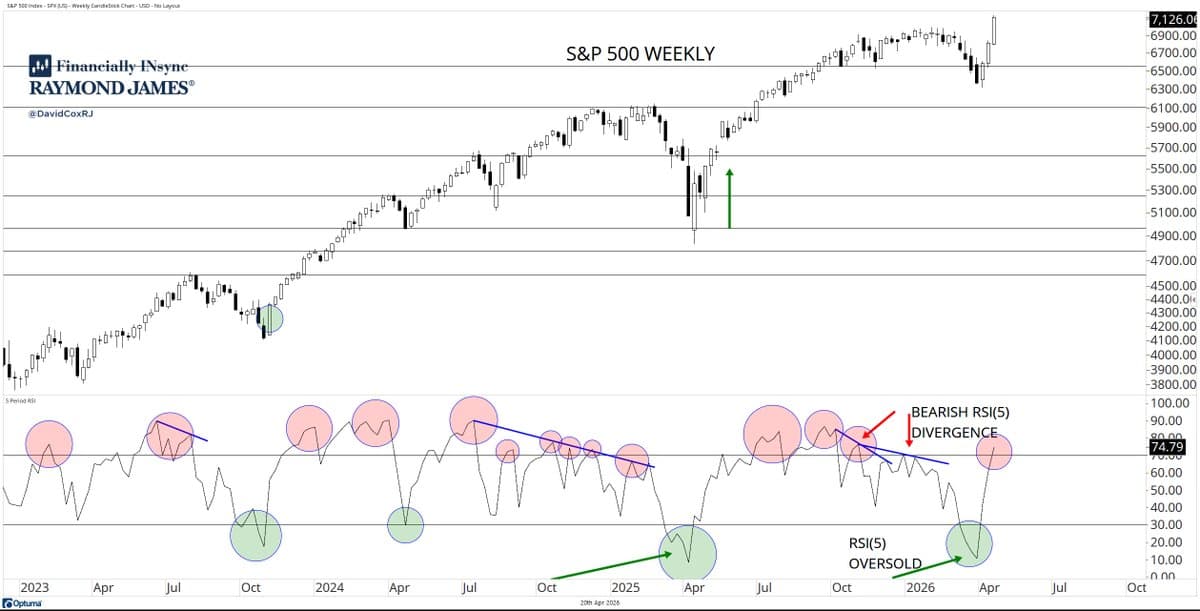
S&P 500 Weekly RSI Hits Overbought
we're starting the week with the S&P 500 $SPX RSI(5) overbought on the weekly chart for the first time in six months... https://t.co/sr1M1wKskc
Futures Fall, Oil Rises, Nasdaq Streak Threatened
JUST IN: Stock futures are dropping while oil prices surge on ceasefire failures, risking the end of Nasdaq's 13-day streak.
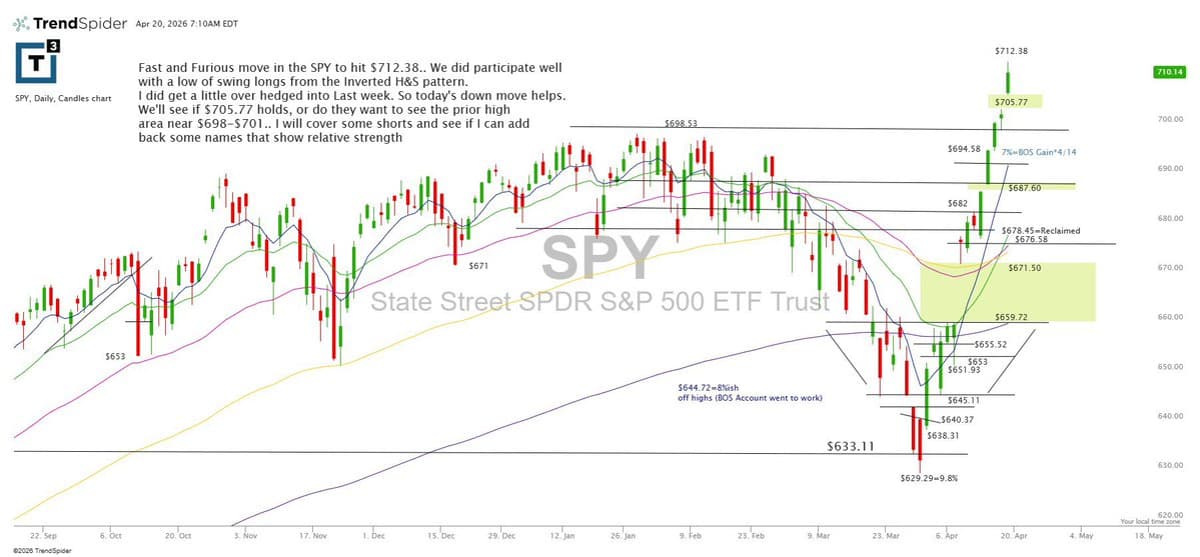
Watching SPY: Will Friday’s Low Hold or Slip?
$spy follow up as we see if Friday’s low holds or do we retrace a bit lower https://t.co/JwJ3owG2KM

92% of S&P 500 Firms Beat Forecasts, Median +5%
“Of the 49 companies that have reported so far (10% of the S&P 500): Overall, 92% are beating estimates, and those that “beat” are beating by a median of 5%.” - @fundstrat
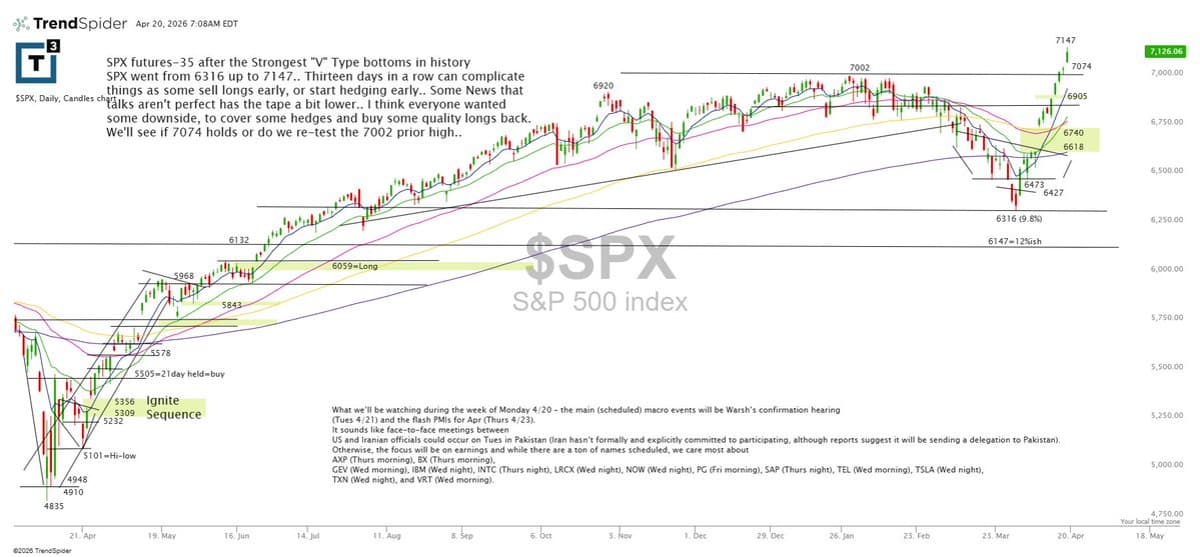
SPX Eyes 7074 Resistance After 13-Day Rally
$SPX moving from 6316 to 7147. Thirteen straight up days can complicate things as some sell longs or start hedging, especially with talks looking a bit less perfect. Now we’ll see if 7074 holds or if we re-test 7002. https://t.co/ggxPg9KKER
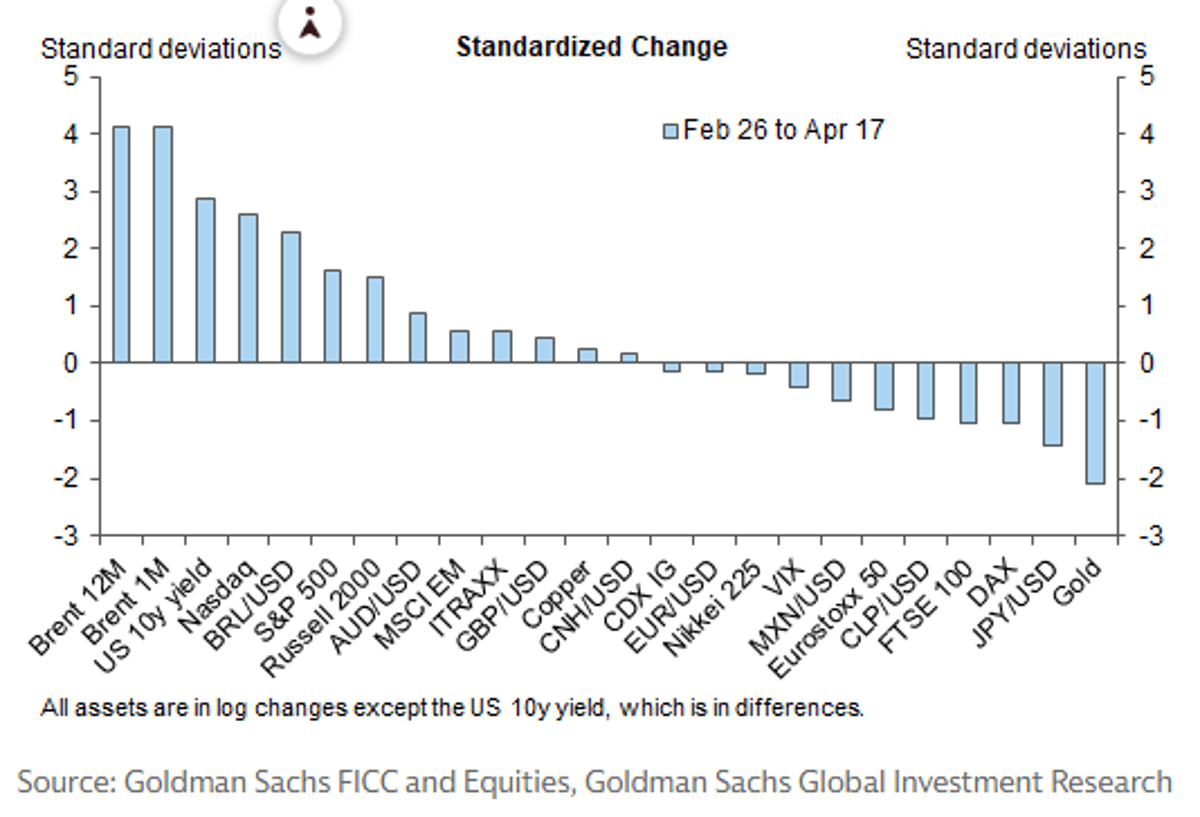
US Stocks Peaked; Oil and Yields Stay Elevated
GS: US equities are through the highs, but oil and yields are still well above pre-war levels https://t.co/aMwCrKHBwC
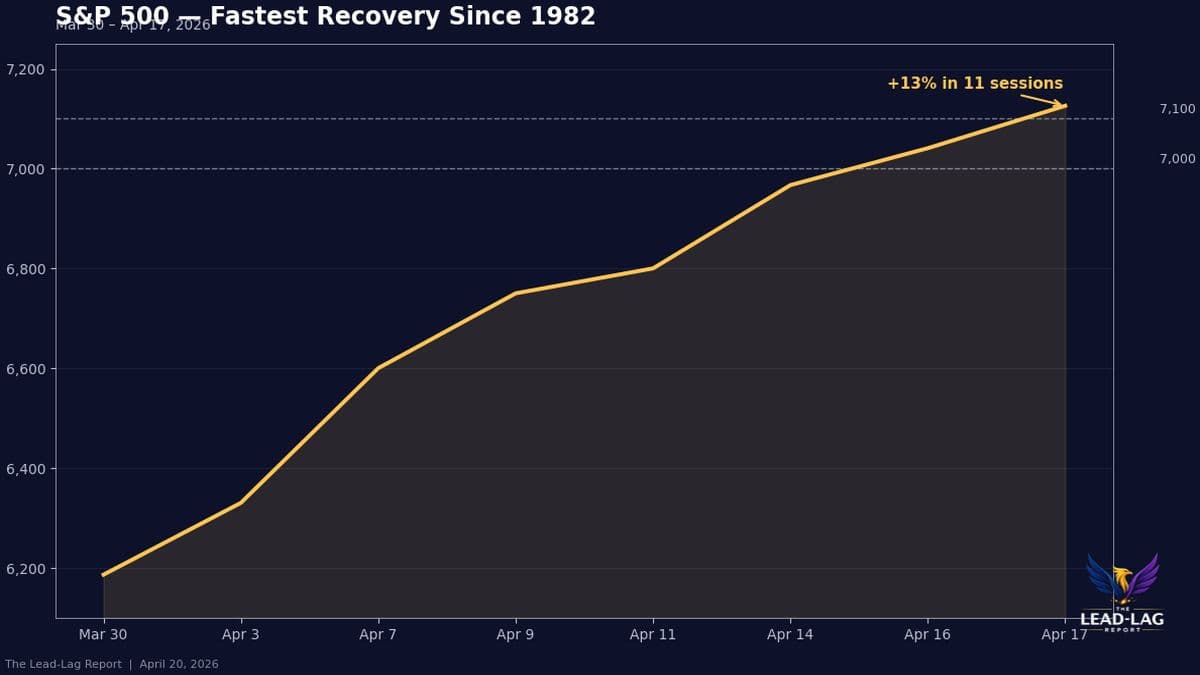
SPY Hits Record High, Fastest Recovery Since 1982
$SPY just closed at 7,126 — an ALL-TIME HIGH. +13% in 11 sessions from the March 30 low. That's the fastest recovery since 1982. Every bear who called a prolonged collapse is now underwater. https://t.co/8ltnRPpY7t
Live Prem
⏰ Scott Redler’s #630club - LIVE Premarket Stock Market Update ➡️ Free VIP List Newsletter: https://t.co/EW4O2nbz8N $NVDA $TSLA $IBIT $SNDK https://t.co/eDbEhRjgAv
Oil Spikes While Stocks and Commodities Slide
$SPY -0.5% $QQQ -0.5% $IWM -0.9% $EEM -1.5% $TLT -0.2% $USO +5.4% $IBIT -3.2% $GLD -1.2% $XLE +1.4% https://t.co/mpRZrC3jG7

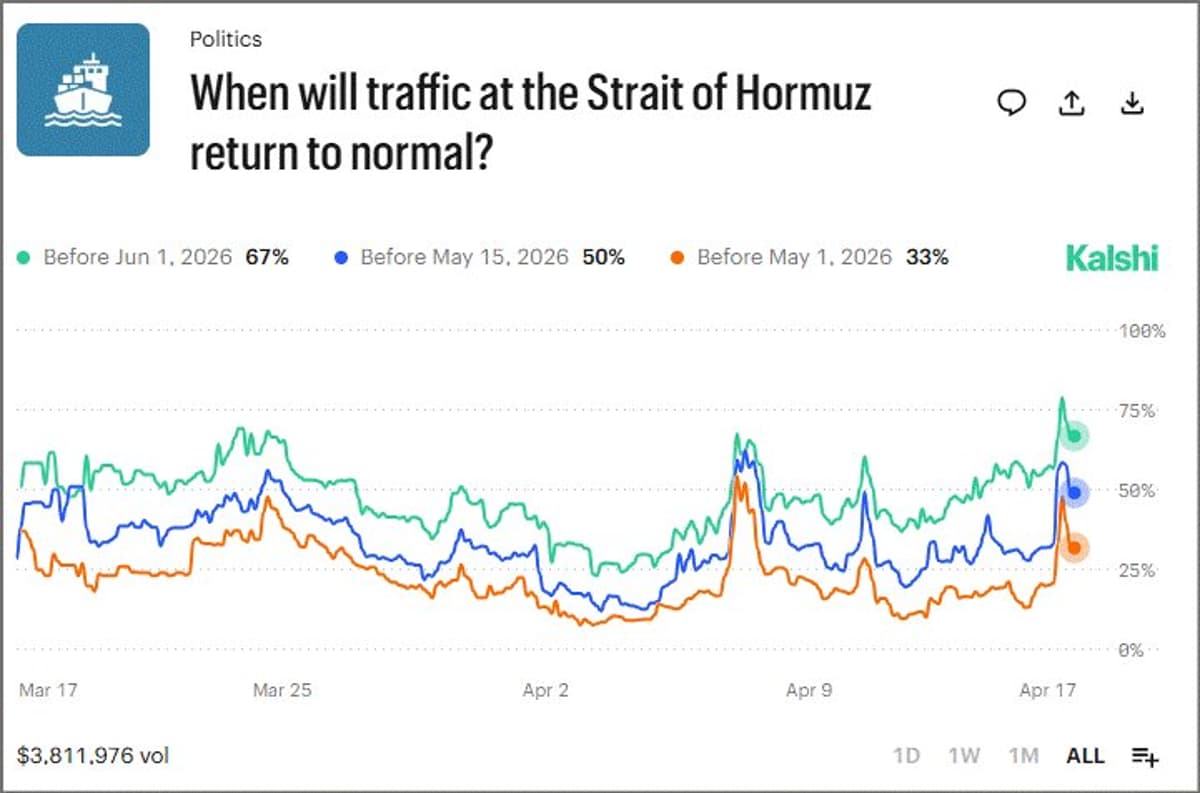
S&P Hits Record as Oil Plunges Amid Iran Tensions
The S&P just hit a RECORD HIGH. Oil crashed 13% in a week. Iran says the Strait is "completely open." Hapag-Lloyd and Maersk won't send ships through. The ceasefire expires TUESDAY. And the Navy just put 5-inch gun rounds into...
Markets Clash as Ceasefire Deadline Looms
Banks crushed earnings. Oil crashed 11% in a day. Gold refused to sell off. The Nasdaq just posted its longest winning streak since 1992. Something has to give. The ceasefire expires Wednesday. https://t.co/1ewAQlpSy4

New Highs or 7‑Day Streak Signal 18% Annual Gains
Two to think about 1.) S&P 500 new high in April? Full year up 18 out of 19 times and up 18.8% on avg. 2.) S&P 500 7-day win streak? Full year higher 19 out of 20 times and up (once again)...
Nasdaq's Fastest 40‑year Swing Fuels 12% S&P Rally
The Nasdaq just posted its fastest oversold-to-overbought swing in 40 years while oil spikes $5 on Middle East tensions. The S&P 500 is up 12% in three weeks. 🔒 Members-Only https://t.co/Y24djSuQYp
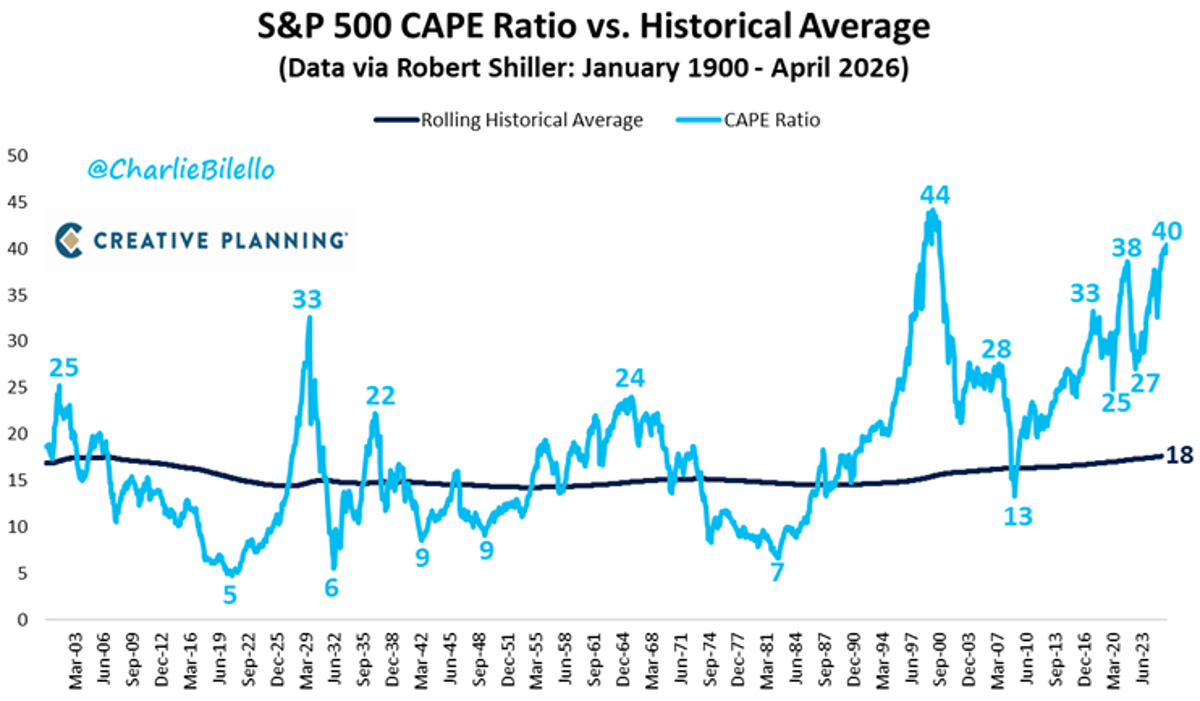
S&P 500 CAPE Hits 40, Tops 99% Historic Levels
The S&P 500's CAPE Ratio has moved up to 40, its highest level since 2000 and now above 99% of historical valuations. $SPX https://t.co/uhUt33SCp5
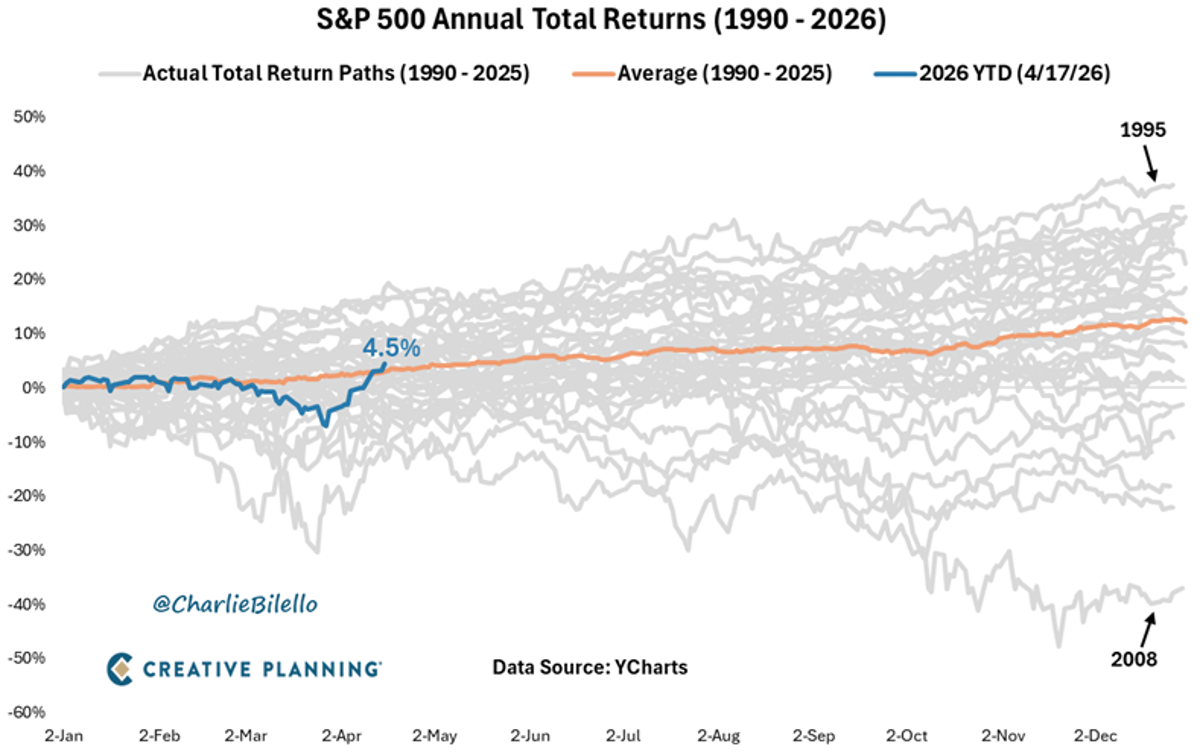
S&P 500 Rebounds From 7% Loss to +4.5% YTD
On March 30, the S&P 500 was down 7% in 2026, the 12th worst start to a year in history. After one of the biggest 3-week rallies ever, it's now up +4.5% YTD and above the average year at this...

Stocks Should Fall More Amid Straits Closure Warning
I say this with complete humility, stocks should probably be down a lot more tonight, with news the Straits are closed. June E-mini should be down >$100, but the way things are going, if I wake up tomorrow and they...
SPX Surges 12% as VIX Plunges 40%
SPX is up 12% in under 3 weeks, and VIX is down 40% since March. What actually drove this rally? Read the full breakdown, and discover how to position for the week ahead: https://t.co/pjlGkluggt
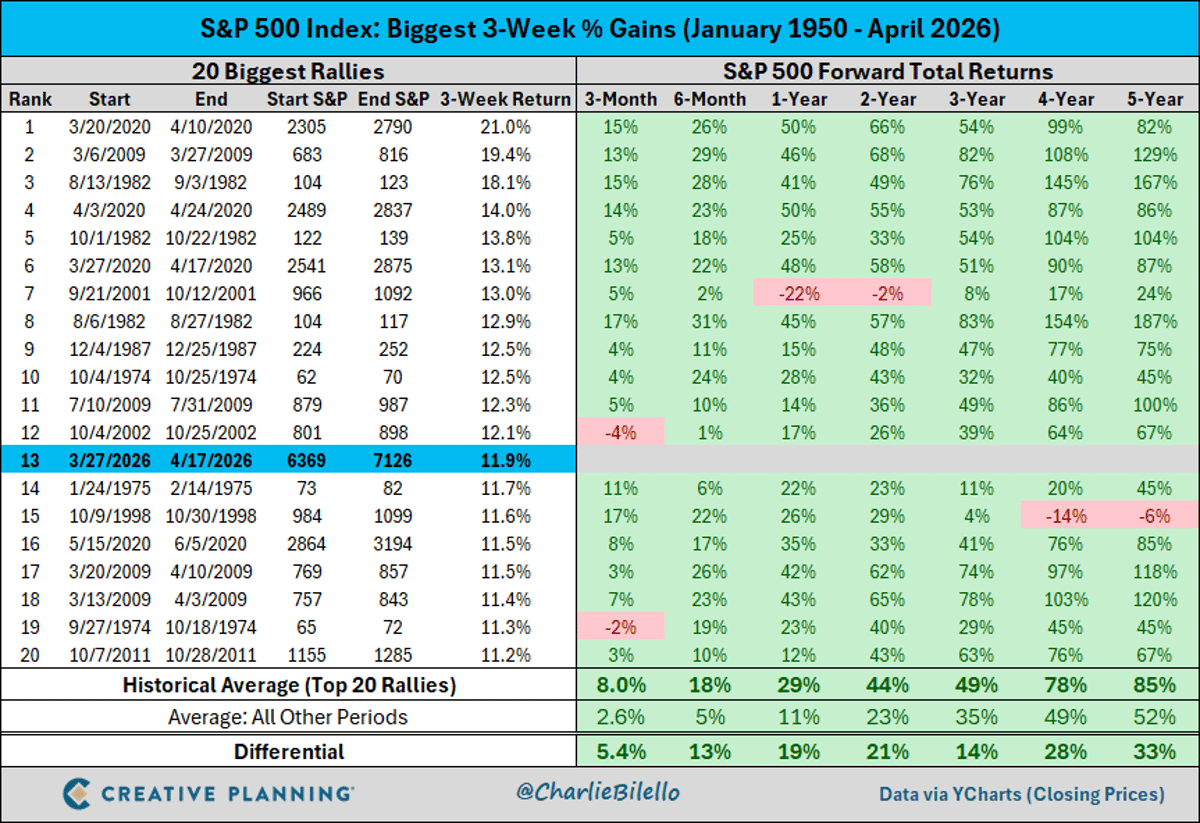
Historic S&P Rally Unlinked to Bear Market Cycle
The 11.9% gain in the S&P 500 over the last 3 weeks was the 13th biggest 3-week gain for the index since 1950. What's unique about this rally? It's the only example in the top 20 that did not occur either during...
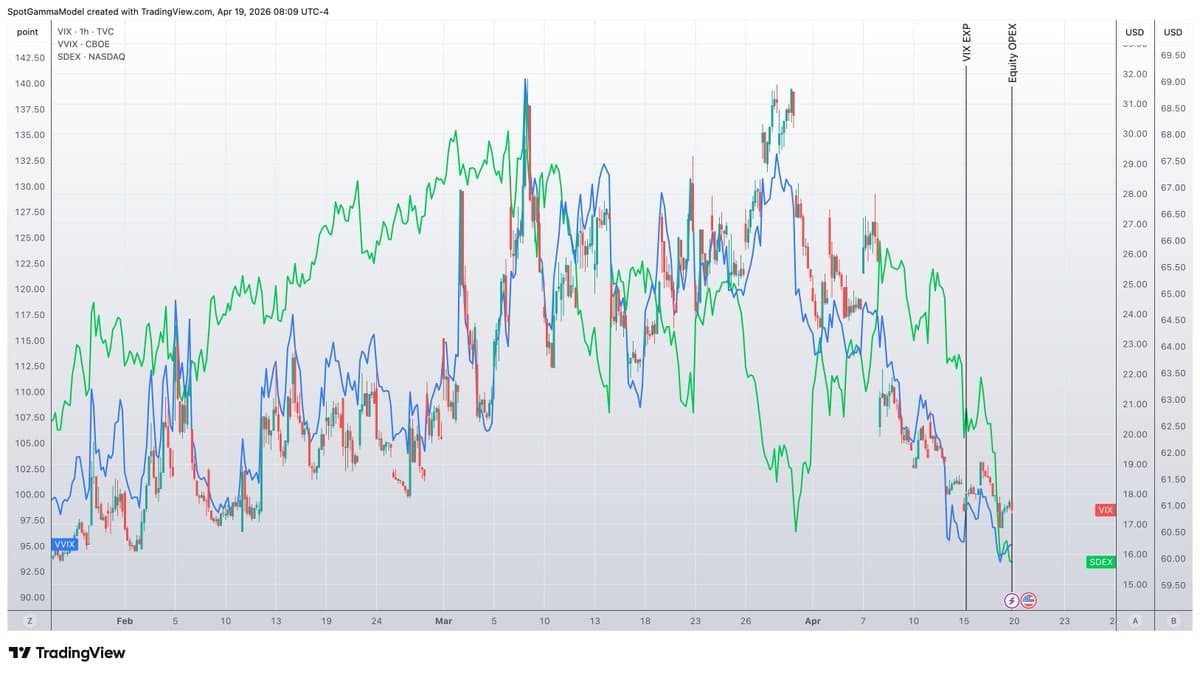
Markets Surge, Volatility Crush, Record Low Put‑call Ratio
SPX +12% in 2 weeks NDX +13 days in a row of pos returns - longest since '13 Vol crush: VIX,VVIX,SDEX, post Iran lows at OPEX Record PC ratio lows driven by big mecacap call volume while no one wanted puts... https://t.co/4BRBOUbPjR
Most SPY Stocks Near New Highs, Expect Surge
$SPY - Messing with some data this morning. Fun Breadth Facts.... 124 Stocks within 5% of New Highs 10 Stocks Within 5% of New Lows We could see an explosion in new highs very soon...

New Stock Highs Explained: Optimism for Better Times
Stocks are back to new highs and many wonder how that is possible. In our latest Glass Half Full, Sonu and I discussed why this is happening and why better times could be likely. https://t.co/ZF7kxjqVAL
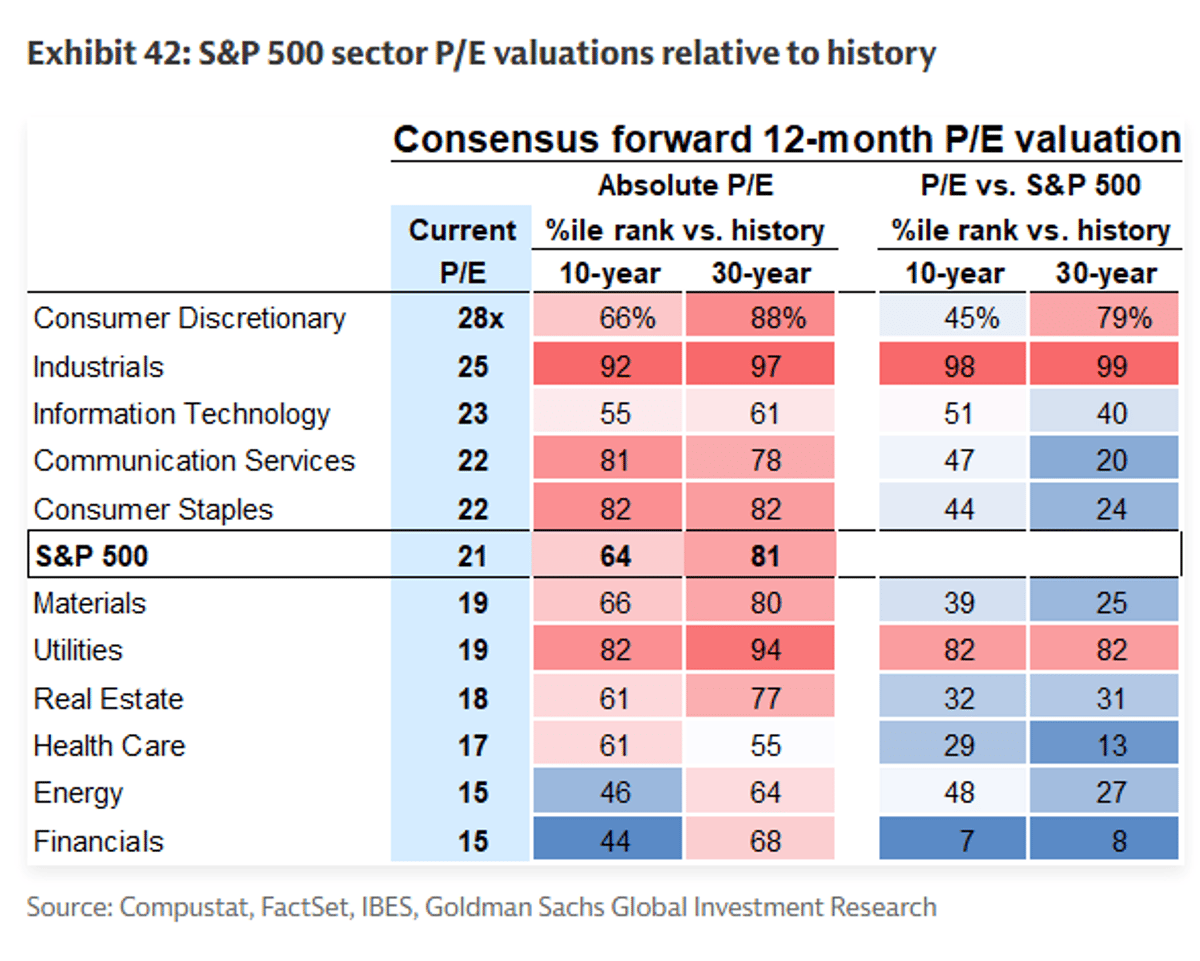
Industrial Valuations Lag Record Behind S&P 500
S&P 500 sector valuations.. record gap between Industrials and the SPX Index, I hear https://t.co/k2tLMv610Z
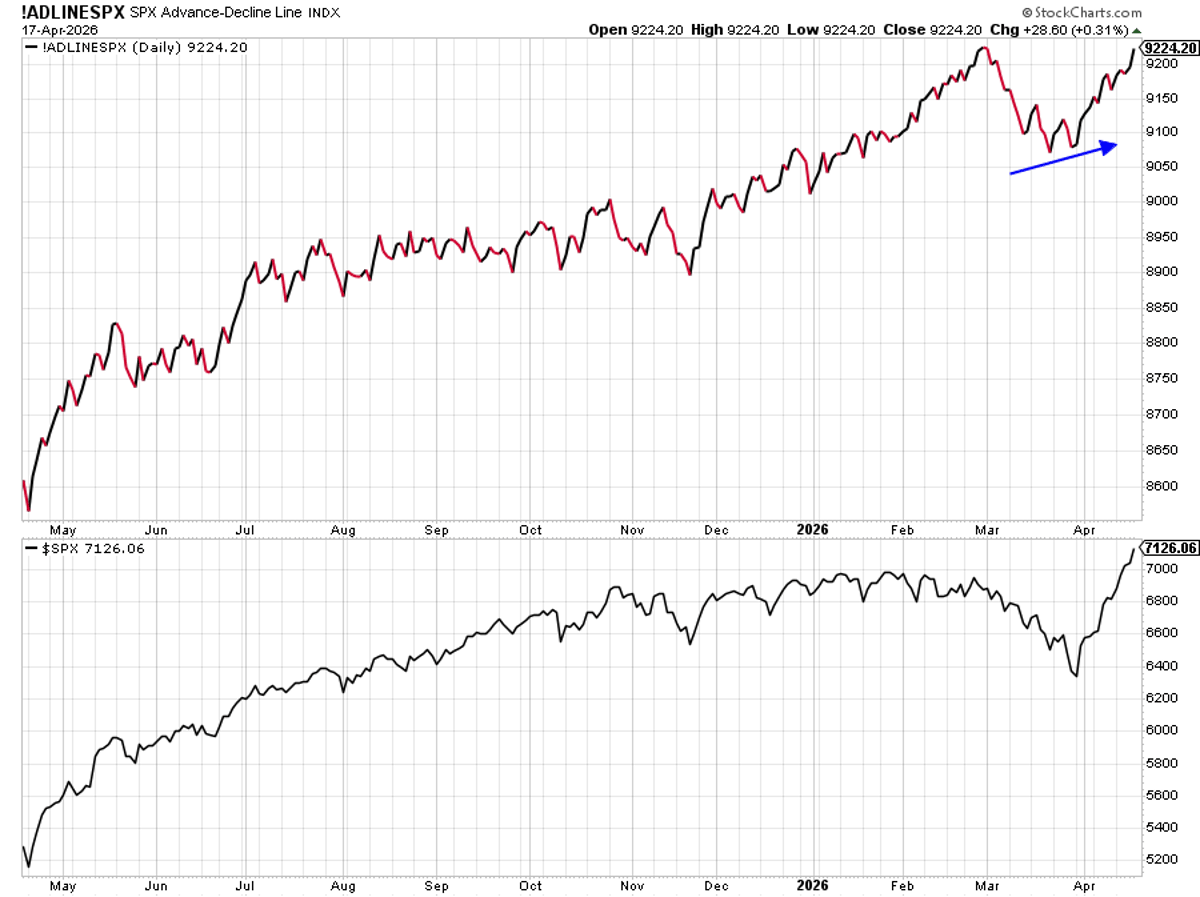
Breadth Signals Bull Market: AD Line Hits New Highs
Breadth leads price, same as it always has. S&P 500 advance/decline line didn't make new lows in late March, another clue the end wasn't near like so many were telling us. The A/D line moved to new highs last week, yet another...
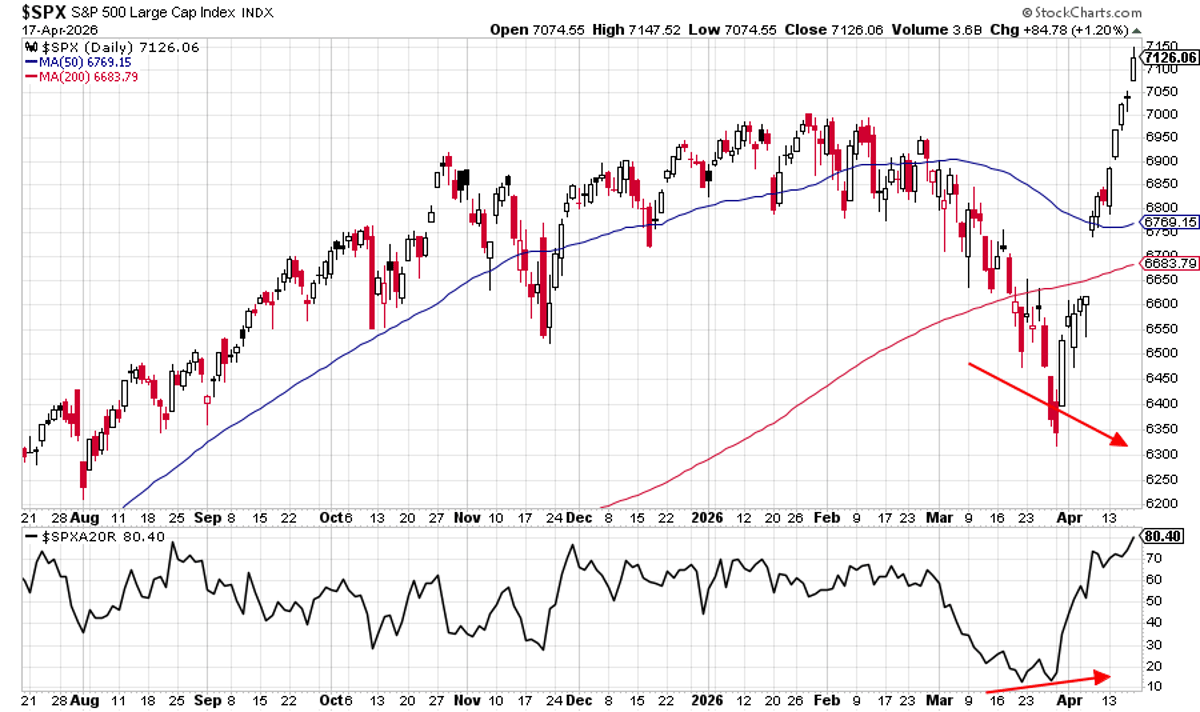
80% of S&P 500 Above 20‑
S&P 500 stocks above their 20-day MA is over 80% currently. One of the big clues a major low as brewing back then was price broke to new lows in late March, while the number of stocks above their 20-day didn't....
Bulls Take Lead as Strait Reopens, Markets Rally
S&P 500, Nasdaq, Dow Forecast for the Week Ahead- Bulls in Charge as Strait Reopens https://t.co/6xWJdHAsUG #SPX500, $NDX & $DJI Weekly charts https://t.co/8FDRdtqzMG
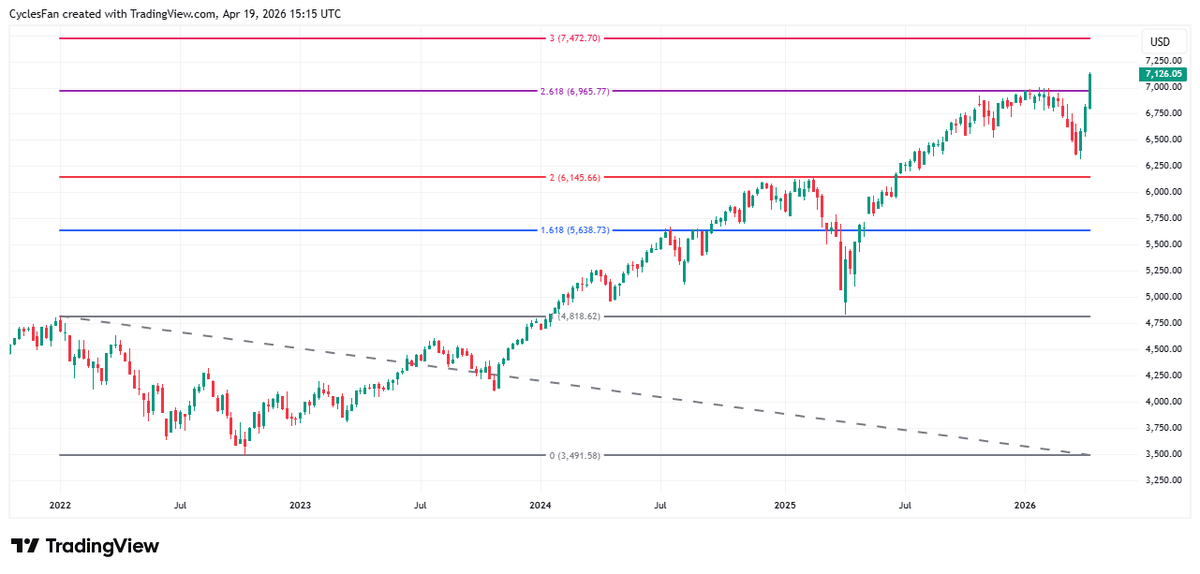
SPX Targets 7473 at Next 3.0 Fibonacci Extension
$SPX - Pay attention to the intermediate term tops it has made at extensions of the 2022 bear market. The July 2024 top at the 1.618 extension. The February 2025 top at the 2.0 extension. The January 2026 top at...
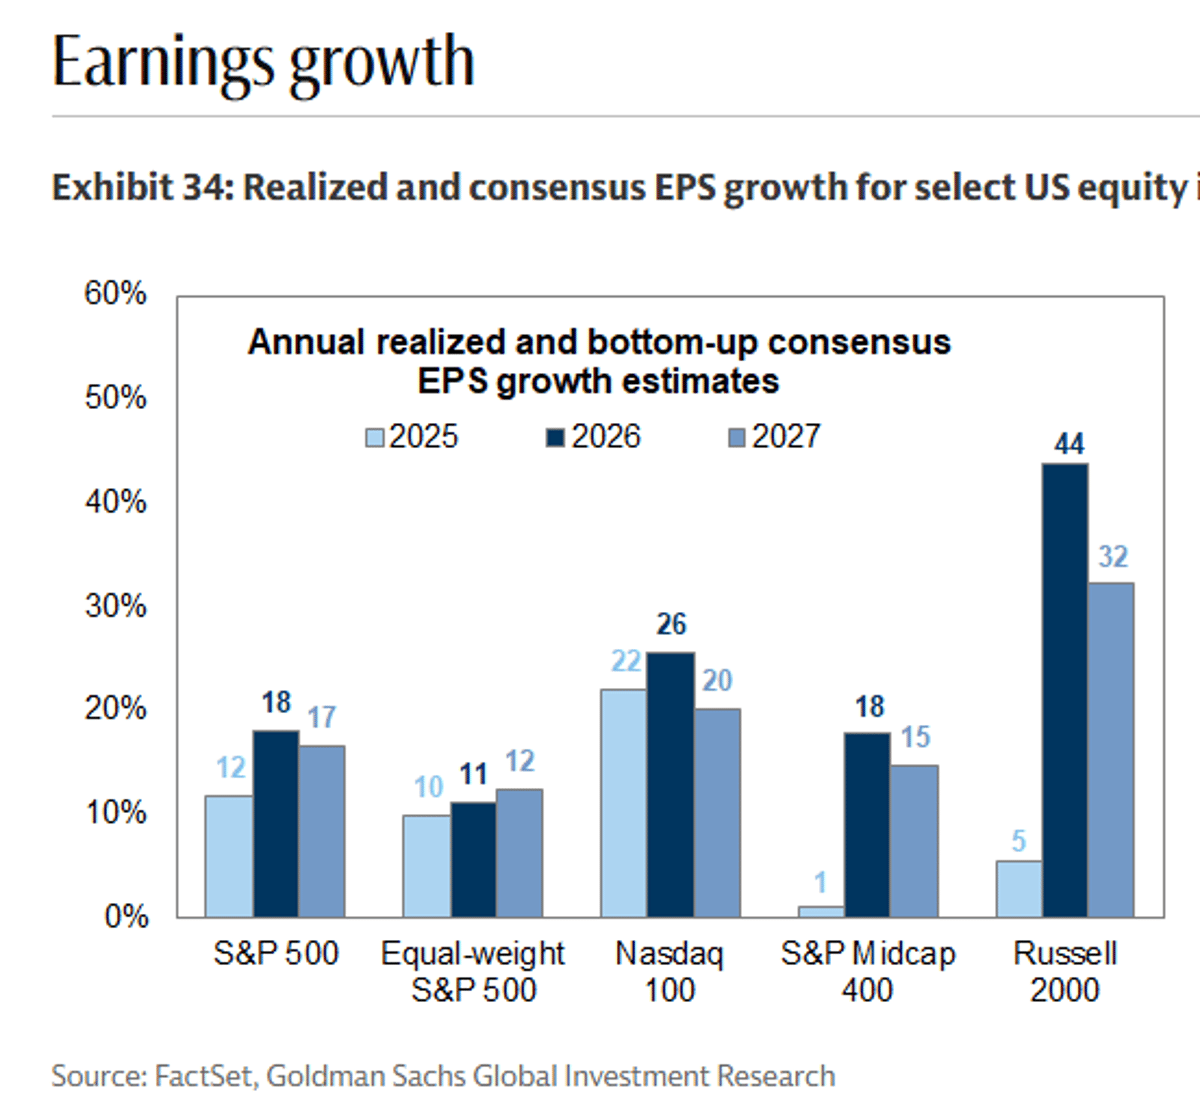
Russell 2000 EPS Growth Outpaces S&P 500
18% S&P 500 EPS growth seen this year... just 11% for the S&P 500 EW. But 44% for the Russell 2000. GS https://t.co/ZYTwDJ60Km
Record Earnings, AI Surge, Dovish Fed Signal Bullish Year
Good time to recall that only 12 times (the dirty dozen) have stocks lost more than double digits during the year and all of them had some very bad things happen. This year we have record earnings and profit margins, AI...
S&P 500's Rare Six‑of‑Eight Day Gap Surge
The S&P 500 has gapped higher in six of the past eight trading days. Going back to 1982, we've only seen that four times before: June-July 2025 January 2025 August-September 2020 January 2018
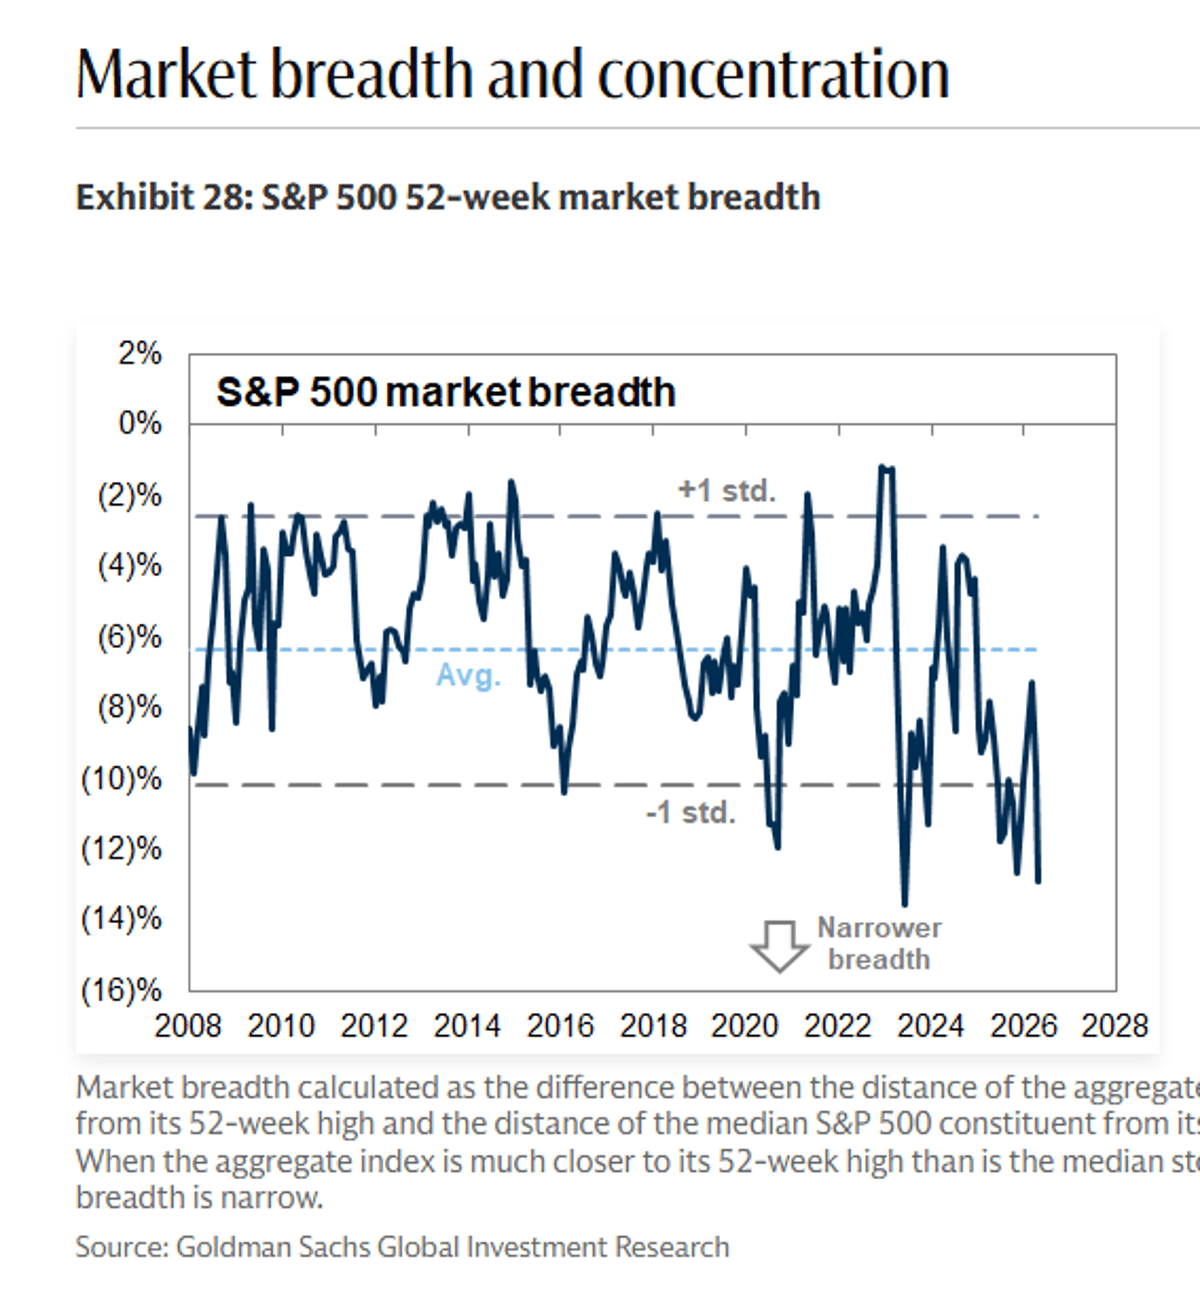
Tech Rebounds as Median S&P Lags Record Highs
This measure shows that the median S&P 500 stock is far below its 52wk high, while the Index is at a record. Practically, it points to major sector rotation in the last 3 weeks, with tech stocks coming storming back.. while...
Nasdaq Surges as Markets Overlook US‑Iran Tensions
My article for the week ahead: Nasdaq and Risk Assets Soar as Markets Ignore US-Iran Questions https://t.co/oj3oTBAvsM https://t.co/XKDWaWJJbx