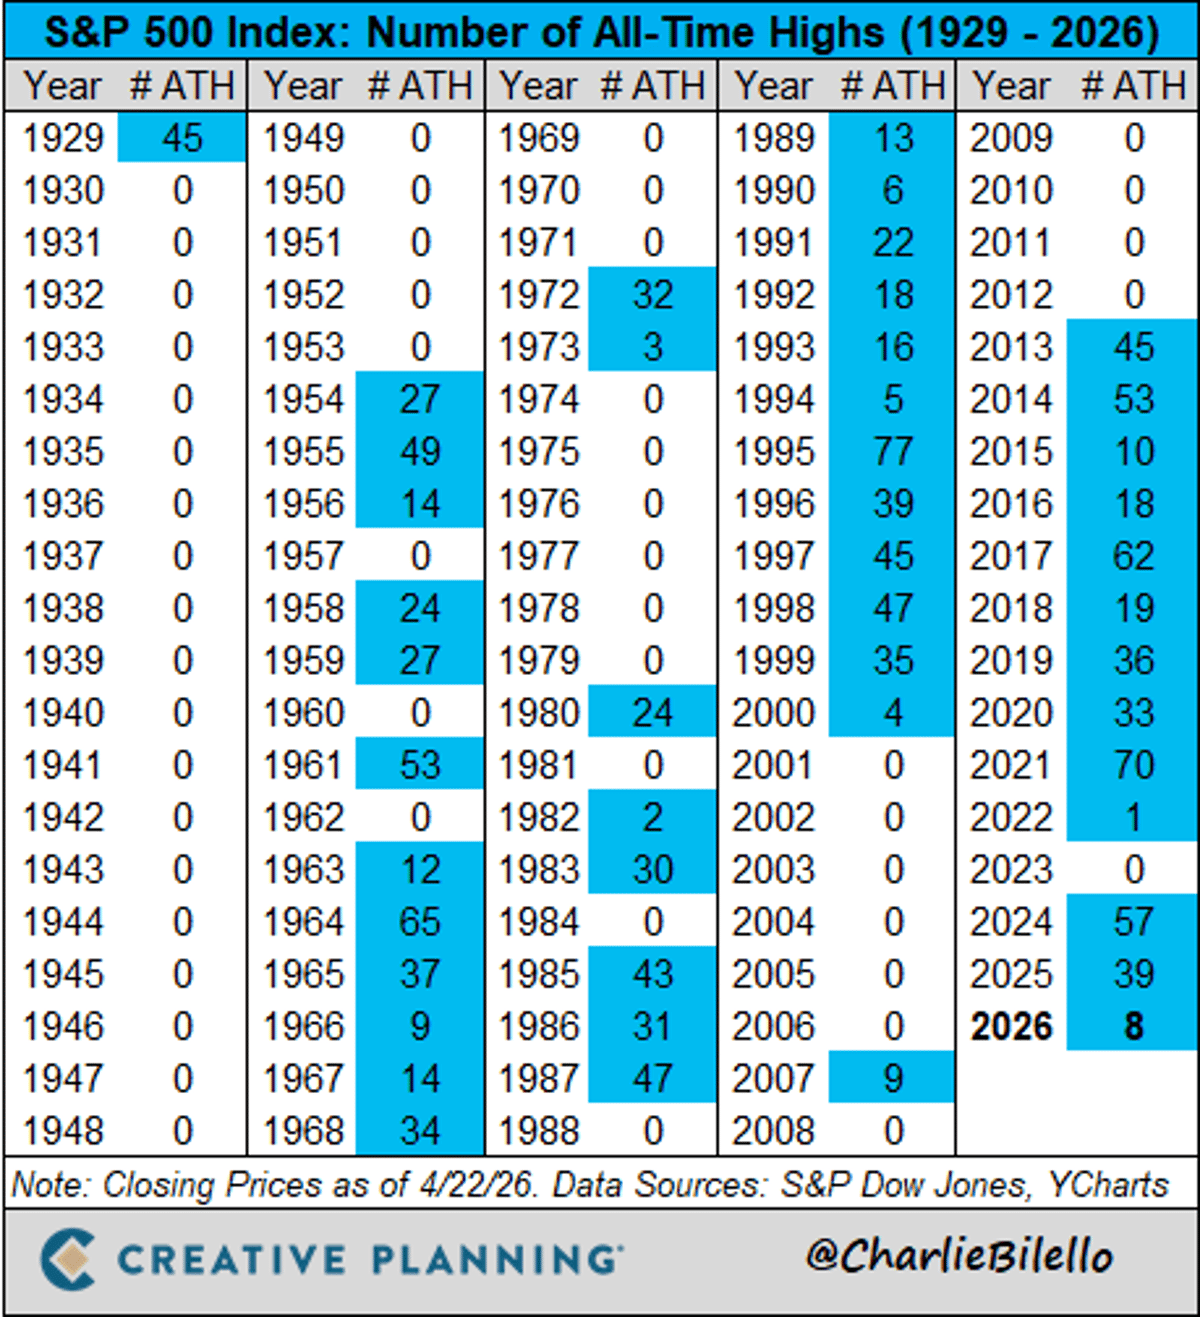
S&P 500 Hits Eighth All‑time High of 2024
The S&P 500 ended the day at another all-time high, its 8th of the year. $SPX Video: https://t.co/RgOn4qX0pE

AI Earnings Prop Up Markets Amid Iran Tensions
Tom Lee Agreed With Me - LOL $SPX Markets are holding up despite geopolitical tension from War in Iran, as strong AI-driven earnings mask economic weakness. Risks from #crudeoil price/supply shocks aren't priced in but narrow leadership is. Seasonality tilts bearish soon... https://t.co/3v10TYbjuc
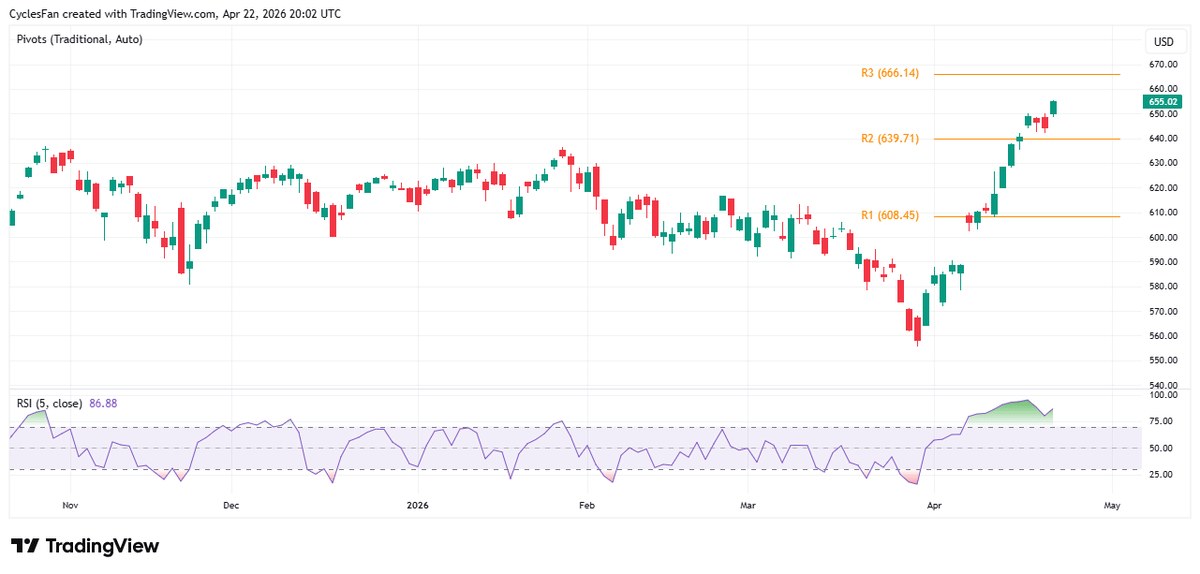
QQQ Hits New ATH; RSI Hints at Possible Pullback
$QQQ - Made another new ATH. Looking at RSI(5), there's a negative divergence that may lead to a pullback at any moment, but it's also possible that there won't be any significant pullback before it gets to the 3rd monthly...
Nasdaq Breadth Thrust Signals Limited Crash Risk
According to SentimenTrader the Nasdaq had a breadth thrust on April 14. Based on that the market is unlikely to crash for the rest of the year, since the biggest drawdown at any point over the next 8 months in...
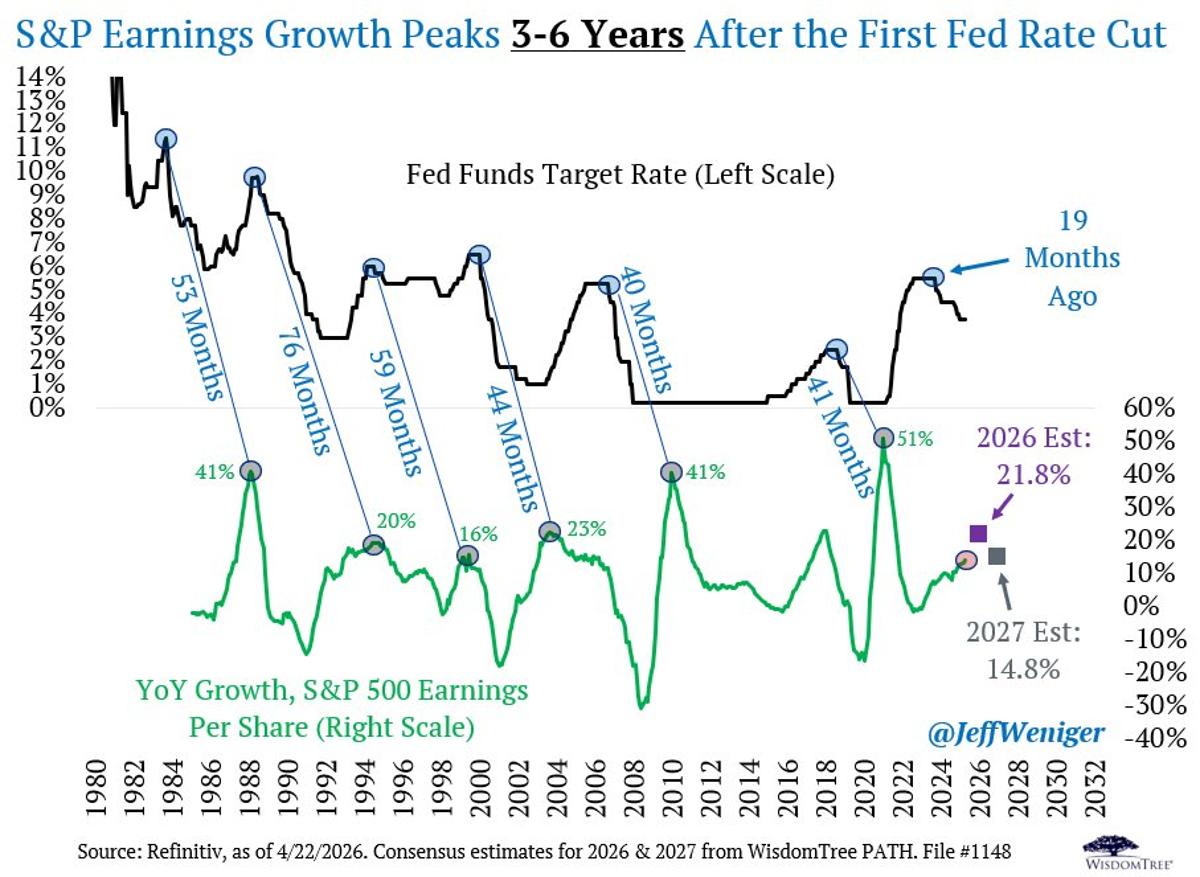
S&P Earnings Growth Likely Peaks 2028‑2030 After Rate Cut
Street consensus, S&P 500 earnings growth: 2026: +21.8% 2027: +14.8% Those are big, tough-to-achieve numbers. But look at the historic record. The S&P's earnings growth rate historically peaked 40 to 76 months after the first Fed rate cut. Yes, forty to seventy-six. Powell...

Turn Pullbacks Into Entry Points, Not Chasing Strength
Stocks keep pushing higher. If you missed the first leg, what do you do now? I walk through how we have shifted gears, why pullbacks now look more like opportunities, and how to buy in without just blindly chasing...
Yardeni Predicts S&P Rebound, Summer Consolidation Ahead
YARDENI RESEARCH IN BLOOMBERG (April 22, 2026) Ed Yardeni became convinced that US stocks were primed for a rebound after the S&P 500 Index had tumbled more than 9% from its record high. Yardeni said the selloff had the feeling of...
SPX Records Smallest Trading Day Since Dec 30 Amid Quiet Rally
We still have a little under 2 hours of trade left in the day; but at present, smallest $SPX trading day since Dec 30th. Dead quiet and at record highs. Nothing going on and no risk apparently... https://t.co/O6XPk2wIlD
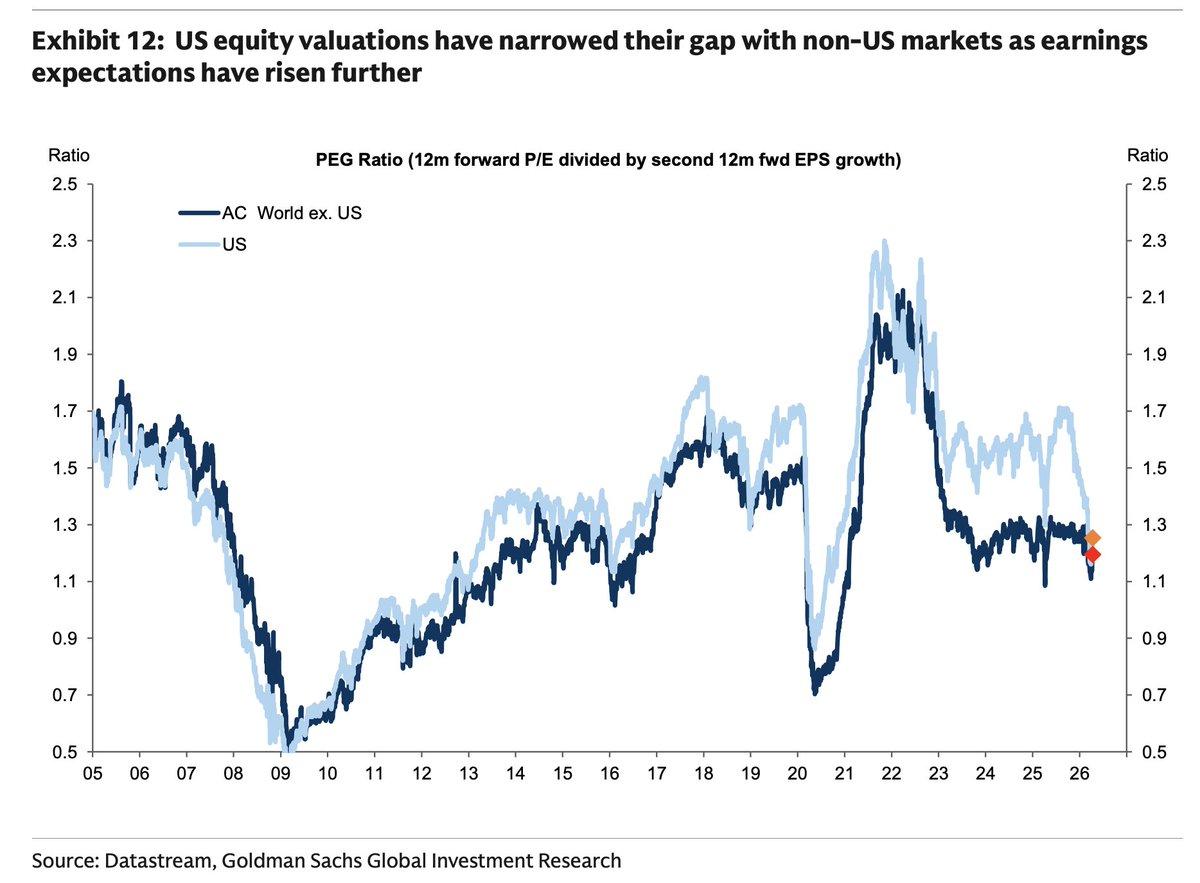
US Valuations Close Gap as Earnings Expectations Rise
"US equity valuations have narrowed their gap with non-US markets as earnings expectations have risen further" - GS https://t.co/hjq1MKlS8K
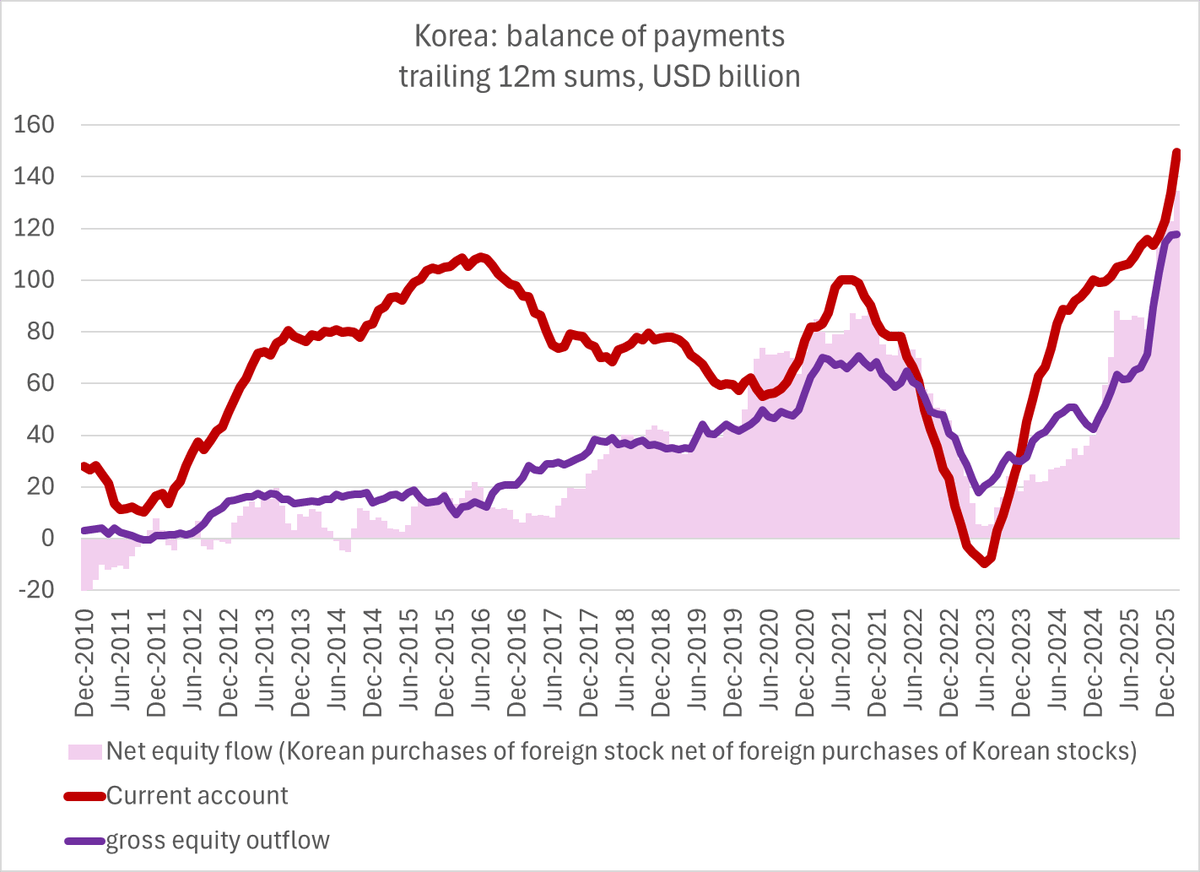
Korean Equities Soar While Currency Fundamentals Crumble
Crazy retail outflows into levered US stock funds -- and a national pension service that is a structural source of weakness in the won (by design) and that the Koreans have had trouble turning off even when it worked at cross...
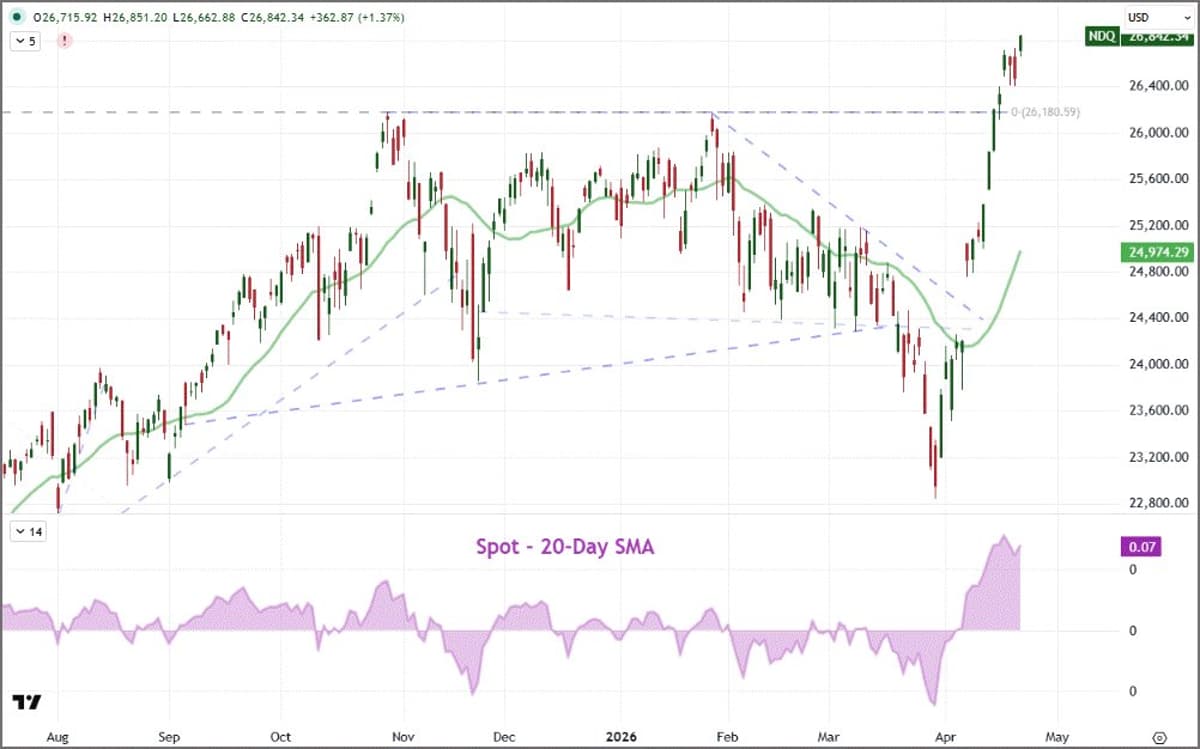
Nasdaq 100 Record High Mirrors Past Bull Trend Starts
The Nasdaq 100 is trading at a new record high - much of the work being done by the bullish gap on the open. Spot is still 7.4% above the 20-day SMA - which is comparable to May '25, Jan...
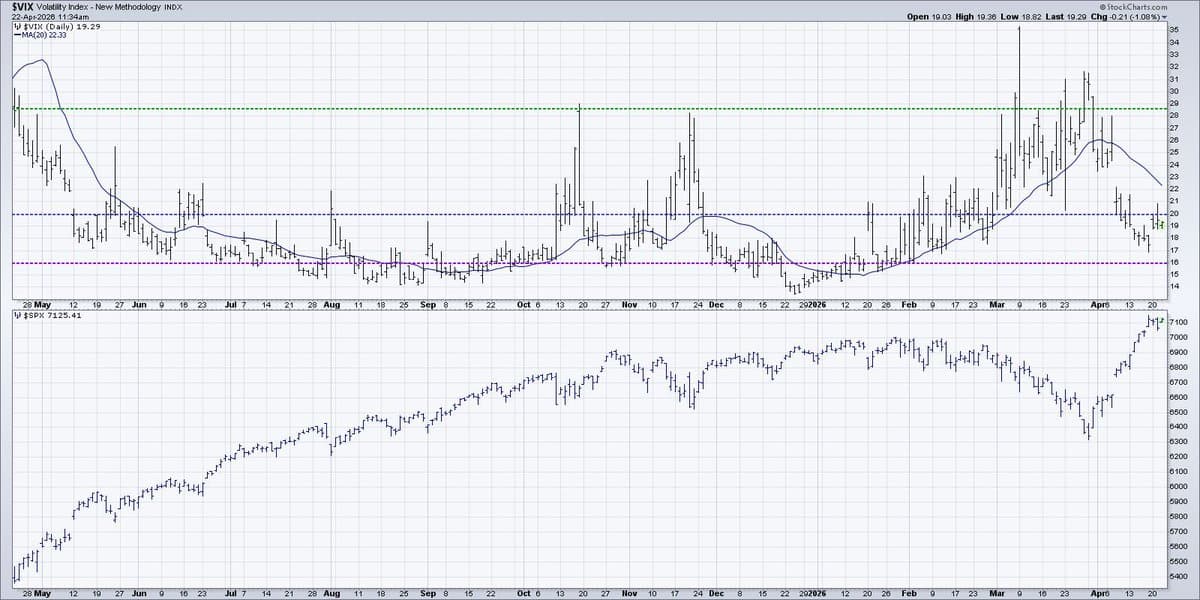
VIX Near 20, Low Volatility Fuels SPX Upside
I'm seeing the $VIX pushing up against the crucial 20 level, but remaining generally below it this week. $SPX over 7K on lower volatility makes a strong case for further upside. Any spike in $VIX over 20 would mean...
AI Rally Propping SPY; Reversal Could Trigger Crash
The only thing holding $SPY up w/ this $USO strength is the fact we're having an AI rally and such heavy weight. If they down turn, look out.
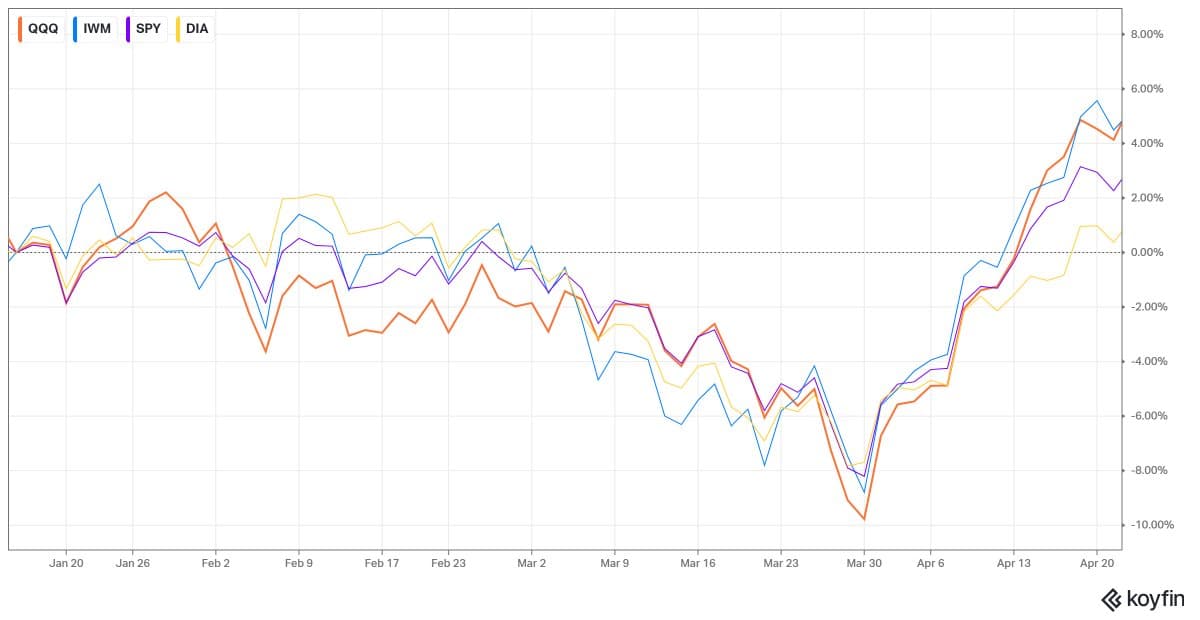
IWM and QQQ Outpace SPY, DIA Lags
Not a lot of separation between $IWM and $QQQ over the last ~3 months. Both ahead of $SPY (for now). With $DIA clearly the laggard... https://t.co/QSDh0FEkCE

High‑valued Headline Stocks Crumble in Market Corrections
Often, the stocks that you see in the headlines have lofty valuations, making them vulnerable during market corrections. https://t.co/U1r9TiakDy
Analyzing S&P Surge and Transport Stocks on CNBC
Excited to join @CNBCFastMoney for the hour today to look at the charts after the explosive $SPX upmove and discuss the action in transports and more #fairleadstrategies
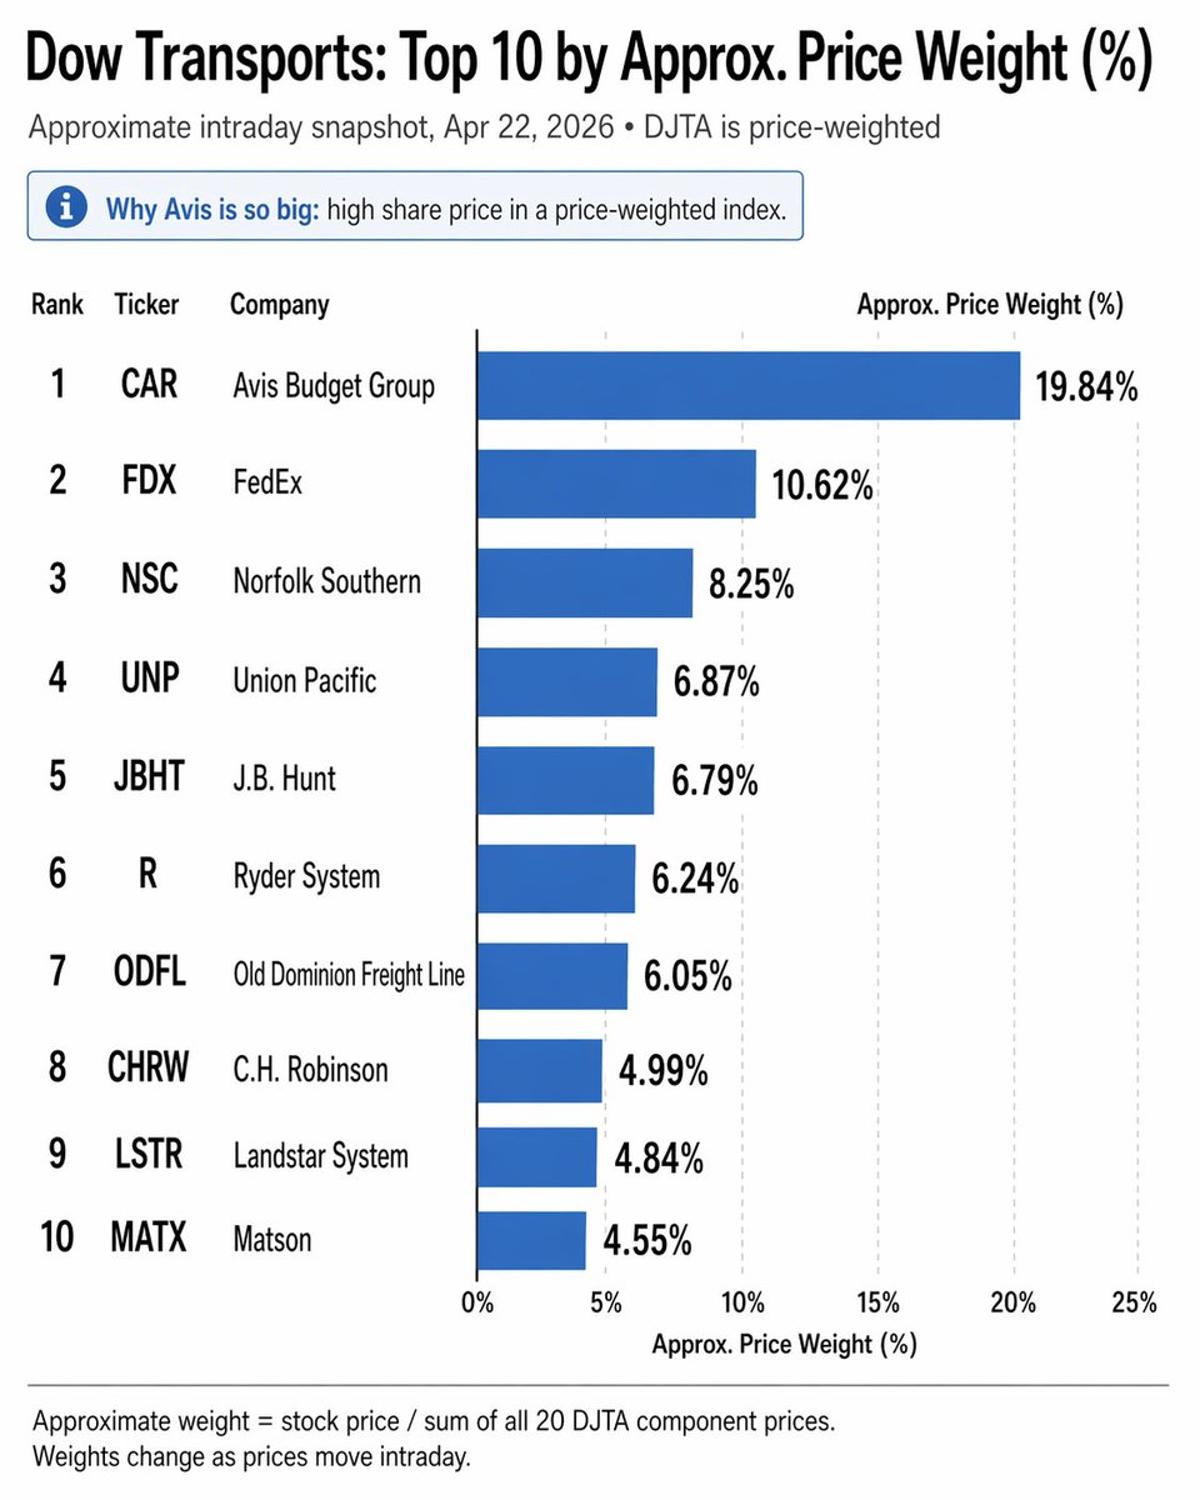
Dow’s Price‑weighted Index Inflates Tiny Avis over FedEx
Fun and stupid fact .. Because Dow uses price-weighted indexes... AVIS is now around 20% of the entire transport index .... Double the weight of FedEx, even though FedEx is 3X larger market cap and was 10X larger than Avis...
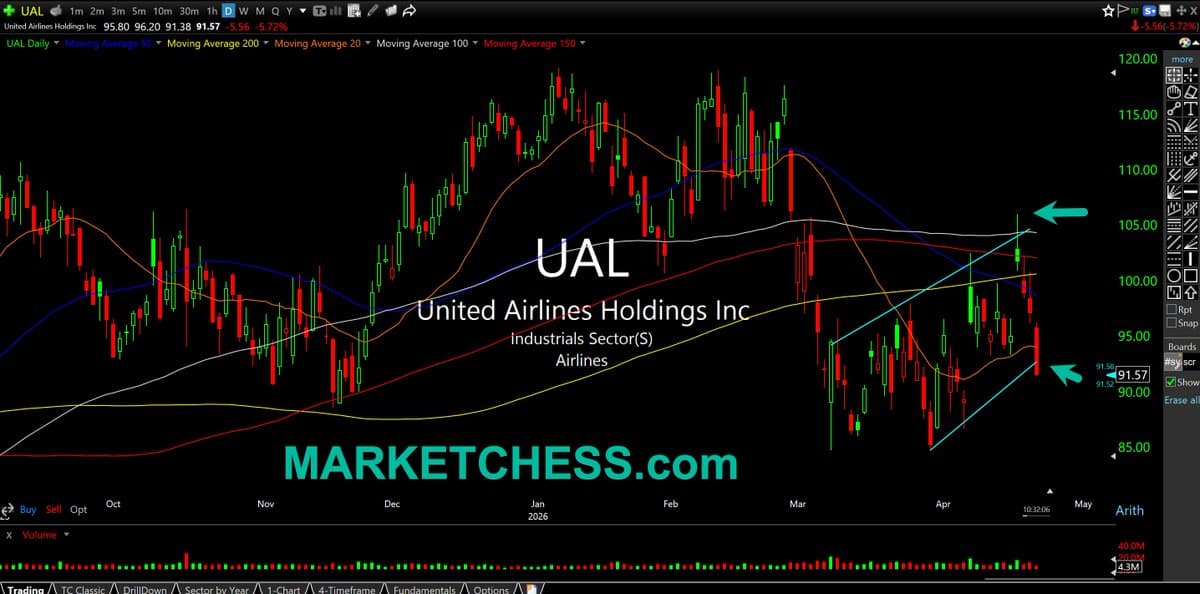
United Faces Rising Fuel Costs and War‑Hit Demand
$UAL Daily. Post-earnings, perhaps an early sign reality creeping into markets: United has serious jet fuel cost issues, coupled with international demand under pressure with ongoing war https://t.co/aLwgC9qngA
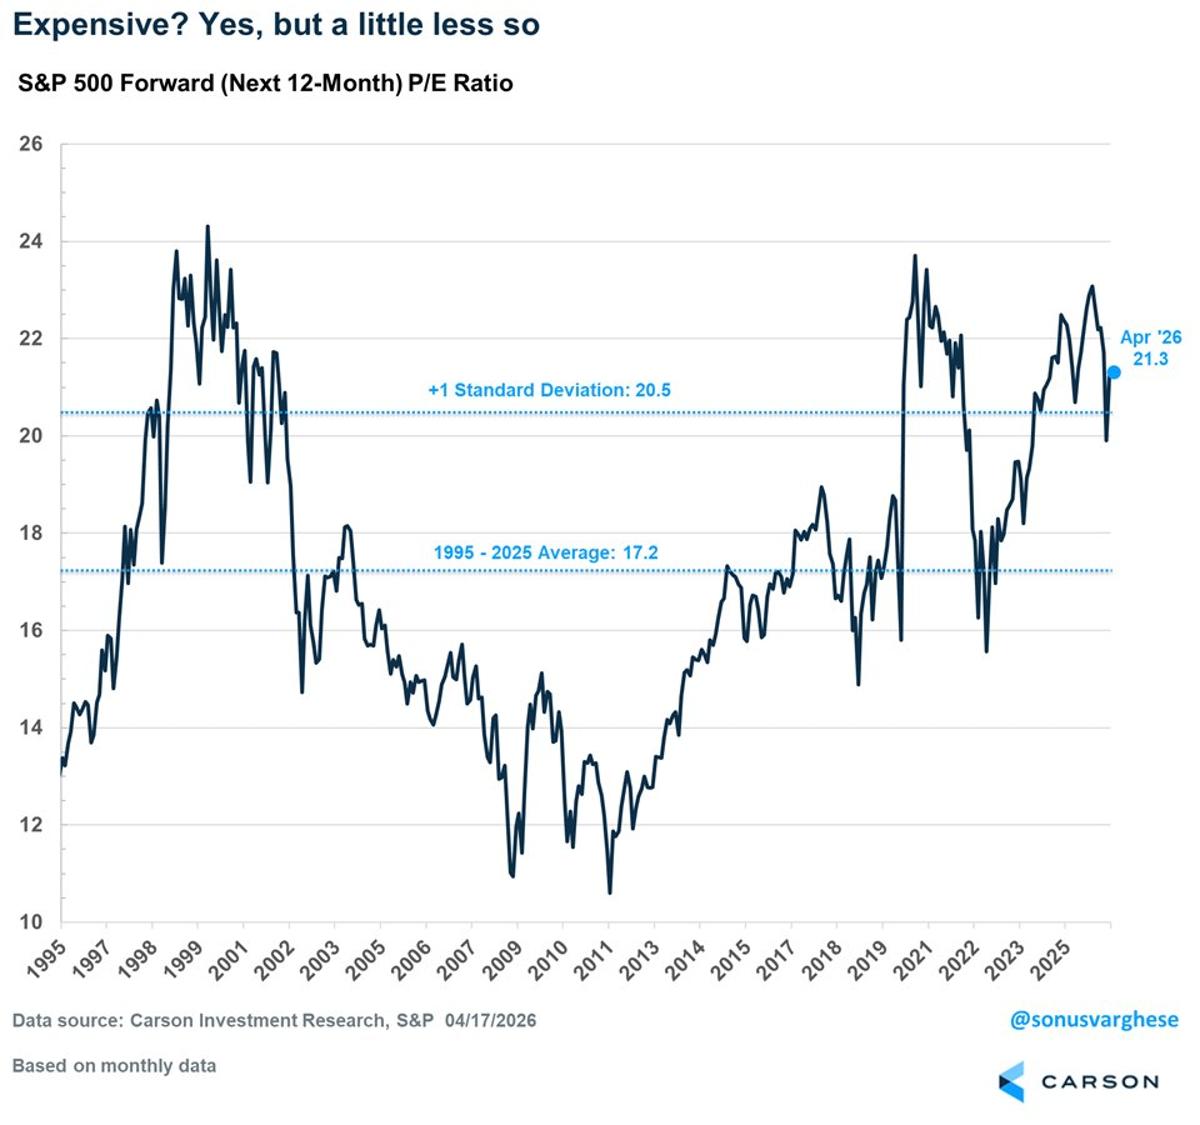
Rising EPS Forecasts Lift Stocks Despite High Valuations
Stocks are somewhat pricey based on history, but not as much as they were at the start of the year. Oh, and EPS and profit margin 12-month estimates have gone vertical. That is why stocks are back to new highs....
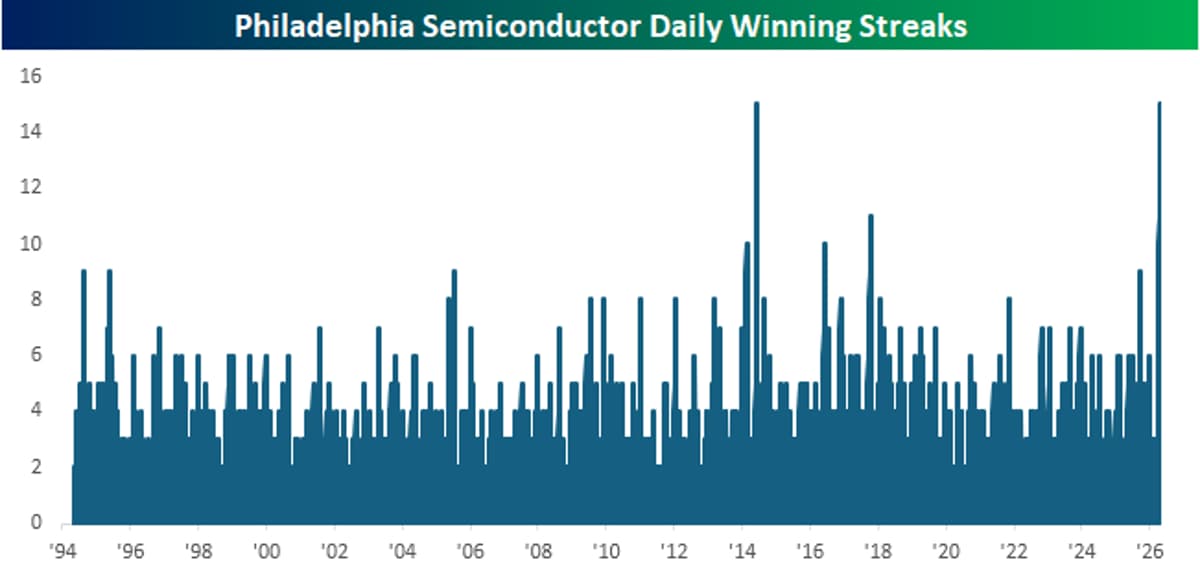
Semiconductor Index Sets Record 15-Day Streak, Eyes 16
Incredible chart from @bespokeinvest in their always must read note this AM. Semis are up a record tying 15 days in a row and looking at futures, we might hit sweet 16. https://t.co/Odd0mVjdX5
10‑Day S&P Rally Historically Predicts 18% Year‑Ahead Gain
Could we see another 2-3% rally in stocks in the next month and another 5-6% in the next 3 months? This data reinforces the bullishness of the latest S&P move 📈 Comment below 👇 Agree or disagree?
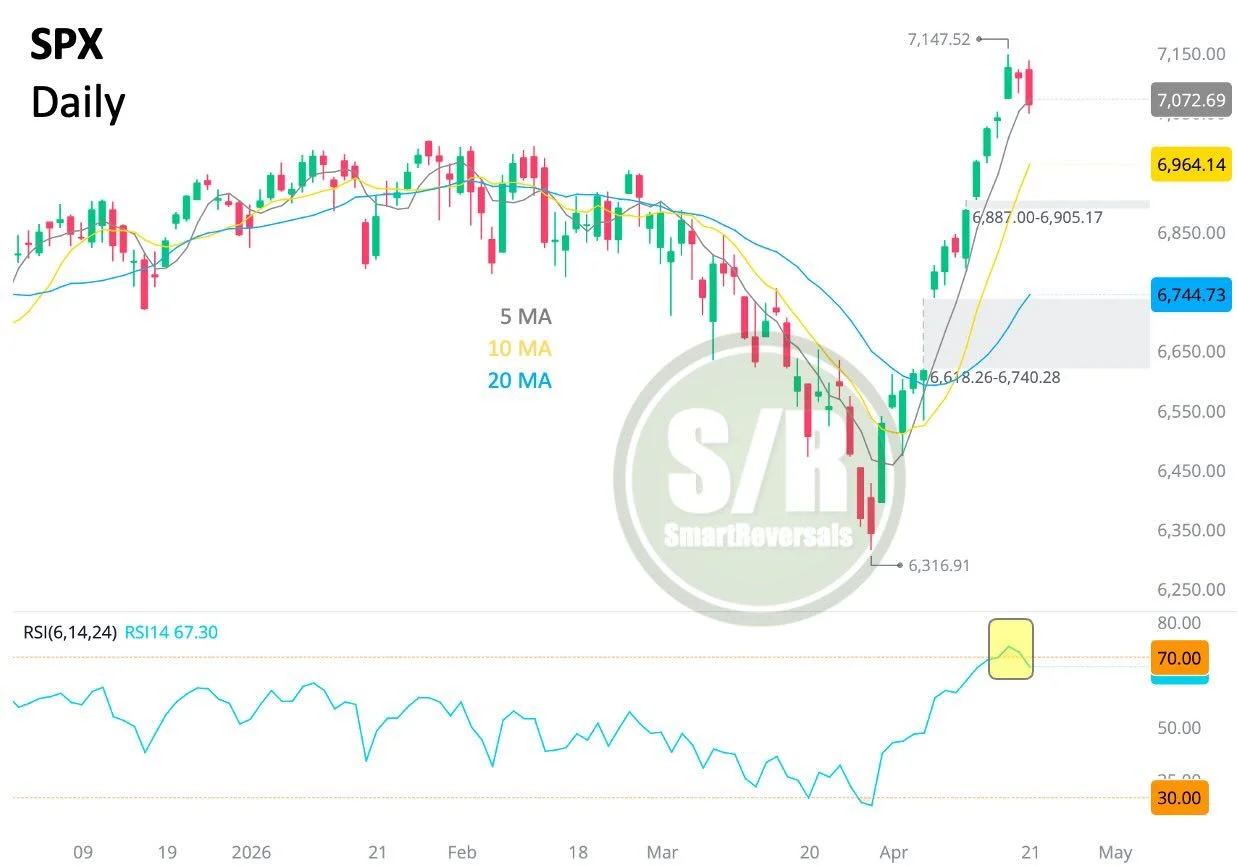
SPX Gap Filled, Bearish Engulfing Signals Pullback
SPX: The gap was filled with a bearish engulfing candle as the RSI fell from overbought levels (70). A tactical pullback/consolidation usually follows. Given the afternoon's indecisive price action, keep a close eye on $7,021; if lost tomorrow, the decline...

VIX Surge Signals Rising Market Volatility
Lots to discuss on markets. #Warsh $VIX #Inflation #Volatility $AAPL. TUNE INTO @CNBC worldwide NOW as I dissect higher $VIX.
S&P Rally Sparks Debate Over Renewed Irrational Exuberance
From near panic a few weeks ago to pigs flying today, it was good to talk with @Chartfest1 again about the S&P 500's rally and whether or not there's still room for stocks to run. Are we already back to...
Mega‑caps Slide, Cuts Won’t Boost Broader Market
In fairness it was either this or a real recession post Covid. I would say w the mega caps now losing ground it's unlikely forcing more cuts would do much either at least in real terms. But it is semi amusing...
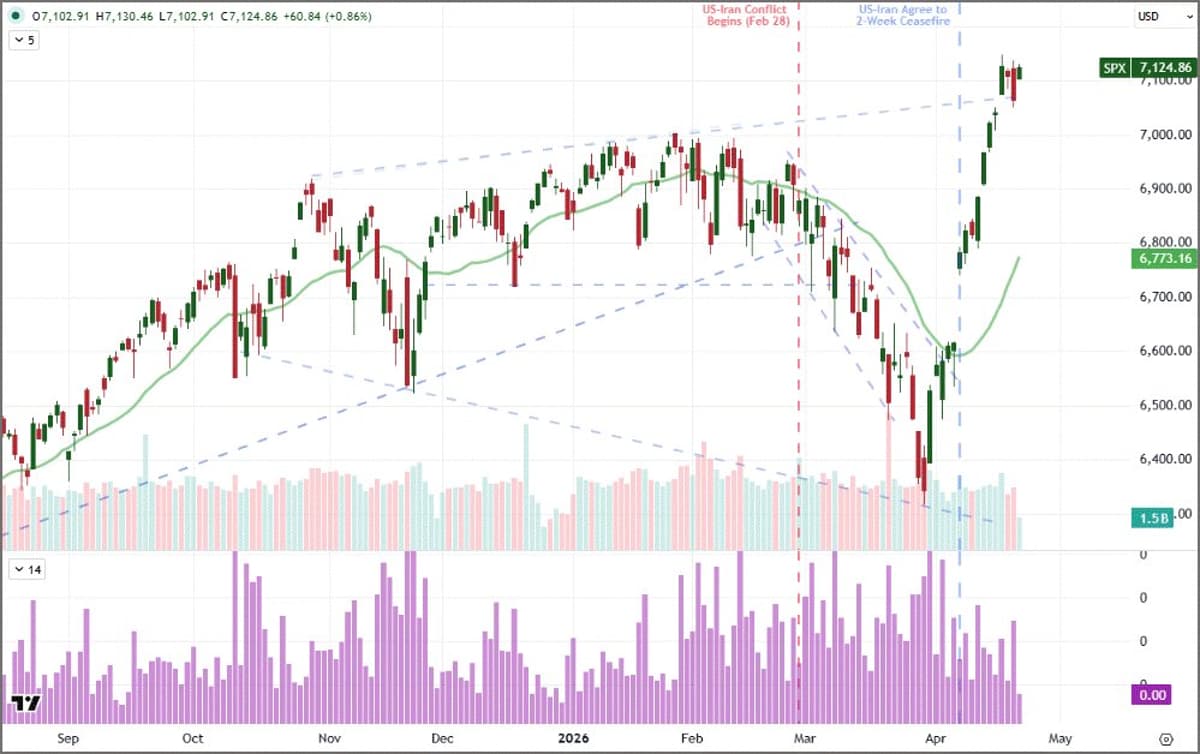
Stocks Slide Despite Trump‑Backed Iran Ceasefire Extension
Daily US stock review — Tues Apr 21, 2026. The market failed its own test today. Trump extended the Iran ceasefire into the close — exactly the kind of headline this tape has been rallying on for two weeks — and...
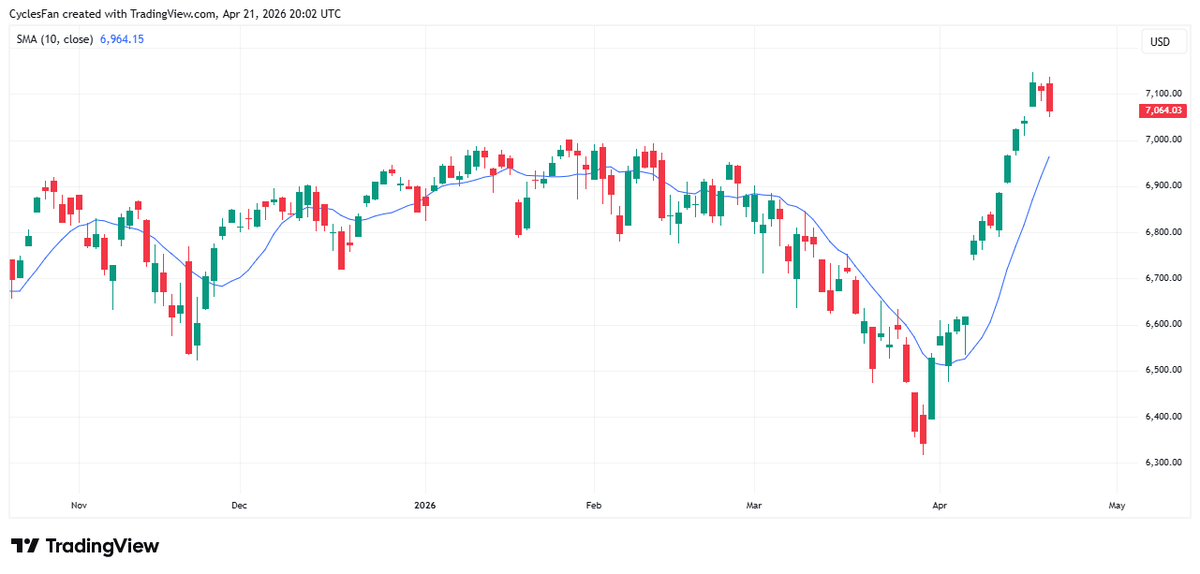
SPX Pullback Targets 10‑Day MA, Jan‑Feb Top Range
$SPX - 2nd down day in a row. It looks like we're having a pullback and the target for this pullback is likely to be the rising 10 day MA which coincides with the topping range from the January-February timeframe....

SPY Faces Dual Gap Fill: Bulls Vs. Bears
$SPY gap fill soon? A couple of them.. one for the bulls and one for the bears... @stockcharts I got gappy in this week's @stockcharts market round-up https://t.co/czBIDE9RHn https://t.co/zDz8o6yPIs

Intel Doubles in Five Months on Steady Uptrend
$INTC: A Boring But Profitable Double In 5 Months I break down how #Intel surged from undervalued levels into a powerful uptrend, holding key support and benefiting from macro tailwinds, while staying constructive despite pullbacks and targeting major resistance levels. https://t.co/LSJkXlxAFW
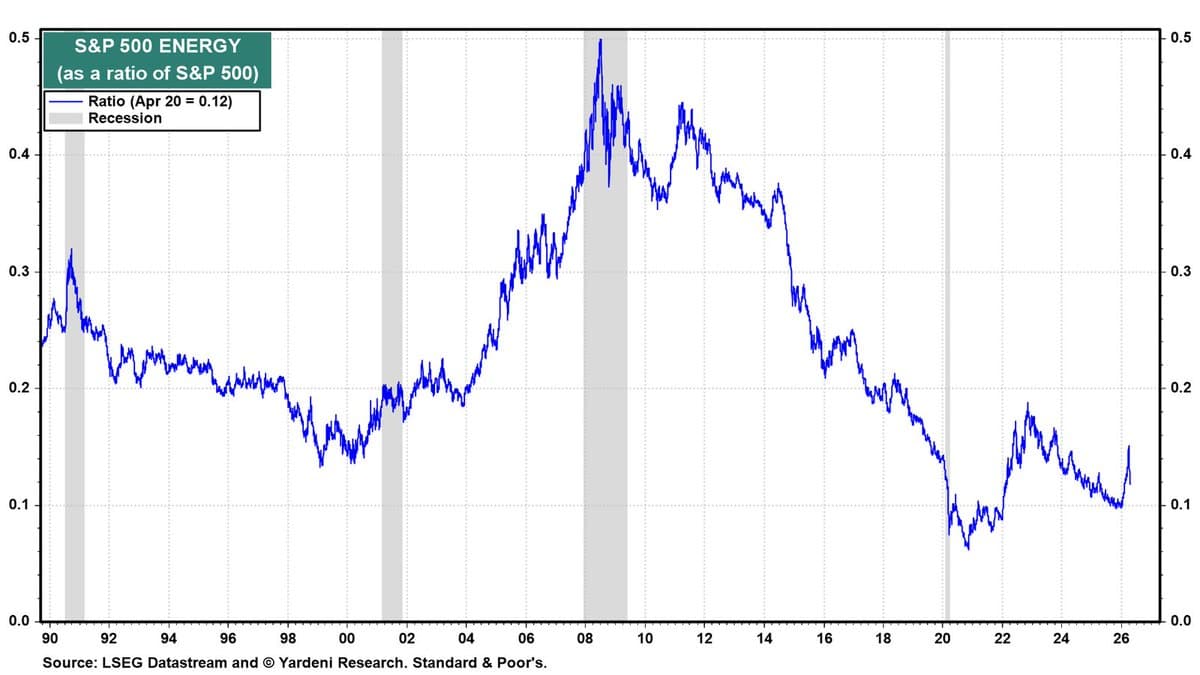
Energy Remains Structurally Under‑Owned in S&P 500
S&P 500 Energy as a share of the total S&P 500. Energy is still structurally under-owned https://t.co/d3AFCGEo9G
Apple Leadership Shift, QQQ Rivalry, Anonymity Ends
🆓 Tuesday links: $QQQ competition, a change at the top of Apple, and the end of online anonymity. https://t.co/t12pIVjfDx chart: https://t.co/8DcLGR5QBr https://t.co/zEpZohRqAc
Half‑trillion Wiped From US Markets in 90 Minutes
🩸 MARKET SHOCK: $500,000,000,000 wiped out from the U.S. stock market in just 90 minutes following Kevin Warsh’s statements. https://t.co/IE25nsCifH
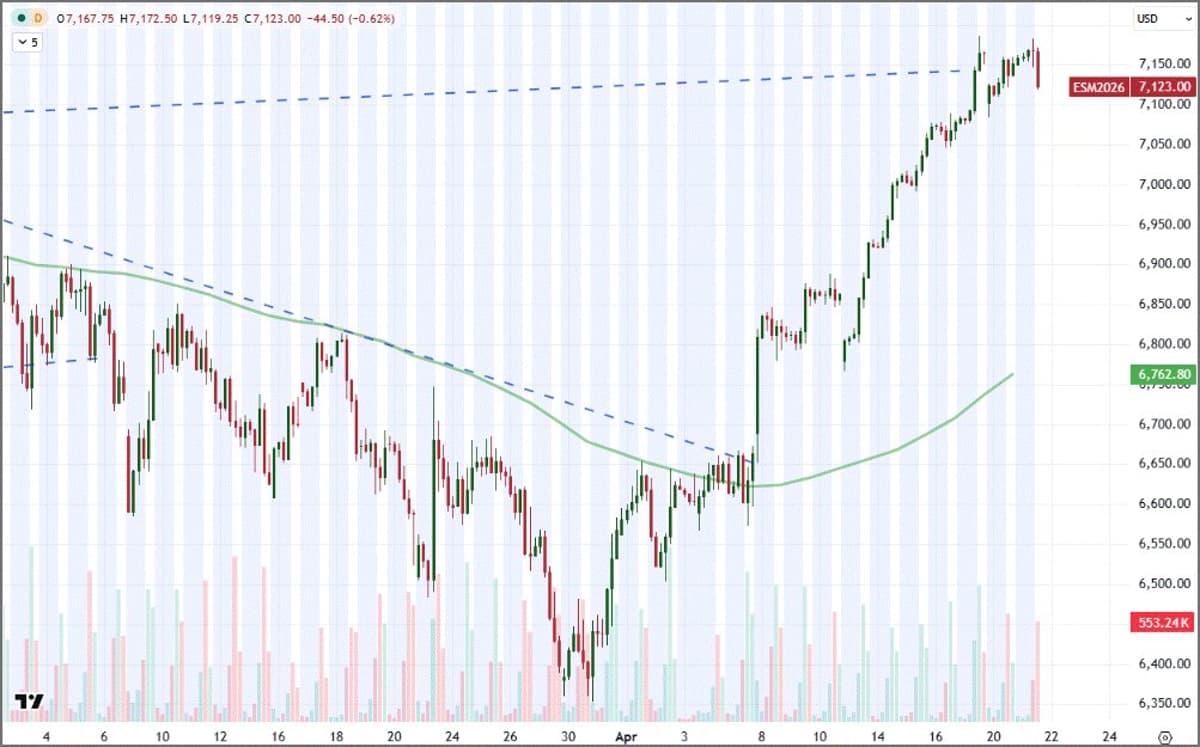
Risk Appetite High, but Fundamentals Could Crumble Soon
I know the market is still charged on risk appetite and more than willing to persist on complacency, but if the fundamental situation starts to breakdown...this 4hr chart of the $SPX emini... https://t.co/wcb9ZHoyFs
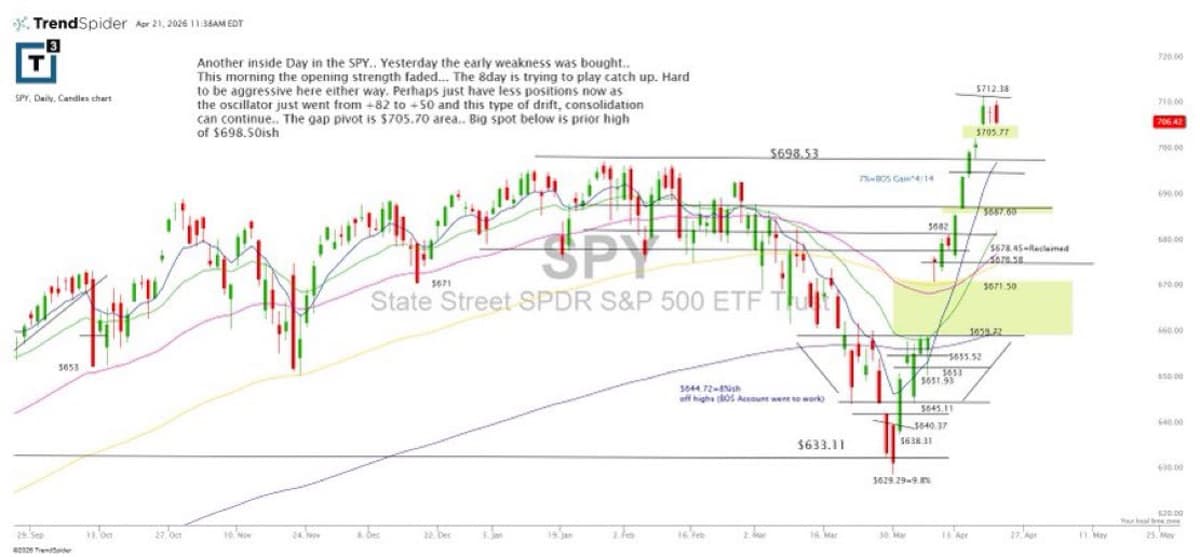
SPY’s Early Dip Bought, Strength Sold—Watch Friday Lows
$spy early weakness was bought yesterday. Today’s strength was sold. Now, watch Friday’s lows for what’s next https://t.co/KBnQ32iHQ0

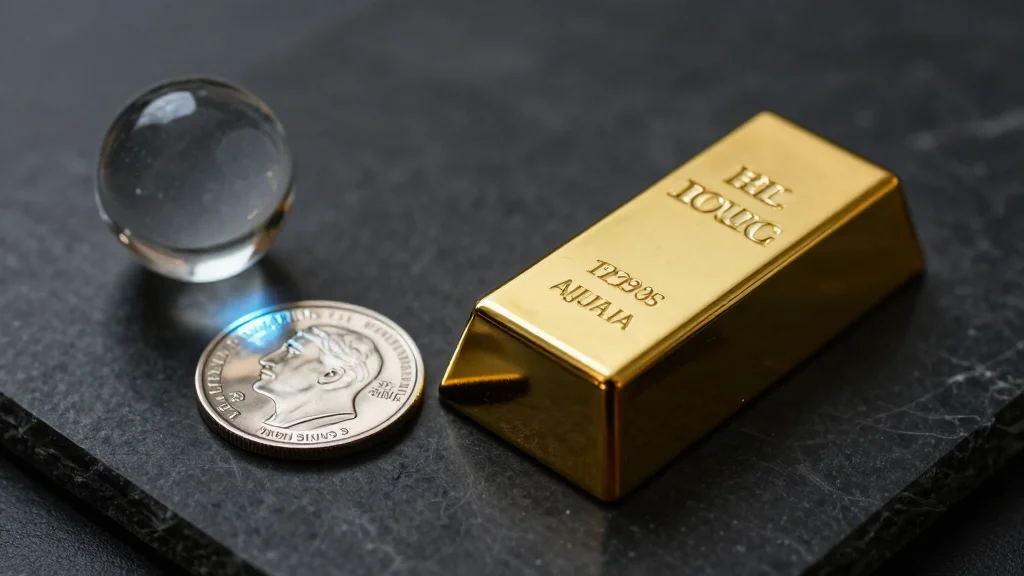
Markets Assume Peace, yet Signals Warn of Uncertainty
Three signals flashed green last week. One flashed yellow. S&P ripped +4.5%. Gold above $4,800. Oil collapsed below $85. The market just priced in peace. What if it's wrong? https://t.co/PPkEJEJRRN
Roku Shares Hit 4‑year High Before Q1 Results
Why Roku Stock Is At A 4-Year High Ahead Of Its Q1 Report https://t.co/1uv0P7WOwz $ROKU
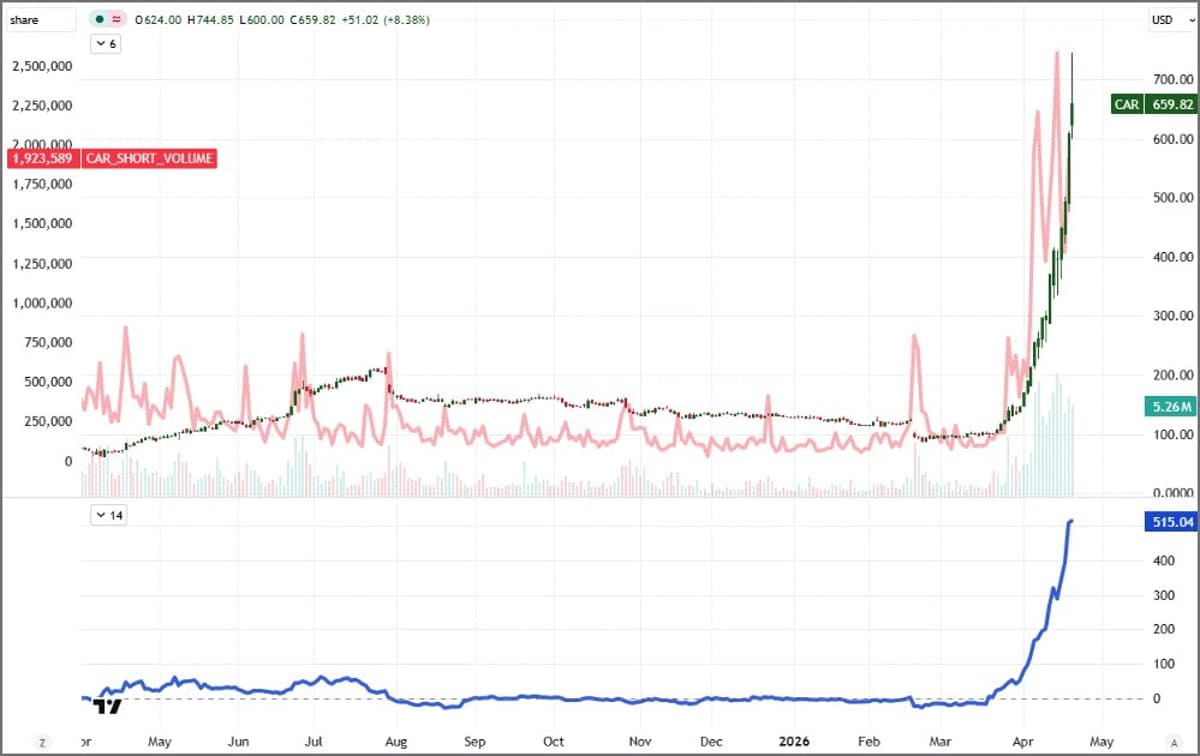
Avis Budget Group's $CAR Surges 500% in Short Squeeze
Impressive short squeeze in the wild: Avis Budget Group. $CAR is up over 500% over the past month and short volume volatility exceptionally elevated: https://t.co/1tCAmuSfgr
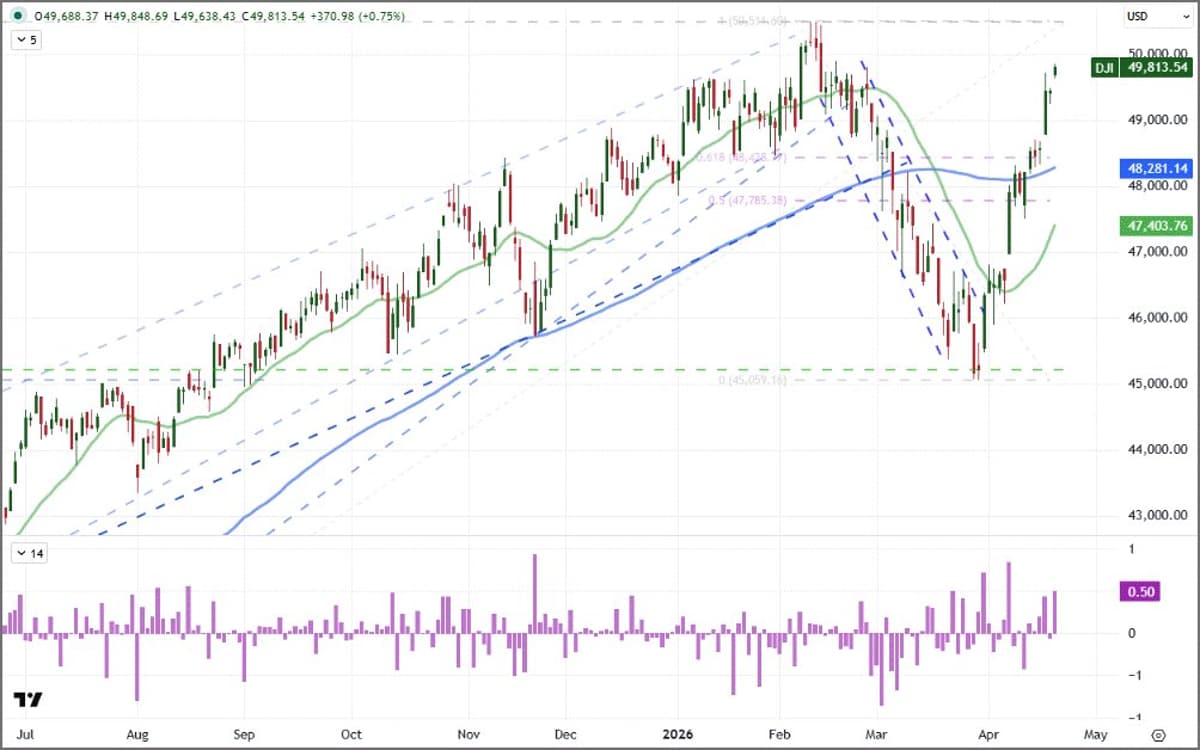
Dow Gaps Up Strongly, Yet Still Below Record
The US indices have gapped up on the open. The Dow's gap looks more productive from a technical perspective. Still not back at record highs for $DJIA though https://t.co/m7jMCR4RF8

Markets Overlook Trump's Iran Threat, Valuations Overstated
THE MARKET IS MISSING WHAT TRUMP JUST SAID 🚨 Dollar ripping. Stocks green. Everyone's chill. Meanwhile: 🔴 Ceasefire deadline pushed to Wednesday evening 🔴 Iran hasn't sent a delegation to Pakistan 🔴 Trump on Truth Social: Iran "broke a lot of the terms" 🔴 Trump on...
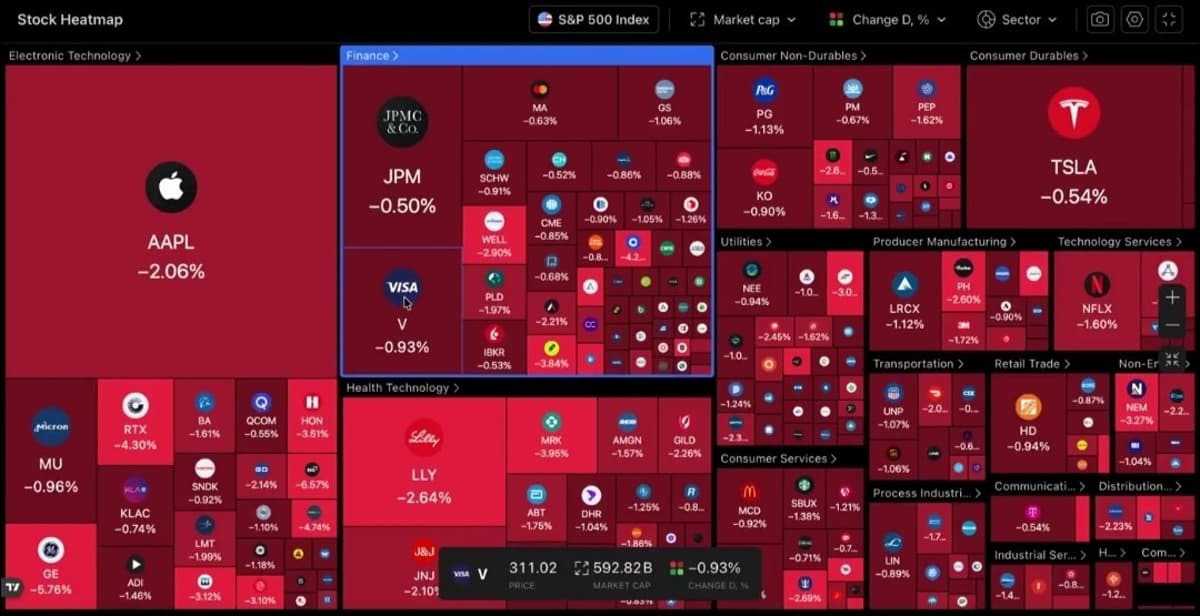
Analyst Slashes Ratings on Nvidia, Apple, Tesla, Others
JUST IN: Tuesday's key analyst calls hit Nvidia, Apple, Tesla, Intel, Reddit, CrowdStrike, Disney, Palo Alto, and others.
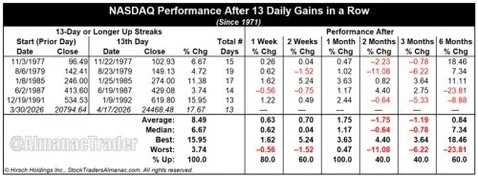
NASDAQ's 13-Day Streak Ends, Still Bullish Outlook
"Although NASDAQ’s daily winning streak has come to an end at 13, its outlook for the next month remains positive." -Jeff Hirsch

Market Surges as Earnings Beat and Strategic Deals Ignite
Another day another run for all time highs, and if you listen closely you can hear $CAR shorts and their tiny little cries. $AAPL announces Tim Cook's replacement come September, and $UNH gaps higher on earnings with a beat and...

Amazon, Apple, GE Aerospace, UnitedHealth Top Premarket Movers
JUST IN: Amazon, Apple, GE Aerospace, and UnitedHealth lead the biggest premarket stock moves, with others following.
CTAs Flood S&P with $8B Daily, $50B by Month‑End
Price-agnostic CTAs are now strong buyers of the S&P 500 and pump $8 bln /day into the market. Until the end of the month, the total increase in S&P exposure could reach $50 bln. There is currently no scenario, where...
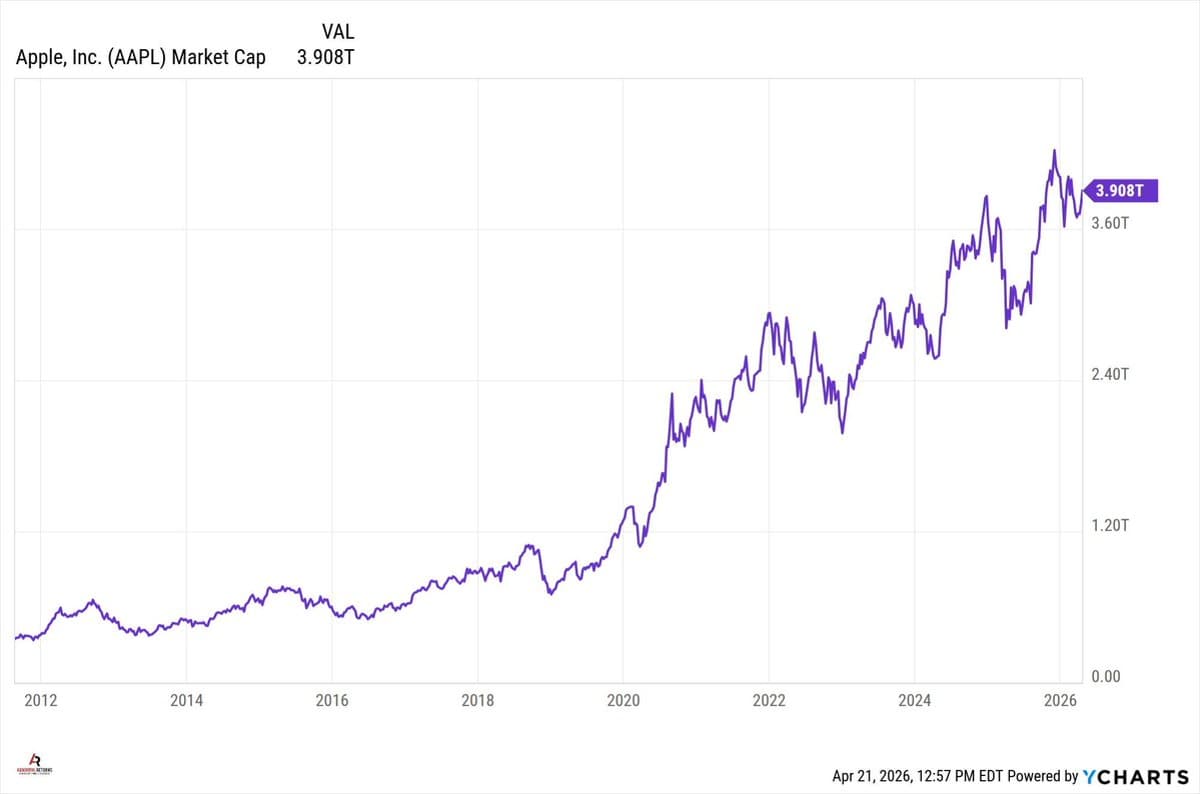
Apple's Flat Premarket Reflects Confidence in June Guidance
Shares of $AAPL flat in the premarket. Sign that investors feel good about the June guide and more importantly that Ternus is the right guy. https://t.co/r2aFrjDjHD
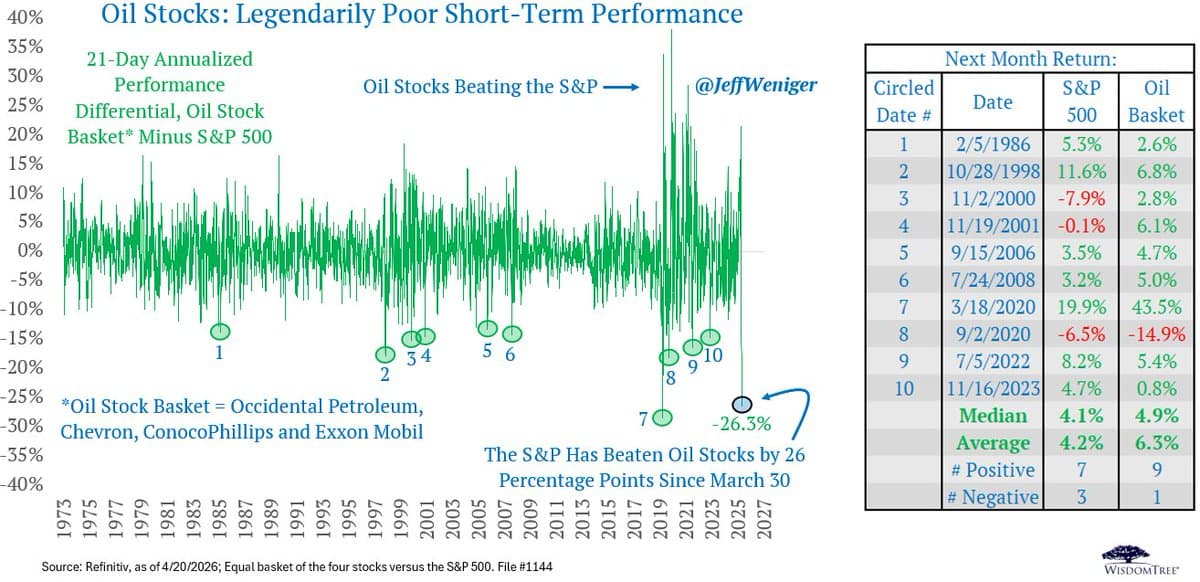
Oil Giants Post 2nd‑Worst 50‑Year Underperformance
Over the last 3 weeks, a basket of ExxonMobil, Chevron, Conoco, and Occidental Petroleum has witnessed its 2nd-worst underperformance vs the S&P 500 of the last half century. Collectively, the market has beaten these four by 26 percentage points since...
Bulls Need Miracle to Achieve 2,505 Net Advances
Breakaway Momentum Watch: Will now take a miracle -- 2550 net advances tomorrow (i. e. no more than 150 declines). But the bulls do have that Whaley Price Thrust working for them...

Tech Earnings Boost Markets, yet Midterm Seasonality Threatens
Mid-Term Playbook Crash-Up Into Correction Strong earnings expectations — led by tech in general & $MU in particular — are supporting market fundamentalists despite the US-Israel War on Iran supply shocks. But don't be complacent: midterm-seasonality has its own ideas. https://t.co/YmHOApOnTX
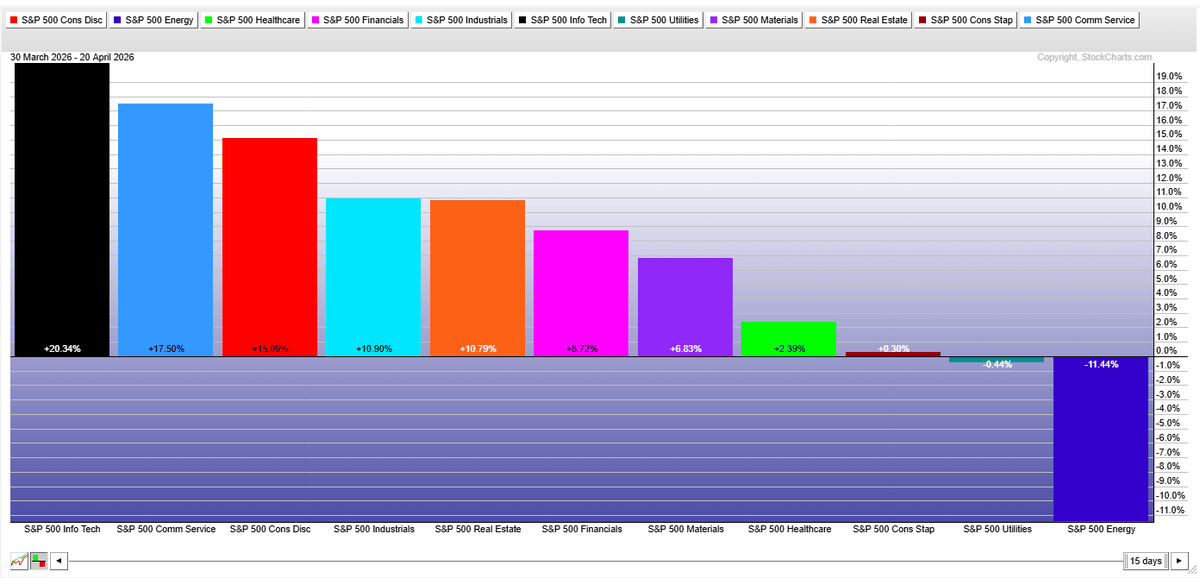
Tech Leads Sector Rotation, Reviving Equity Momentum
"While there was some handwringing about weak breadth over the weekend, it’s important to note that sector rotation has played a starring role in the recent equity drama. Tech stocks have sprung back to life..." More from me on @stockcharts $SPY...

Market Ignores Apple CEO Change Amid Bigger Shocks
Daily US Market Review — Monday, April 20, 2026 Apple changed its CEO for the first time in 15 years today. The market barely blinked — because it was too busy absorbing three bigger shocks: an Iran ceasefire teetering on Wednesday's...