Today's American Stocks Pulse
Goldman Sachs lifts S&P 500 year‑end target, dismisses bubble fears
Goldman Sachs raised its forecast for the S&P 500’s year‑end level, citing continued earnings strength, and said the market is not in a bubble. Analysts also note a potential melt‑up could push the index toward 8,000 if momentum holds.

The Closer – Leaping to New Highs, EIA, Employment – 5/6/26
The S&P 500 surged more than 1% on May 6, 2026, setting a fresh intraday high with the day’s low equal to the opening price. Samsung Electronics broke the $1 trillion market‑cap threshold, and together with SK Hynix now represents roughly half of South Korea’s KOSPI valuation. Meanwhile, underemployment among recent college graduates has risen sharply since the launch of ChatGPT, suggesting AI‑driven labor market disruptions. The moves underscore both equity market momentum and emerging workforce challenges.

Channel 11: Bulls on Parade
Ken Shinoda’s latest Channel 11 update declares a bullish market parade, driven by a near‑20% surge in the Nasdaq in April and strong first‑quarter earnings that beat forecasts by roughly 25%. Semiconductor spending on AI, robust PMI readings and rising commodity prices...

TMTB EOD Wrap
The semiconductor sector led the market, pushing the QQQ index up 2% as semis rose 4.5%. ARM shares jumped 7% after reporting mixed Q1 results but beating license revenue expectations and unveiling its first data‑center silicon, the Arm AGI CPU,...
Wednesday - May 6, 2026
In this 7‑minute Dividend Café market commentary, host Brian Seitel reviews a strong market follow‑through driven by lower oil prices, positive earnings surprises, and better‑than‑expected private payroll data. He highlights that the Dow, S&P 500, and Nasdaq posted notable gains,...
Nasdaq Jumps to New High on AMD Earnings: Stock Market Today
U.S. equity markets surged on Wednesday as the Nasdaq hit a fresh record of 25,838, buoyed by a tentative Iran‑U.S. cease‑fire outlook, robust ADP payroll data and a sharp 7% drop in oil prices. The S&P 500 rose 1.5% to 7,365...

Schwab US Large‑Cap ETF Hits 12‑Month High, Institutional Buying Accelerates
Schwab's U.S. Large‑Cap ETF (SCHX) surged 0.8% to a new 12‑month high, trading near its 50‑day moving average of $26.80. The rally coincided with fresh buying from several hedge funds and advisory firms, underscoring growing demand for broad large‑cap exposure.

Dow Reaches 50,000. There Have Been 4 Closes Above the 50K Level
The Dow Jones Industrial Average broke the 50,000 psychological barrier, closing above it for four consecutive days in early February before a sharp correction pulled it down nearly 10% to a March low of 45,166.64. Over the next 27 trading...

NASDAQ Index Traded to a New Session High. S&P and Dow Now up over 1%
The Nasdaq surged 1.58% to 25,726, hitting an intraday high of 25,741.14, while the S&P 500 rose 1.10% and the Dow gained about 1.02% near the 49,800 level. Large‑cap technology and growth stocks led the rally, with AMD and Super...

Economist Gary Shilling Says 2026 U.S. Recession Is “Almost Inevitable”
Veteran economist Gary Shilling warned that a U.S. recession is “almost inevitable” by the end of 2026, pointing to a stalled housing market, collapsing capital expenditures and a fragile consumer base. His comments add a contrarian voice to the prevailing...

Micron Tops $700 B Market Cap After Debut of 245TB SSD
Micron Technology’s stock surged 11% on Tuesday, pushing its market capitalization above $700 billion for the first time. The rally follows the company’s rollout of a 245‑terabyte SSD, the highest‑capacity drive on the market, and reflects accelerating demand for memory in...

AB InBev Q1 2026 Revenue Up 5.8% to $15.3B, EPS Jumps 20.8% to $0.97
Anheuser‑Busch InBev reported first‑quarter 2026 revenue of $15.3 bn, a 5.8% increase year‑over‑year, while underlying earnings per share rose 20.8% to $0.97. The results, driven by megabrand strength and premium‑price growth, beat analyst expectations and reinforce the brewer’s bullish outlook for...

AMC Entertainment Q1 Revenue Surges 20% to Over $1 B as Box‑Office Rebounds
AMC Entertainment posted first‑quarter 2026 revenue of more than $1 billion, up 20% from a year earlier, as a revived box‑office lifted attendance 13% and turned adjusted EBITDA positive. The results underscore a broader theatrical recovery and set a bullish tone...
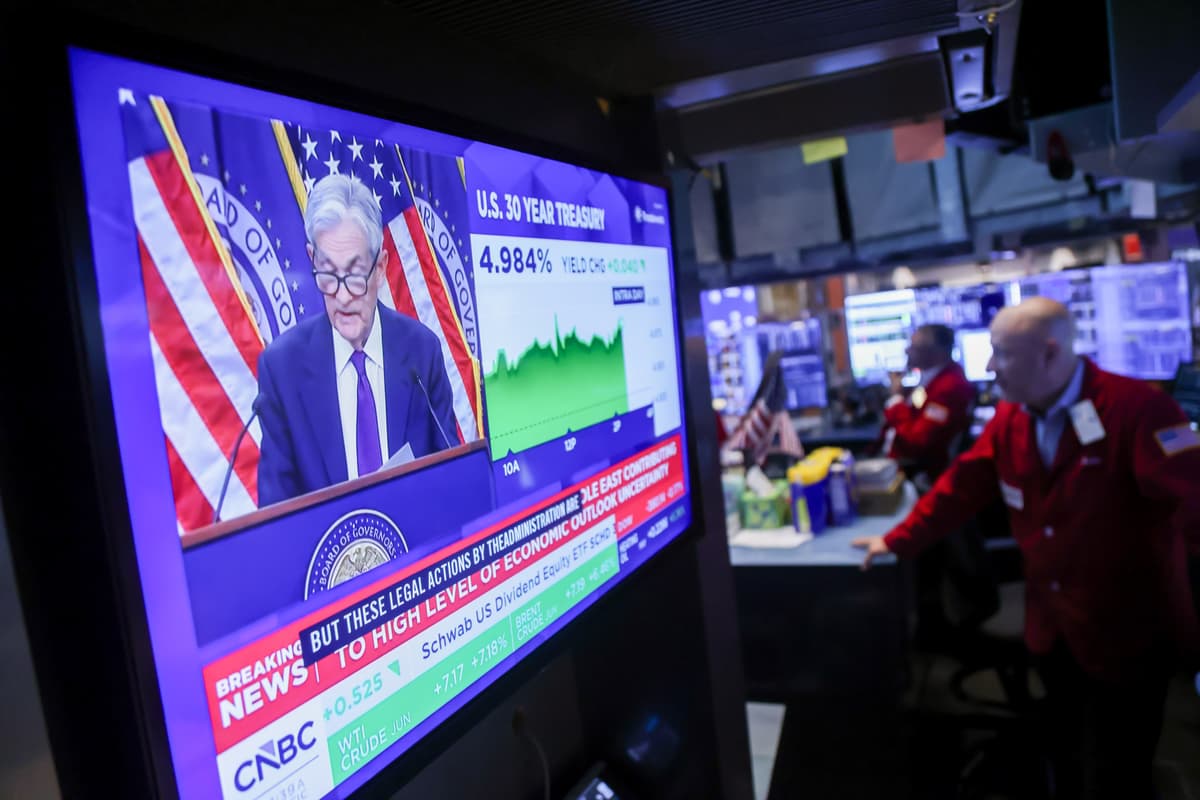
Time to Fight the Fed? Stocks Rally Faces Dashed Rate-Cut Hopes
Wall Street’s recent rally is being tested as a hot labor market and soaring oil prices have erased most expectations of a Federal Reserve rate cut this year. Bond traders now see a higher probability of a rate hike, especially...

Where Is Money Flowing Today?
The latest Finviz treemap shows capital flowing into AI chip makers and renewable‑energy firms, while rate‑sensitive financials and consumer discretionary lag. Double‑digit percentage gains dominate the technology sector, reflecting strong earnings and continued hype around generative AI. Energy stocks benefit...
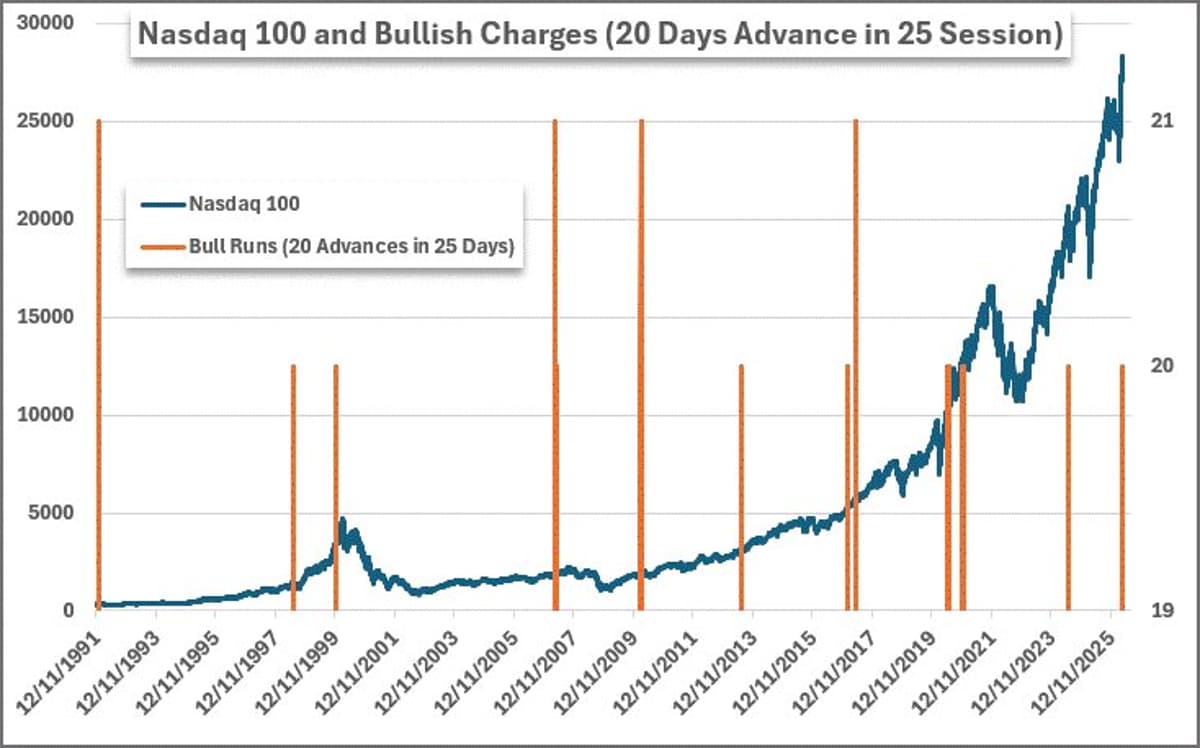
Nasdaq 100 Posts Rare 20‑of‑25 Up Streak
The Nasdaq 100 gapped up another 0.8% on the open with suggestions that the US and Iran are closing in on a deal. Impressively, in the past 25 trading days, NDQ has advanced in 20 of those session. Last time...
Unfilled Gaps at New Highs Signal Strong Trend
$SPY would have to decline to 725.04 and $QQQ to 682.77 to fill this morning’s gaps. How quickly they get filled -- if at all – gives us an idea of how strong the underlying trend is. We already know...

OANDA Forecasts Risk‑On Rally Lifts Nasdaq 100, China A50 and AUD/USD in May
OANDA projects that a renewed risk‑on appetite will push the Nasdaq 100 up 22% from its March low, lift China’s A50 by roughly 7%, and sustain a bullish trend in the AUD/USD pair throughout May. The outlook rests on strong...

Goldman Sachs Keeps S&P 500 Target at 7,600, Warns on Energy and Inflation
Goldman Sachs strategist Tony Pasquariello reaffirmed a 7,600 year‑end target for the S&P 500, noting five straight weeks of gains and robust earnings. He cautioned that higher energy prices and lingering inflation could curb the Federal Reserve’s ability to cut...

Peace Hopes, Disney Earnings, Dismantling Spirit Airlines and More in Morning Squawk
U.S. and Iran are close to a 14‑point peace proposal, sending stock futures higher and pulling oil prices lower, while President Trump warned of a harsher response if talks fail. Technology stocks surged, highlighted by Micron’s SSD launch that lifted...
Alchemy Markets Analyst Predicts Dow Jones to Dip Below 48,500 on Elliott Wave Correction
Alchemy Markets analyst Zorrays Junaid warned that the Dow Jones Industrial Average could slide to a 47,800‑48,400 range, extending a multi‑week correction identified by Elliott Wave analysis. The forecast hinges on a gap‑fill rally between 49,441 and 49,497 before the...
Wall Street Just Broke a 20-Year Seasonal Habit—And It’s a Massive Signal for the Economy
Analysts lifted the S&P 500 bottom‑up earnings estimate for the second quarter by 2.1% in April, to $80.47 per share—the biggest upward revision in five years. Historically, the first month of a quarter sees analysts trim forecasts by about 0.9% over...
Stock Market Today: Nasdaq, S&P 500 Hit New Highs On U.S.-Iran Hopes; Cathie Wood Sells Advanced Micro, CoreWeave (Live Coverage)
U.S. equity indexes posted a second straight day of gains, with the S&P 500 and Nasdaq closing at fresh record highs as optimism grew around a potential U.S.–Iran peace framework. Oil prices fell sharply and 10‑year Treasury yields slipped, reflecting reduced...
Apple-Intel Chip Deal Sends Intel Shares 14% Higher, Boosts Tech Indexes
Apple announced talks with Intel and Samsung to produce chips in the United States, prompting Intel shares to surge 14% to an all‑time high. The news lifted the Nasdaq 1.01% and pushed the S&P 500 toward a fresh record, underscoring...

Momentum Factor Roars As War Fears Fade On Wall Street
Momentum‑focused ETFs have outperformed the broader market since the Middle East conflict began on Feb. 28, with the iShares MSCI USA Momentum Factor ETF (MTUM) climbing over 14% versus the S&P 500’s 5.3% gain. High‑beta (SPHB) and micro‑cap (IWC) funds also posted...

US‑Iran Tensions Fail to Halt Oil Dip as Wall Street Hits Record Highs
U.S. and Iranian forces clashed in the Strait of Hormuz on May 5, 2026, yet Brent crude fell 4% to $109.87 a barrel. At the same time, the S&P 500 and Nasdaq posted record‑high closes, buoyed by strong earnings from...

UC Stocks Only If You Embrace No Exit
🌅 सुबह की खबर, trader edition: US: Nasdaq +1% ATH | S&P +0.8% GIFT Nifty +186 pts → bullish open Crude $108 (-2%) | Iran 2-wk ceasefire AVI Polymers – 12th UC in a row CMP ₹23 | Zero debt | P/E 10 Trigger: AI HealthTech...

S&P 500 Breaks Above 6,620, Analysts Forecast Wave‑5 Rally to 7,200
Barchart analysts say the S&P 500 has decisively broken the 6,620 level, signaling the start of a wave‑5 advance that could push the index toward 7,200. The breakout follows a completed wave‑4 pullback and offers a fresh entry for momentum‑focused...

Morningstar: US Equities Trade 5% Below Fair Value After April Rally
Morningstar Research Services says the US equity market ended April 30 at a 5% discount to its fair‑value composite, after a rally that lifted growth stocks but left value and energy lagging. The valuation gap, sector rotation and a barbell‑style...

10 Stocks Turning Heads With Double-Digit Gains
Ten mid‑cap stocks with market caps above $2 billion posted double‑digit gains on Tuesday, lifting the Nasdaq, S&P 500 and Dow into positive territory. Life Time Group jumped 11.8% to $29.38 after reporting Q1 net income of $88 million and raising its 2026...

5 Stocks Turning Heads With Double-Digit Gains
Cytokinetics Inc. (NASDAQ: CYTK) surged 16.71% on Tuesday, closing at $77.09 and setting a new 52‑week high after a strong first‑quarter earnings release. The biotech reported Q1 revenue of $19.3 million, a 1,121% year‑over‑year jump, driven primarily by sales of its...

Kosmos Energy Posts $225.6 Million Q1 Loss, Shares Slide 4.3%
Kosmos Energy Ltd. announced a net loss of $225.57 million for the first quarter of 2026, more than double the loss a year earlier. The loss was driven by a surge in net derivative and exploration expenses, while revenue rose to...
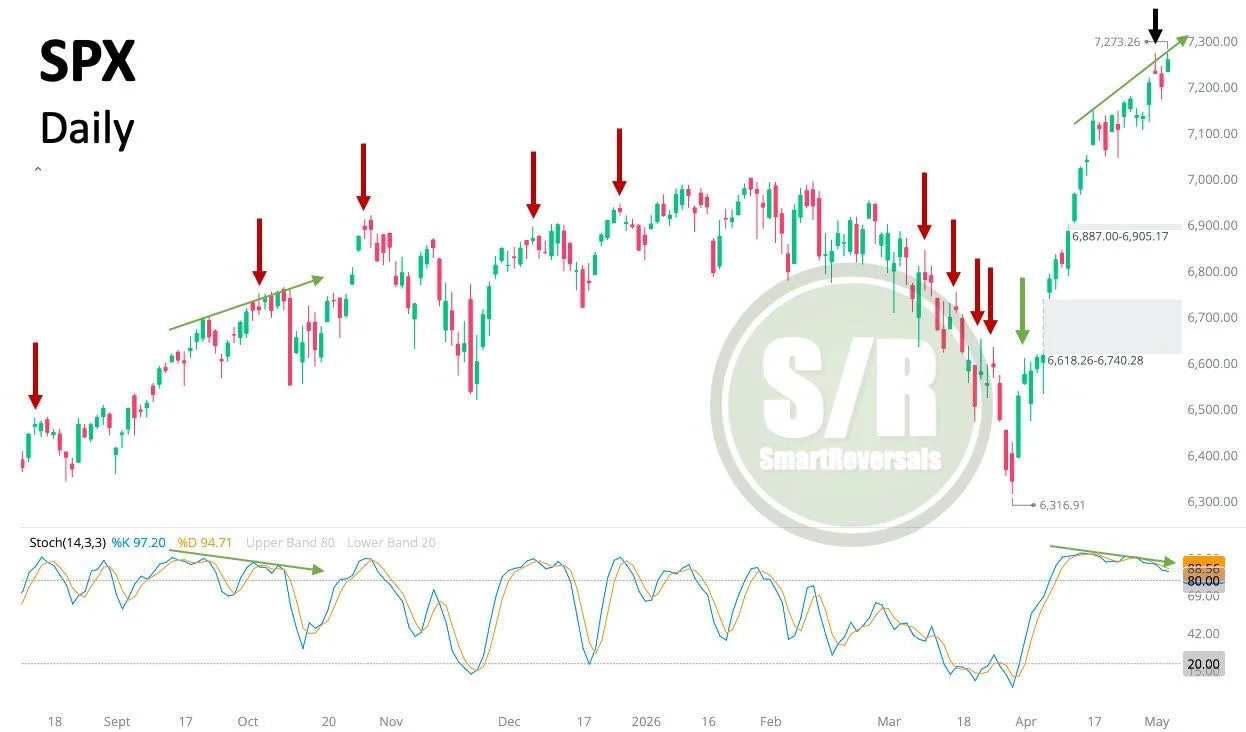
Hold Off Until SPX Breaches 7,299 Resistance
SPX: Don't fight the trend until key levels are breached. The recent indecisive candle is suggesting to be an early signal as the Stochastic divergence continues to extend. It is a matter of when, not if. Next major resistance: $7,299,...
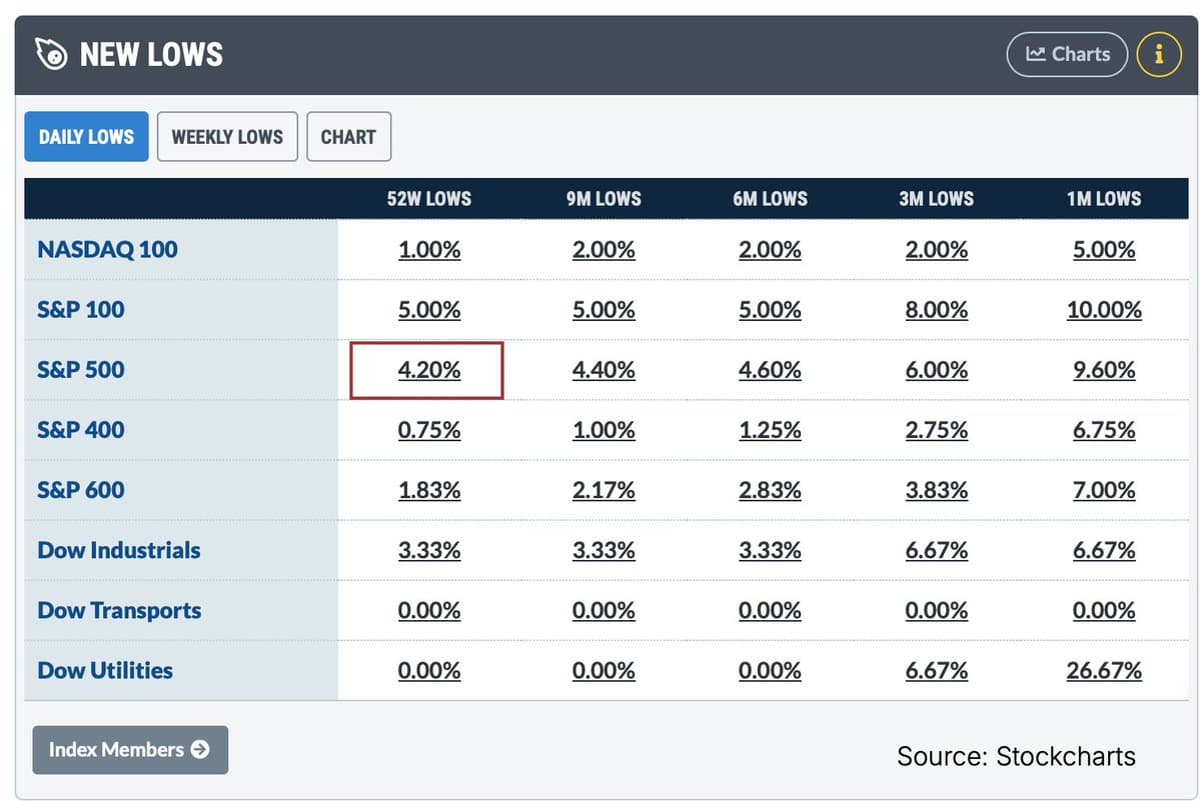
Record S&P High Amid Wave of 52‑Week Lows
Today will be the 2nd consecutive day the S&P 500 $SPY closes at a record high, with more than 4% of its stocks hitting 52-week lows. Anyone wanna guess the only other time in 100 years this has happened? https://t.co/E3MJYlA42k
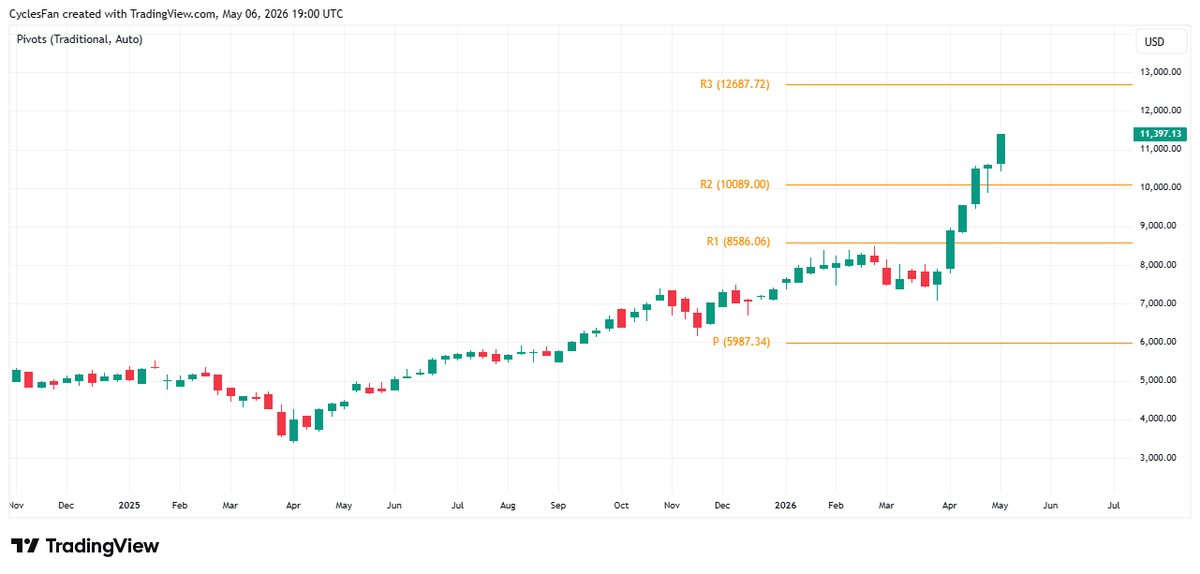
SOX Rallies 3.65% but Eyes 20% Crash Risk at 12,687
$SOX - The blow off move continues with a 3.65% up day. The level at which it starts being at risk of a 20%+ crash is the 3rd yearly resistance at 12687. https://t.co/Z0DSh4yR9h
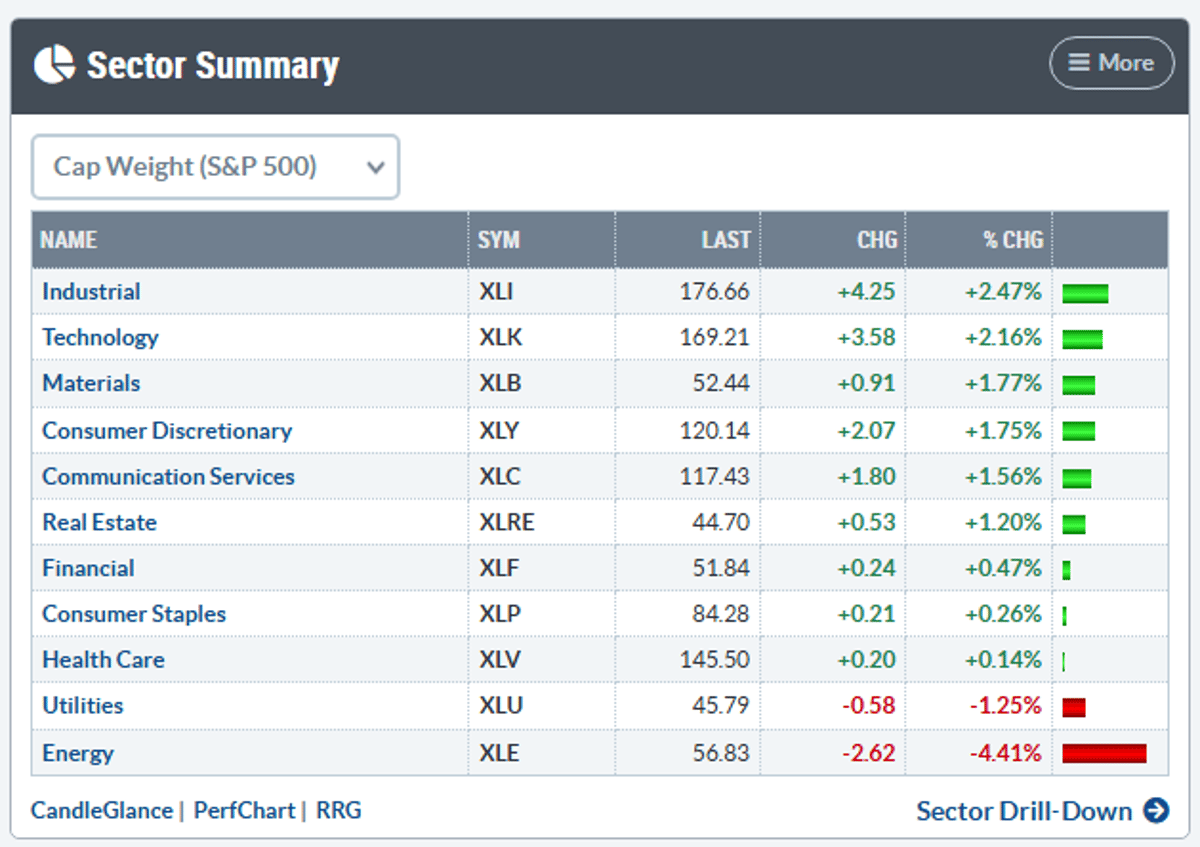
Weak Market Breadth; Energy and Defensive Stocks Lagging
Breadth is actually not great... Energy obv slammed, but defensives broadly weak $XLP $XLV $XLU 2-1 advancing on the NYSE https://t.co/sF8aXc5xDo

S&P 500 Nears Overbought RSI 75 Threshold
$SPX knocking on the door of daily RSI(14) reaching the magical value of 75. Probably not the type of magic you'd imagine though.
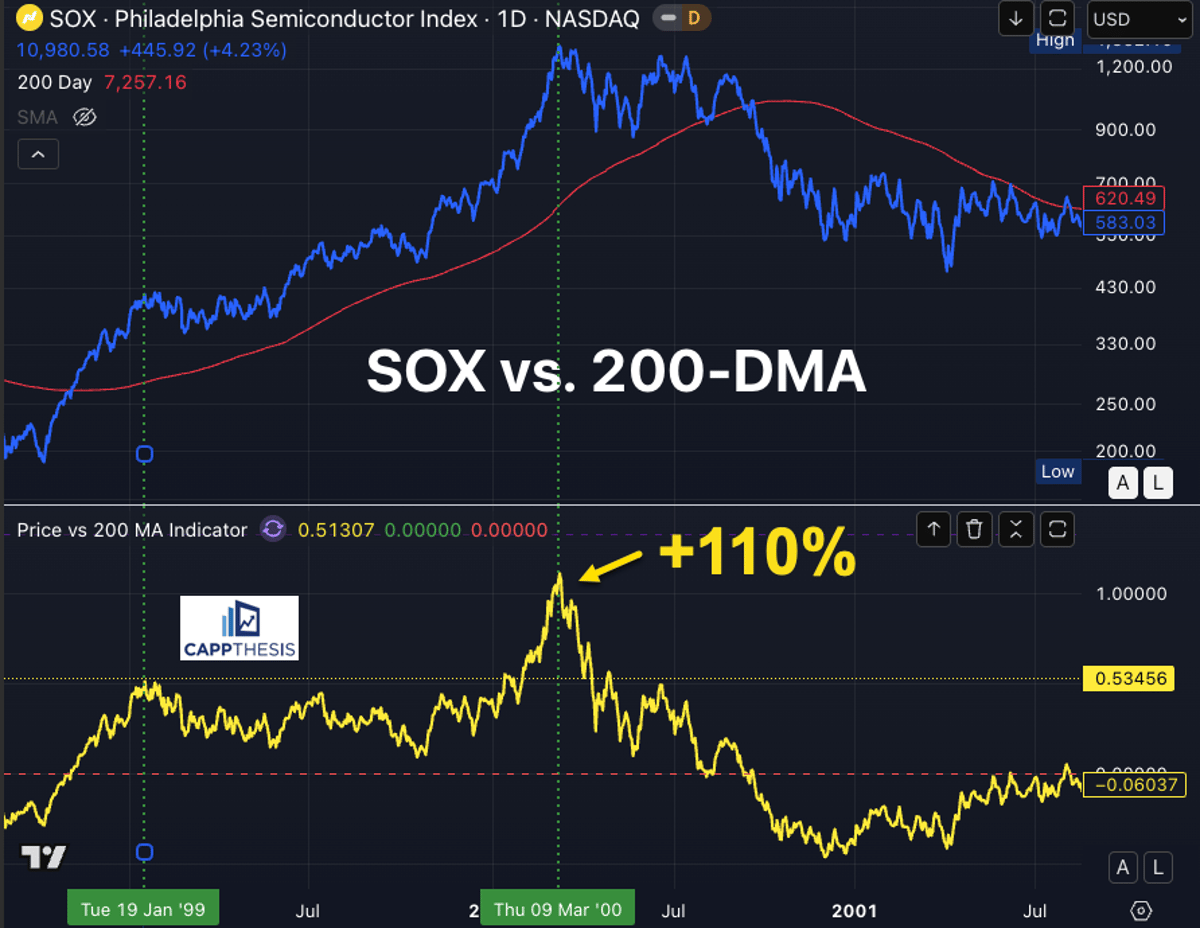
SOX Index Surges 53% Above 200‑DMA, Echoes
The SOX Semiconductor Index started today 53% above its 200-DMA - the biggest discrepancy since March'00, but... The index FIRST approached that 50% threshold in January ’99. The percentage then shot all the way to +110% by March 2000 before the...
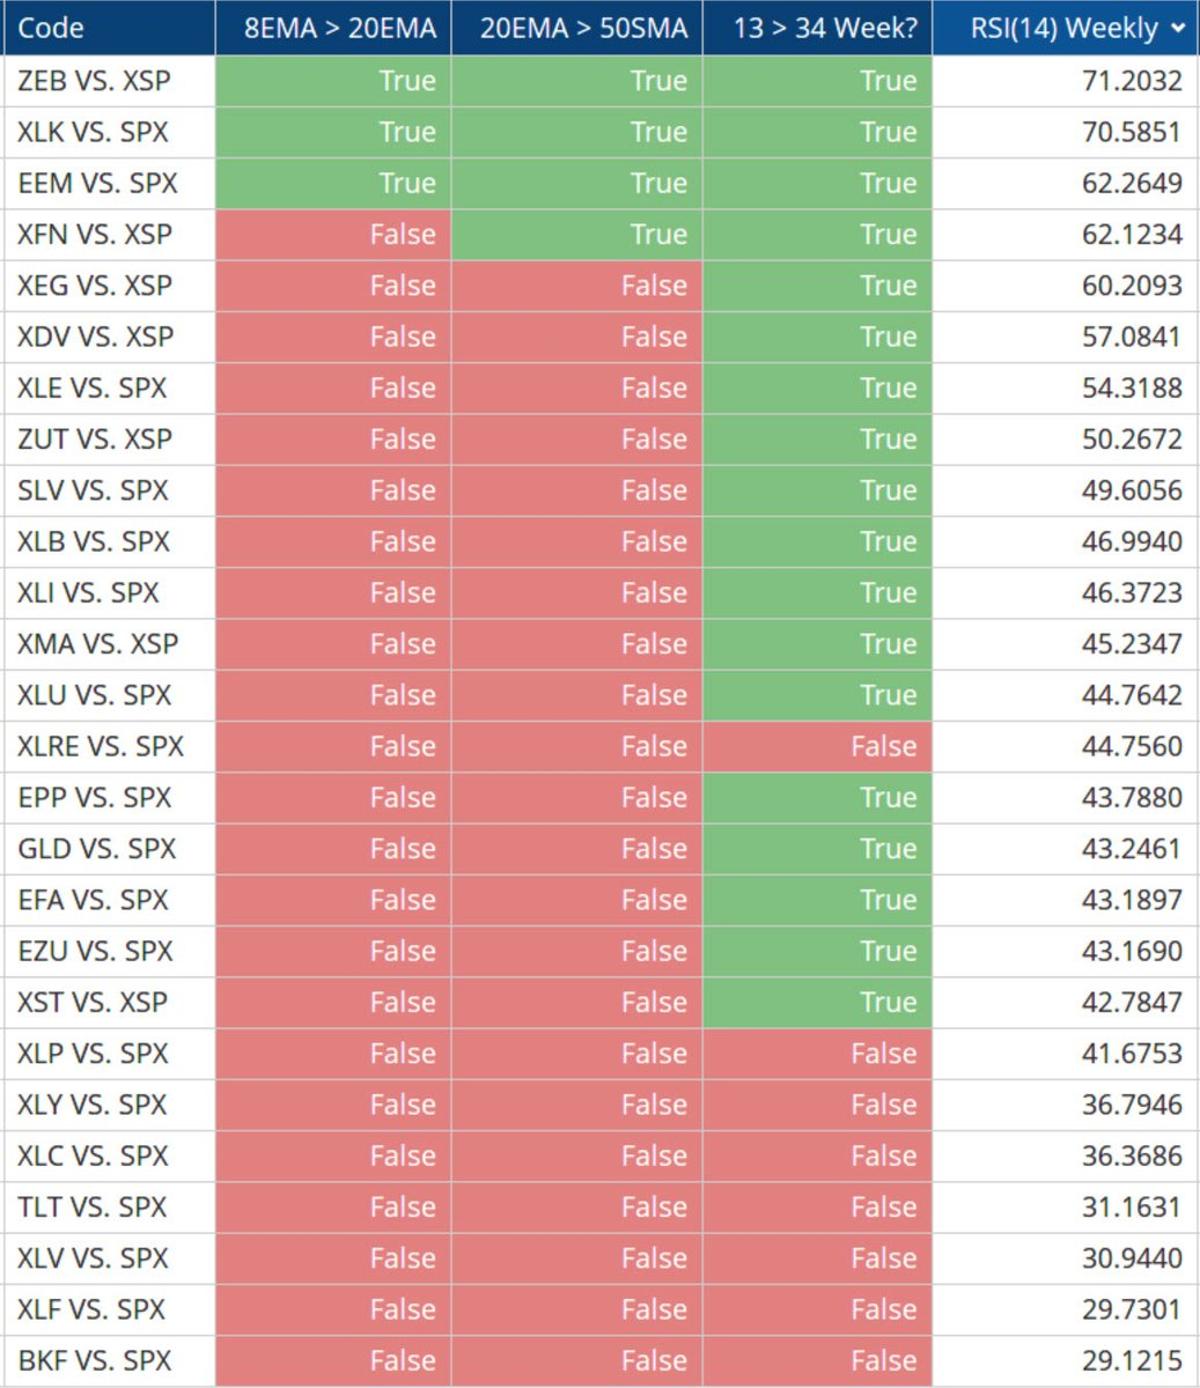
Canadian Banks, Tech, and Emerging Markets Lead
a weekly glance at the short, intermediate and long-term S&P 500 $SPX relative trend of the key North American sectors & indices... #SectorWatch those Canadian banks $ZEB, technology $XLK and emerging $EEM market stocks relatively the best... https://t.co/xwje7eIdx3

High‑valuation Stocks Crumble in Market Corrections
Often, the stocks that you see in the headlines have lofty valuations, making them vulnerable during market corrections. https://t.co/U1r9TiakDy

Cumulative Breadth Surges; Opening T
Although cumulative breadth is extremely strong today, opening TICK +822 was highest and not many over +500, no sellers, but also more of a melt-up
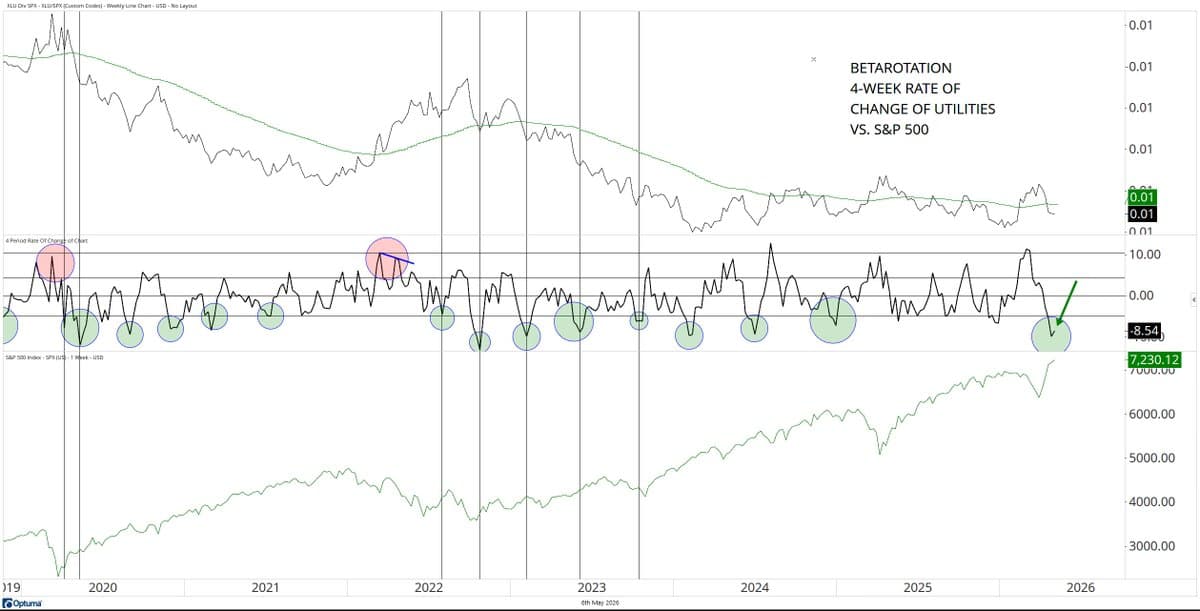
Utilities' Multi-Year Underperformance Signals Bullish Stock Outlook
we've had a multi-year move in underperformance of utilities $XLU vs. S&P 500 $SPX looking at the #betarotation model... that is #bullish for stock prices... https://t.co/Za0eqrI7gu
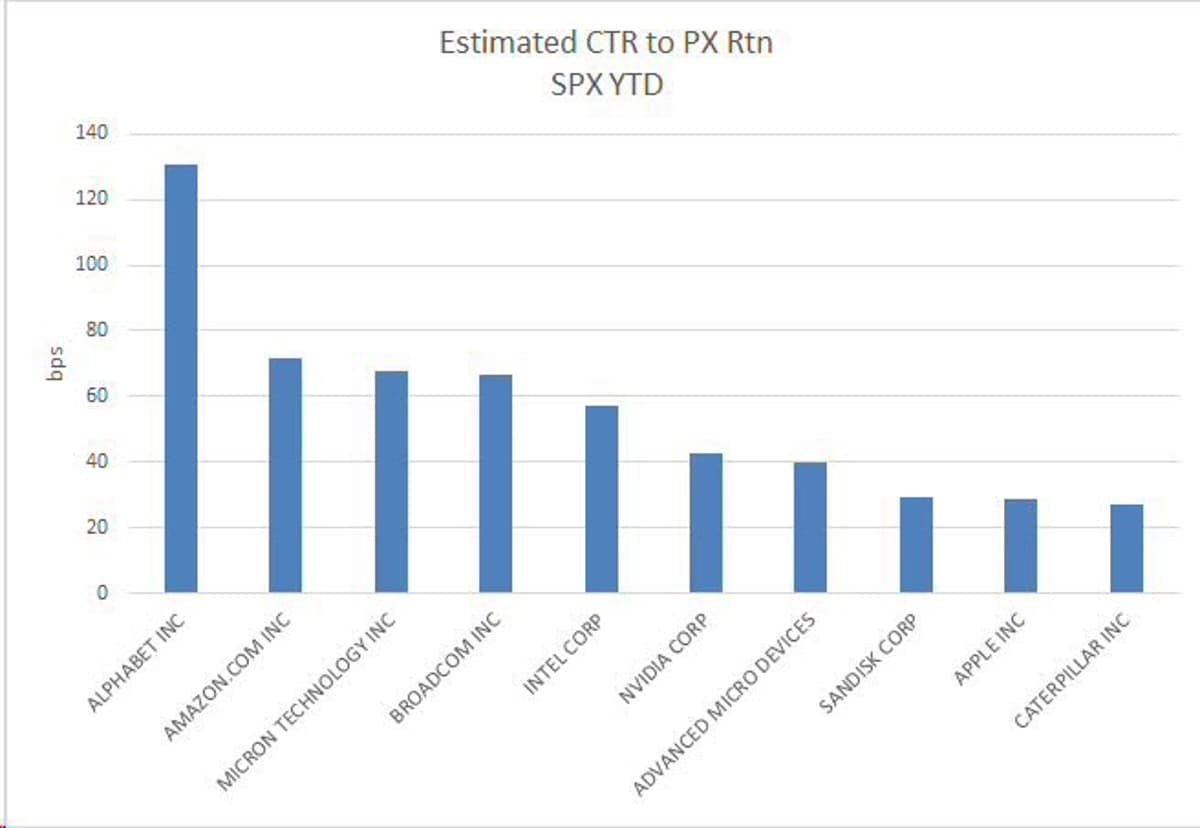
Google, Not JPM, Powers S&P 500 Moves
Fwiw this JPM equity desk post is nonsense and anyone with half a brain would know that $GOOG is driving SPX here are the big drivers working on the whole 500 thanks @DanielSimonyi https://t.co/8BOjg7tN8n
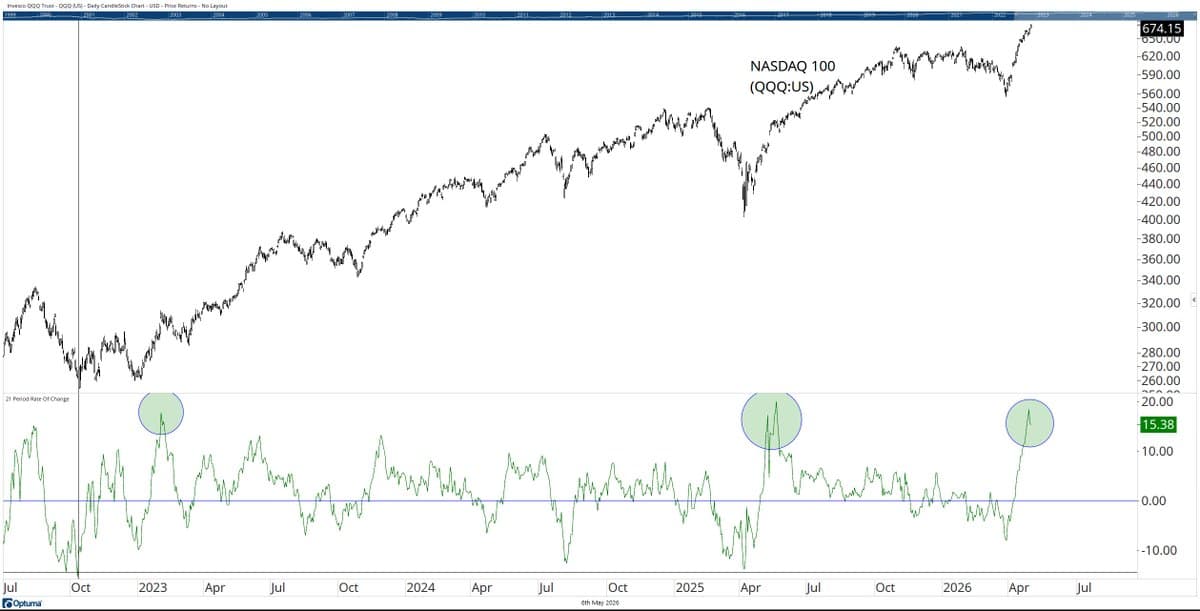
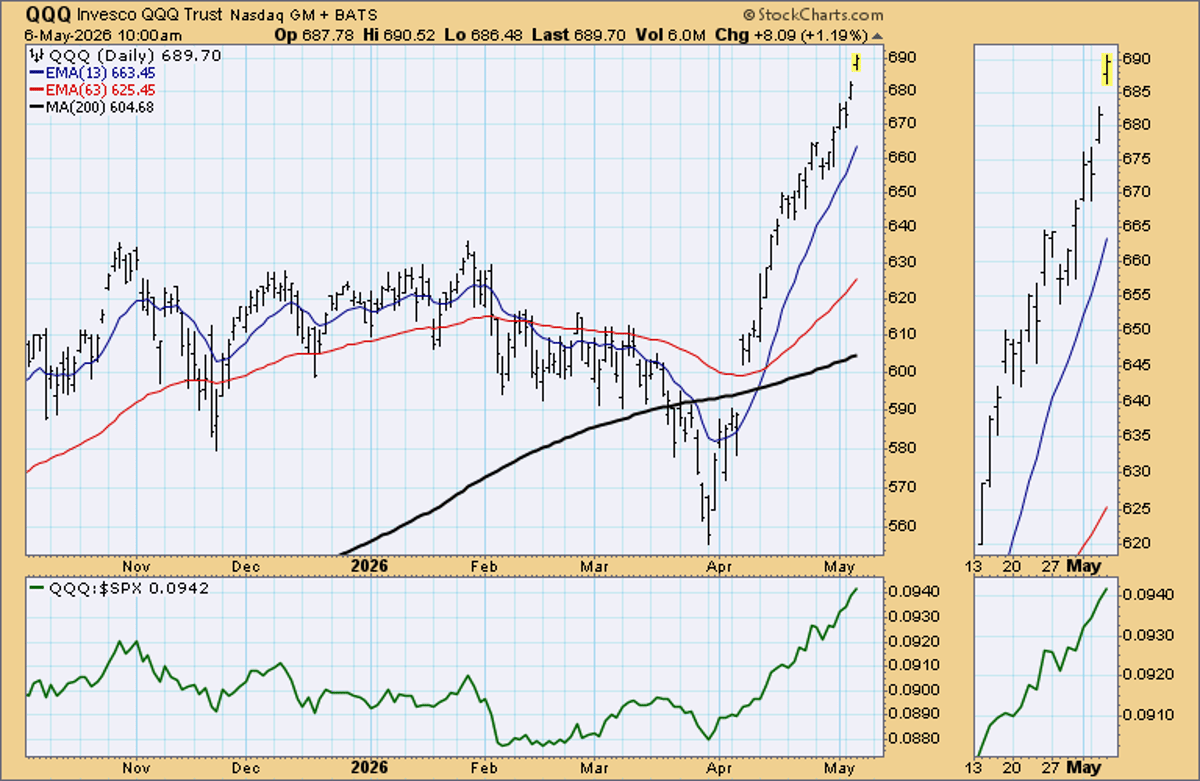
QQQ's Rare 4‑Week Rally Signals Bullish Momentum
we've just had one of the three strongest 4-week rallies on the $QQQ in recent years... as a note: strong momentum after a decline tends to be buying/bullish evidence not a reason (in and of itself) to be bearish... https://t.co/AskI0lqCq1

All‑time Highs Meet Bearish Sentiment: Classic Lockout Rally
Stocks are pushing to all-time highs while sentiment is getting more bearish—bulls down, bears up. That’s a sign of disbelief. Investors are fighting the rally, which is a classic Lockout Rally condition. https://t.co/7NiHKuPACd https://t.co/LJ8u8etwnj
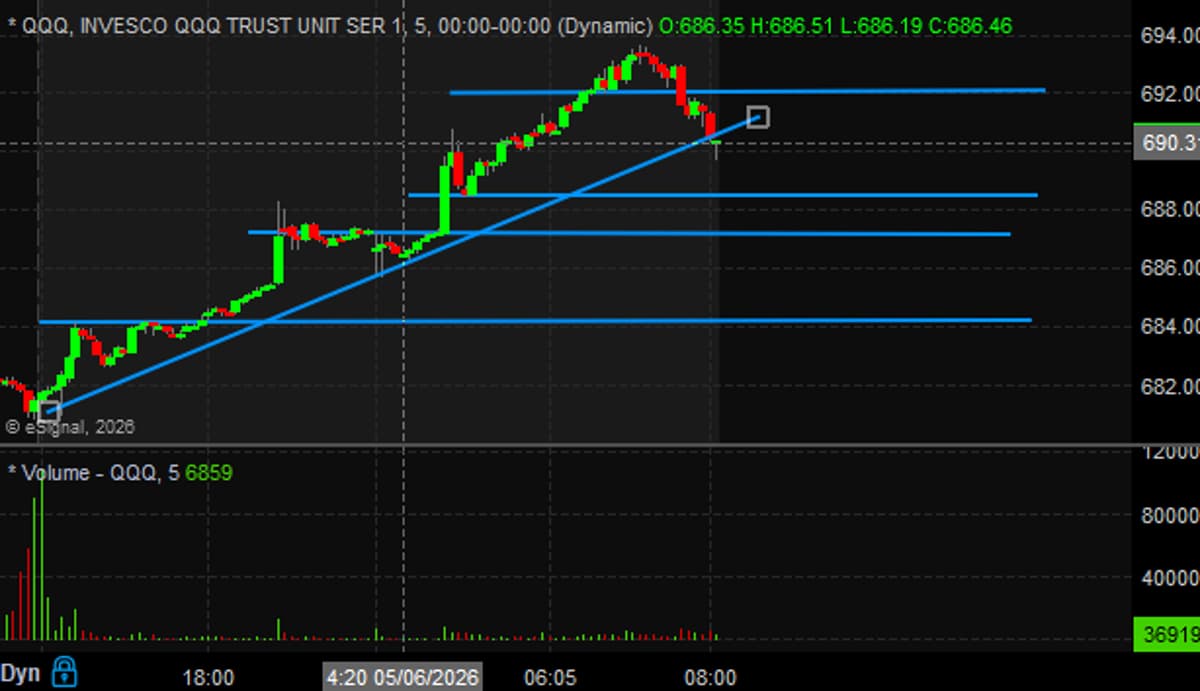
Parabolic AMD Rally Likely to Reverse, QQQ Already Pulling Back
market has gone from strong to parabolic on $AMD earnings and rumored end to hostilities in Middle East. we have seen a few days like this in the past year go from green to red. $QQQ has already...
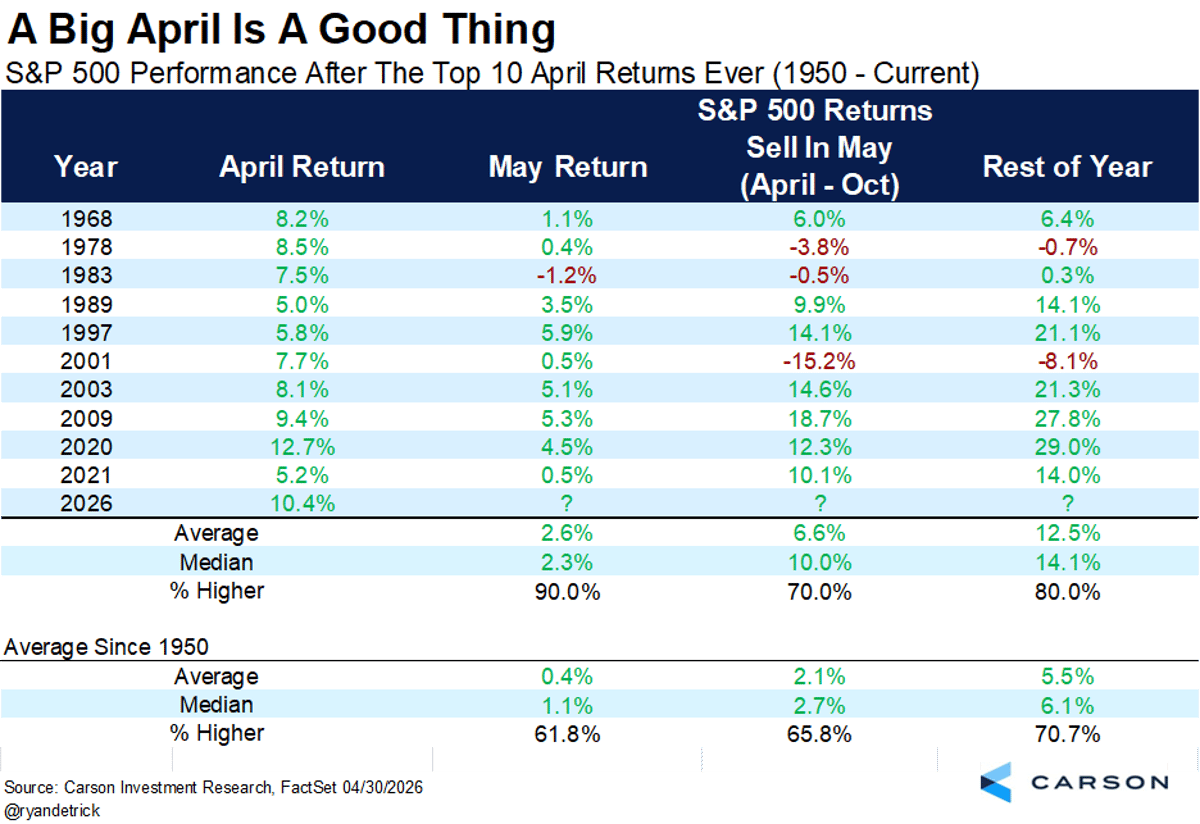
May Gains Expected After Record‑breaking April Rally
Stocks are up in May, but this is normal after a big April. May was higher after 9 of the top 10 April returns ever. https://t.co/EPWRajjU3I
US Index Futures Surge Over 1% Across Board
JUST IN: U.S. S&P 500 E-MINI futures are up 1%, NASDAQ 100 futures are up 1.71%, and Dow futures are up 1.22%.

One‑Std Dev Daily Pump Targets Intel and S&P
New free article on Price Action Lab Blog: The Relentless One-Standard Deviation Daily Market Pump $INTC $SPX Link in reply below 👇 https://t.co/OhAeaiNTWW

Scott Redler’s Live Premarket Update Highlights Top Picks
⏰ Scott Redler’s #630club - LIVE Premarket Stock Market Update ➡️ Free VIP List Newsletter: https://t.co/EW4O2nc6Yl $NVDA $TSLA $IBIT $SNDK https://t.co/WsSRcWjbY3
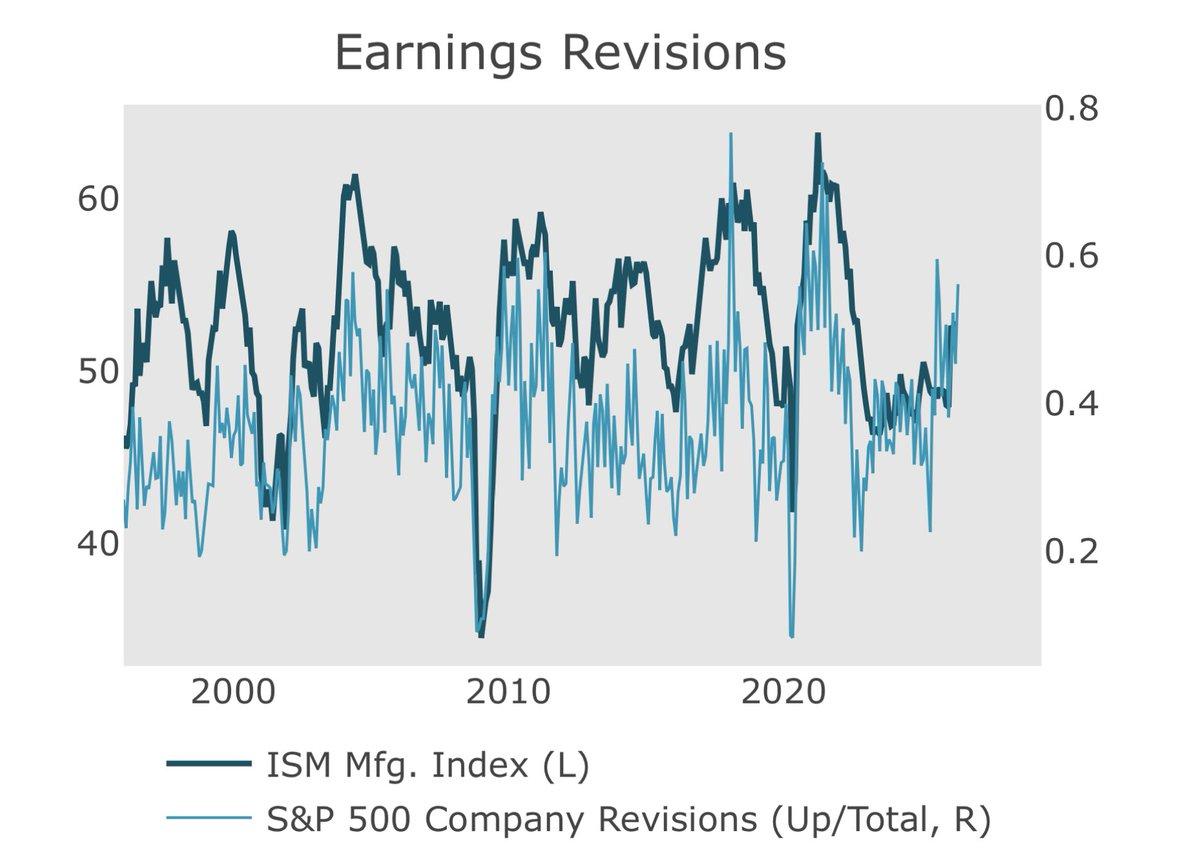
Macro Breadth Returns: Lower Rates and Oil Boost EPS
Today’s backdrop is the broadest macro & micro backdrop we’ve seen since 2021. While AI themes remain dominant, a more classic macro broadening has been taking place since 4Q/25, for the first time in years. Lower rates/oil can help to...