Today's American Stocks Pulse
Goldman Sachs lifts S&P 500 year‑end target, dismisses bubble fears
Goldman Sachs raised its forecast for the S&P 500’s year‑end level, citing continued earnings strength, and said the market is not in a bubble. Analysts also note a potential melt‑up could push the index toward 8,000 if momentum holds.
US Futures Rise as Iran Ceasefire Holds and AMD Earnings Loom
U.S. stock futures edged higher Tuesday as a reported Iran ceasefire reduced geopolitical risk and market participants awaited AMD’s earnings report. The S&P 500 jumped 0.8% to a new record, driven by double‑digit gains in leading chipmakers.
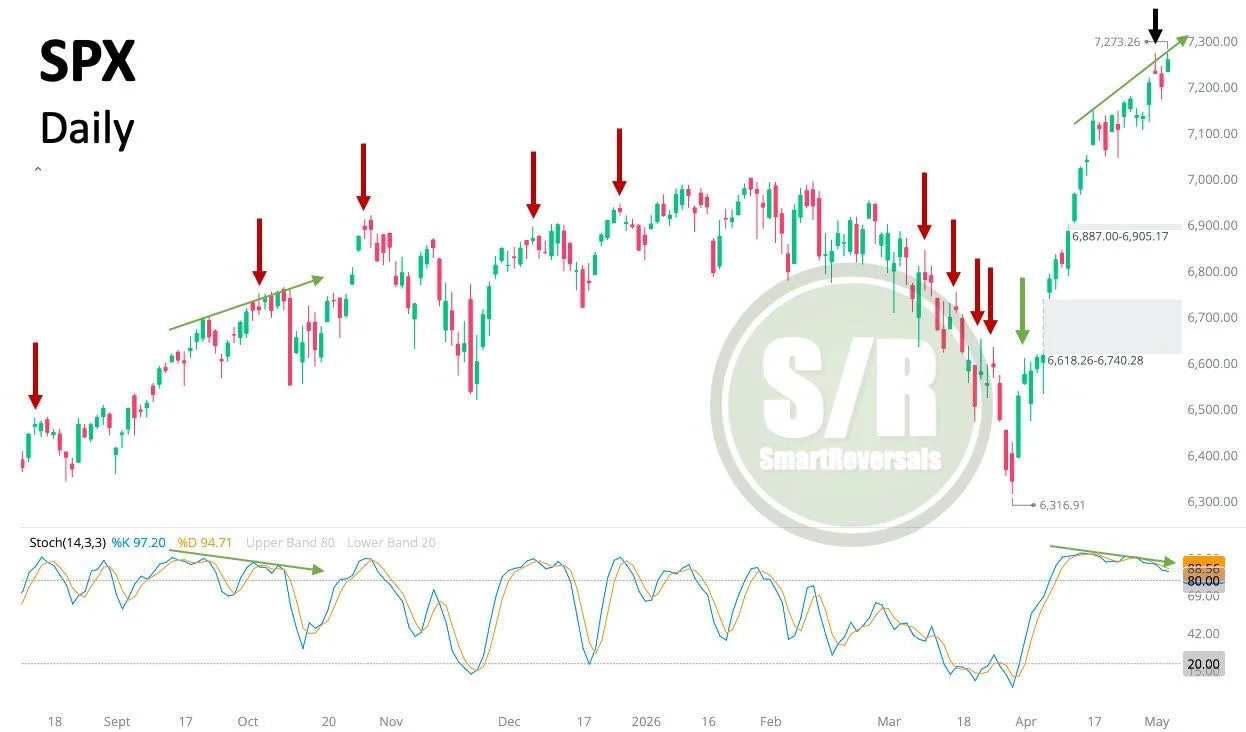
Hold Off Until SPX Breaches 7,299 Resistance
SPX: Don't fight the trend until key levels are breached. The recent indecisive candle is suggesting to be an early signal as the Stochastic divergence continues to extend. It is a matter of when, not if. Next major resistance: $7,299,...

Semiconductor Rally Set: AMD Spikes 15%,
Semi flows going to be nuts again tomorrow with AMD up 15% carrying ARM up 9%, MU up 5%, and INTC up 5% A/H

The Great Rotation Is Here — And FMKT Is Built for It
The 10‑year/2‑year Treasury yield spread turned positive at +0.50% in April 2026, ending the deepest inversion since the 1980s. ISM Manufacturing PMI rose to 52.7 in March, confirming a return to expansion, while the S&P 500 slipped over 5% in...
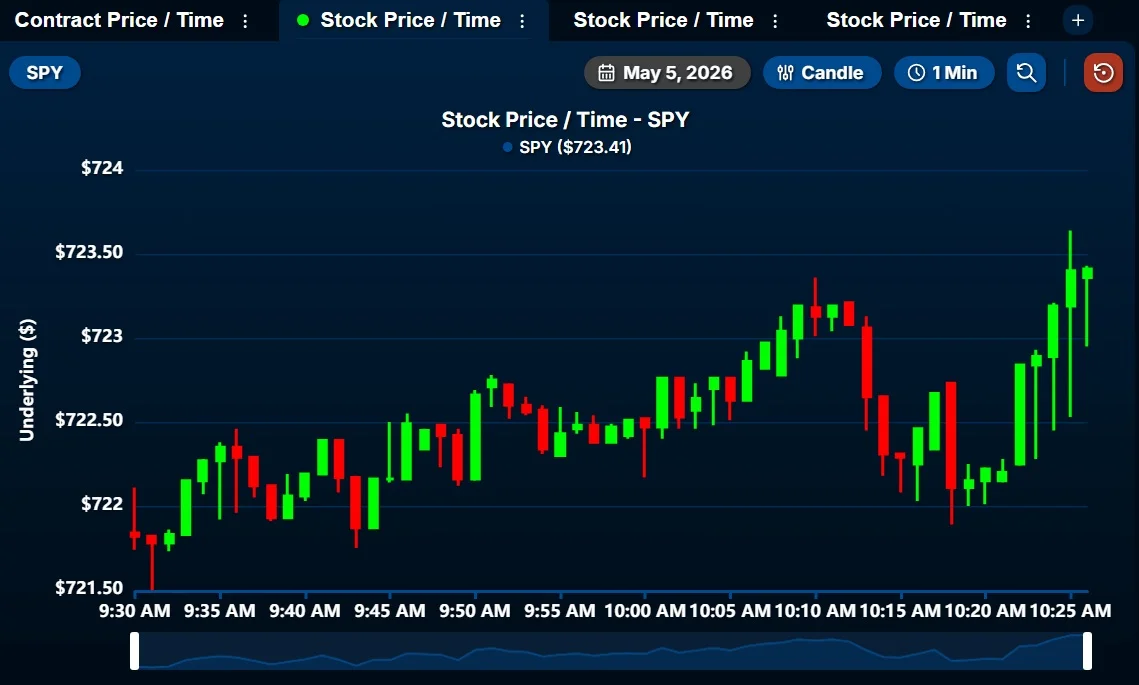
AI Divide Drives Market Split Amid Record Highs
May 5, 2026 close. S&P 500 and Nasdaq printed fresh all-time highs. SPY $723.77 +0.80%, QQQ $681.61 +1.30%, Dow +357 pts, Russell 2000 +1.68%. The headline says everyone won. The tape says the opposite. Underneath, the market just split AI...

TMTB EOD Wrap
US equity markets closed higher on Thursday, with the QQQ index up 1.3% as AI‑focused semiconductor stocks led gains while internet and software lagged. Semiconductors such as AVGO, LITE, AMD and memory makers posted double‑digit advances, and AMD’s earnings beat...
Stock Market Today, May 5: Stocks Rebound as U.S.-Iran Truce Holds
U.S. equity indexes rebounded on May 5 as the U.S.–Iran truce held and oil prices eased, pushing the S&P 500 to 7,259.22, the Nasdaq to 25,326.13, and the Dow to 49,298.25. Tech stocks led the rally, with Micron soaring 11% on new...

The Closer – Breadth Disconnect, AI Earnings, Prices Rising – 5/5/26
The S&P 500 closed in overbought territory on Monday while its 10‑day advance‑decline line was oversold, a breadth disconnect that has occurred only 33 times since 1990. For the first time since July 2022, more than half of ISM Services PMI respondents...
Nasdaq, S&P 500 at New Highs on Intel Rally: Stock Market Today
U.S. equity markets closed at fresh all‑time highs on Tuesday as the Nasdaq Composite rose 1% to 25,326 and the S&P 500 climbed 0.8% to 7,259, driven by a tech rally. Intel led the charge, jumping 12.9% after Bloomberg reported Apple...
Robinhood Retailers Bet $X B on Nvidia, Alphabet and Microsoft as Quantum Picks Surge
Robinhood users have vaulted Nvidia, Alphabet and Microsoft into its top‑10 most‑traded stocks as retail enthusiasm for quantum computing spikes. The trio’s recent breakthroughs—Nvidia’s Ising AI models, Alphabet’s Willow processor and Microsoft’s Majorana 1 chip—are fueling a $100 billion market outlook, even...
Microsoft's Earnings Beat Fails To Help Shares. Is Microsoft Stock A Sell Now?
Microsoft reported fiscal Q3 earnings of $4.27 per share on $83 billion revenue, both surpassing FactSet estimates. Despite the beat, the stock slipped 4% as investors focused on a softer Q4 revenue outlook of $87.25 billion versus consensus $87.56 billion. Analysts project FY2026...

Bulls Are Piling Into This Warren Buffett Favorite Ahead of Earnings
Traders are loading up on bullish options ahead of Occidental Petroleum's earnings, with call volume outpacing puts 7‑to‑1. One of the largest trades was a $175,000 call spread targeting a one‑year high. OXY shares rose 2.7% Monday and are up...

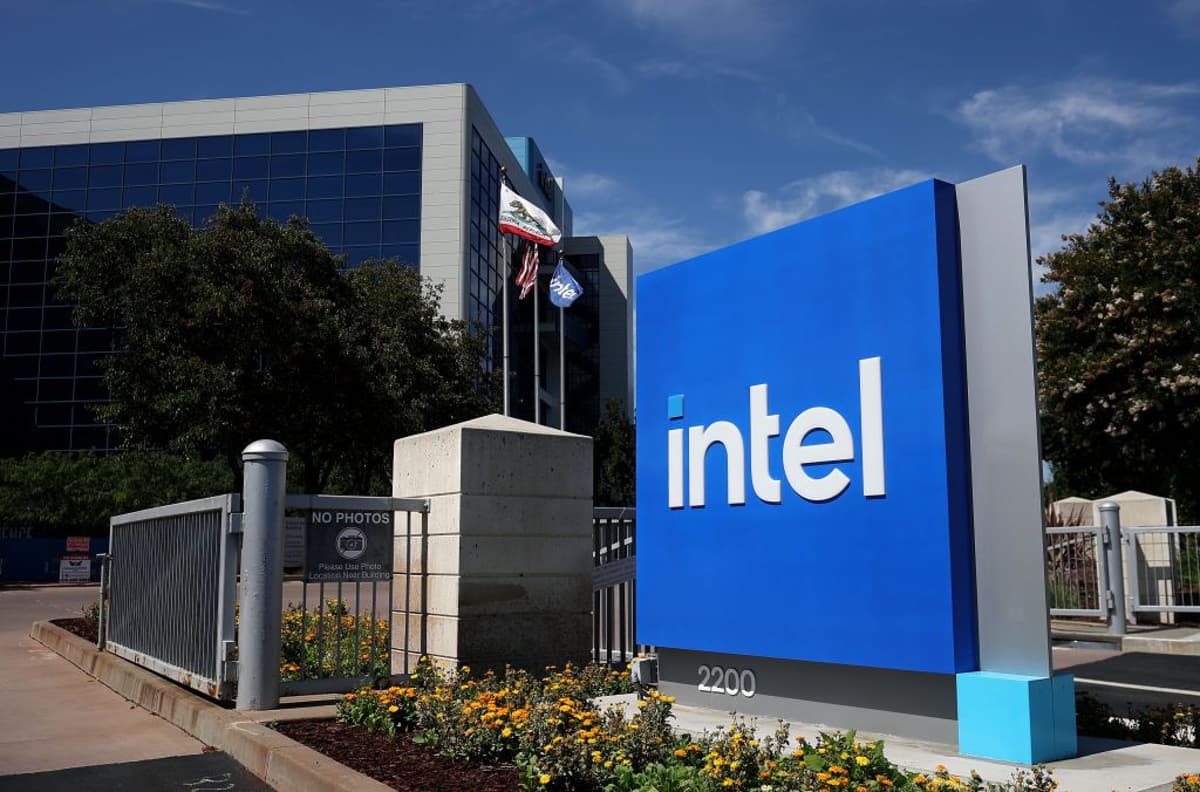
Intel Stock Price: Why INTC Hit an All Time High Today—And How Apple Is Involved
Intel shares jumped over 13% to a record above $100 after Bloomberg reported Apple is evaluating Intel and Samsung to produce its main device chips in the United States. The news follows Apple’s strong Q2 earnings, with $111.2 billion revenue and...
AI Boom Persists; Data‑center Stocks Poised for Gains
The AI trade is alive and well. Semiconductor stocks have run up a lot and likely due for a near-term pullback but other names involved in the data-centre buildout are not over-extended. Real GDP accelerated in March + April and with the...

ADT Plunges 6.5% as Apollo Exits via $744.6 M Secondary Offering
ADT Inc. tumbled 6.49% to $7.06 after Apollo Global Management announced a 102‑million‑share secondary offering valued at roughly $744.6 million, fully exiting its position. The sell‑off triggered record trading volume and raised questions about the effectiveness of ADT’s ongoing share‑buyback program.

Kaiser Aluminum Director Sells 25% of Holdings for $261K Amid 166% Stock Surge
Kaiser Aluminum director Richard P. Grimley sold 1,524 shares for about $261,000, trimming his direct ownership by a quarter. The sale came as the company’s stock surged more than 166% Y/Y on soaring aluminum demand and strong first‑quarter results.

Laureate Education Posts $236 M Q1 2025 Revenue, Highlights Seasonal Slowdown
Laureate Education posted $236 million in first‑quarter 2025 revenue, a seasonally low figure, while reporting 10% organic constant‑currency growth and a 7% rise in new enrollments. Management flagged an $8 million one‑time revenue loss in Mexico and warned of near‑term volatility from...

VOOG Beats VONG: Concentrated S&P 500 Growth ETF Outperforms Broader Russell 1000 Counterpart
Vanguard's S&P 500 Growth ETF (VOOG) posted a stronger one‑year return than the Russell 1000 Growth ETF (VONG), while also offering a slightly higher dividend yield. The performance gap underscores a classic trade‑off between a tighter, high‑growth stock pool and...

Bloomberg Surveillance: Markets Drive Hihger (Podcast)
Bloomberg Surveillance aired on May 6, 2026 featured Evercore’s Julian Emanuel, CIO Group founder David Bailin, Citi’s Heath Terry, and Energy Vista’s Leslie Palti‑Guzman. Emanuel highlighted extraordinary earnings strength and set a 2026 S&P 500 target near 5,200. Bailin argued the United States...

US Stocks Hold Steady as Europe Drags, Global Outlook Bullish
Vanguard global stock index is up about the same amount as the US market this year. Europe is acting as a drag so far this year with other markets (eg Brazil) outperforming strongly. Seems like international investors have got comfortable with...
SPY Breaks $722 Support, Reversal Confirmed
You can not make this up...look at that aggressive reversal off $722 support on $SPY. I mentioned we are watching this range this morning, the same analysis stands.
Stock Movers: COIN, SHOP, PINS (Podcast)
Coinbase announced a 14% workforce reduction, concentrating remaining staff on artificial‑intelligence capabilities, which lifted its shares. Pinterest reported Q1 revenue that beat expectations, driving a near‑20% jump in after‑hours trading despite a $73.6 million loss and an 11% rise in monthly...
NXP Semiconductors Shares Surge 49% on Q1 Beat and Aggressive Guidance
NXP Semiconductors' shares leapt 49.1% in April 2026 after the Dutch‑American chipmaker posted Q1 sales of $3.18 billion, a 12% year‑over‑year gain, and adjusted earnings of $3.05 per share, topping analyst forecasts. Management also raised the midpoint of its Q2 revenue...

Global Net Lease to Acquire Modiv Industrial in $535 Million All‑Stock Deal
Global Net Lease (GNL) agreed to acquire Modiv Industrial (MDV) in an all‑stock transaction valued at roughly $535 million. The merger, structured as a 1.975‑to‑1 share exchange, is expected to be immediately accretive to GNL's AFFO per share.
Nvidia Unveils Open‑Source Ising Model, Sending Quantum Start‑Ups’ Shares Soaring
Nvidia announced the open‑source Ising AI model, a control‑plane framework for quantum processors. Within minutes, IonQ jumped 21%, Rigetti rose 13.3% and D‑Wave surged 22.6%, signaling investor optimism that Nvidia’s AI expertise will accelerate quantum error mitigation and commercial adoption.
TMTB Morning Wrap
Palantir (PLTR) delivered an 85% YoY revenue surge in Q1, beating estimates and raising its FY26 revenue outlook to $7.66 B. The company highlighted explosive US government and commercial growth, though commercial revenue missed the street by $10 M after a re‑classification....
Just a Few Stocks Driving S&P 500 Rally Triggers Dot-Com Bubble Flashbacks
The S&P 500’s recent record‑setting rally is being driven by a handful of mega‑cap tech and semiconductor stocks, leaving market breadth at its narrowest levels since the late‑1990s dot‑com boom. In April, only 23 % of index constituents outperformed the benchmark, and...
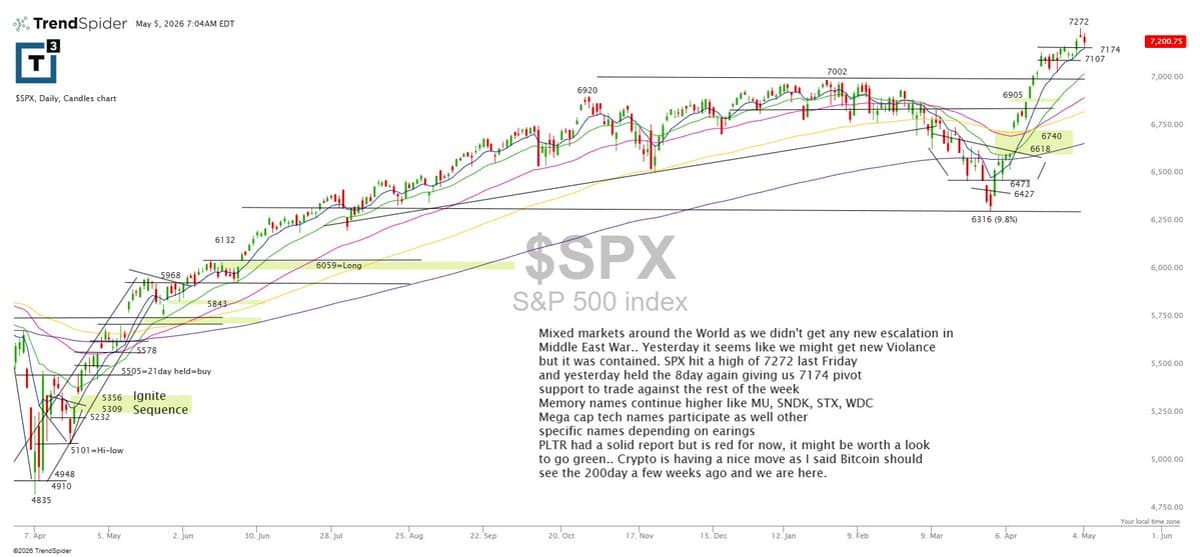
SPX Holds 8‑Day Pivot; Memory Stocks Stay Strong
$SPX is still riding the 8-day, using 7174 as the pivot support after tagging 7272 last Friday. Memory names are staying strong ($MU, $SNDK, $STX, $WDC) and mega-cap tech is participating, while $PLTR is red for now after a solid...

The Market Brief
U.S. equity futures rose Tuesday while oil prices slipped, reflecting a tentative rebound amid heightened Middle‑East tensions. Institutional investors are rotating out of mega‑caps into small‑caps, which now trade at their widest valuation discount in two decades. Systematic long/short managers...

Tight Jobs and Strong Services May Spike Rate Pressure
🚨 Morning Market Rundown – May 5, 2026 🚨 Big data cluster this morning — services PMI + JOLTs could move rates and sentiment fast 👀 🗓️ Economic Events: 0830 - Trade Balance (Mar): Exp -$60.9B; Prior -$57.3B 0945 - S&P Services PMI (Apr):...
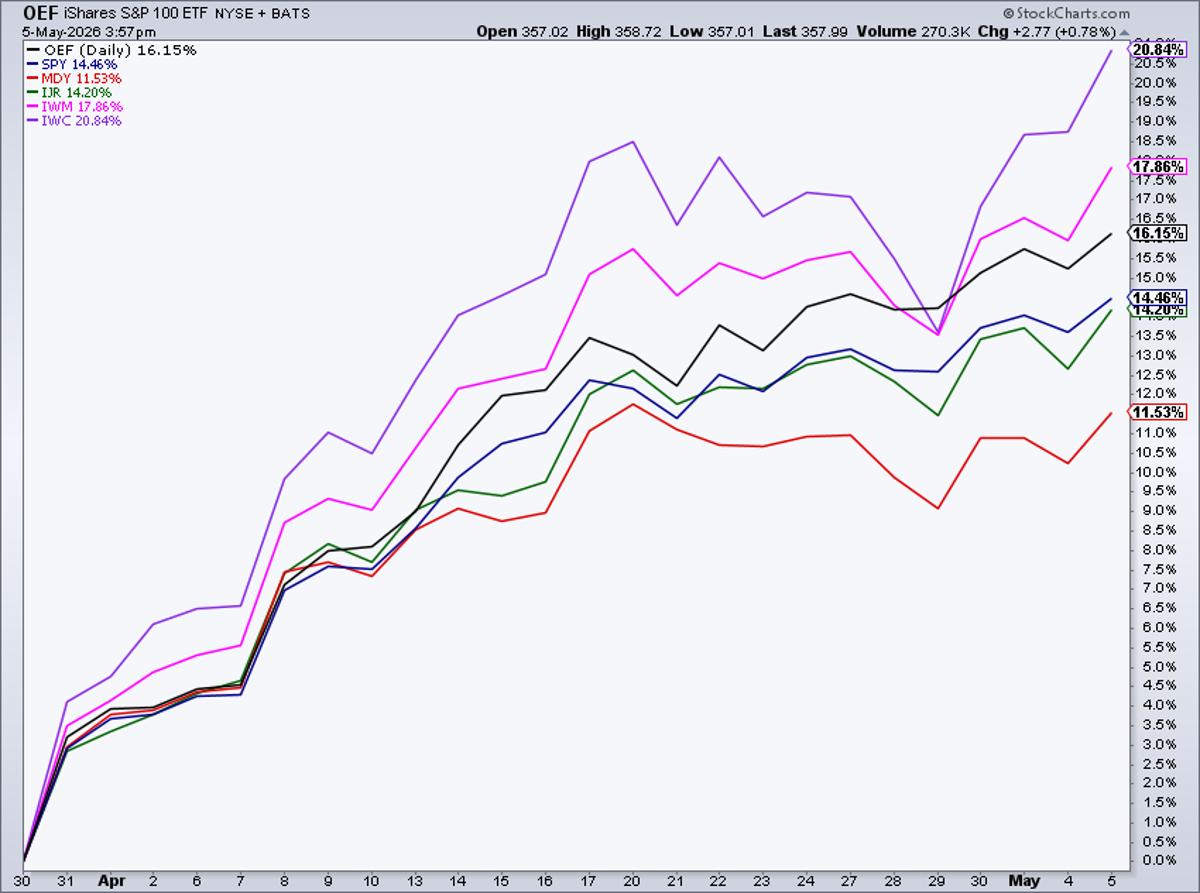
Microcaps Surge 21% While Mid‑Caps Lag Behind
$IWC microcaps leading off the March 30 low... +21% $SPY +14.5% Profitable mid-caps lagging +11.5% @stockcharts https://t.co/lRb6cd508o

Here Are 13 Reasons Why Large Caps Will Now Beat Small Caps, According to UBS
UBS strategists argue that large‑cap stocks are poised to outpace small caps after a year in which the Russell 2000 outperformed the S&P 500 by 13 % versus 5 %. They cite shifting CTA positioning, a valuation discount for small caps, stronger earnings quality...

Market Signals Bearish Trend Despite All‑time Highs
Yep, both the market and my Signaling Process agrees. It was ultra bearish for $QQQ $GOOGL etc. to print all-time highs with $META confirming Bearish @Hedgeye TREND today. I'll ask Freebird @HedgeyeComm about it tomorrow on The Call @HedgeyeTV

Super Micro Shares Jump 19% After Revenue Doubles
JUST IN: Super Micro's stock rises 19% after beating guidance as revenue more than doubles.

Analysts Warn Summer 2026 Volatility as S&P 500 Sets Record High
The S&P 500 reached a new peak near 7,125, but analysts say the rally’s narrow breadth, elevated leverage and overbought technicals signal heightened correction risk this summer. A confluence of four warning signs could make June‑September especially volatile for equity portfolios.
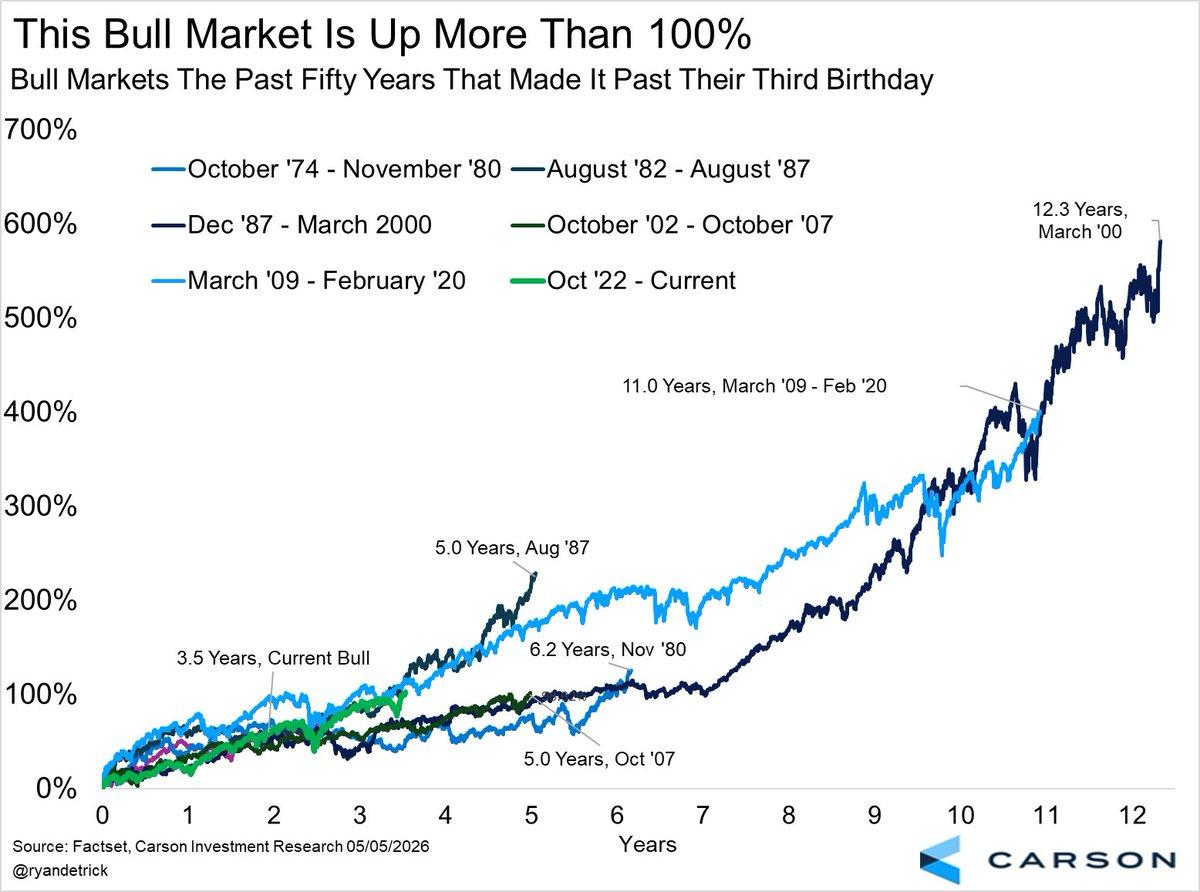
S&P’s 103% Rise Mirrors Past Bull Market Patterns
From the Oct '22 lows, the S&P 500 is up nearly 103% after today. Here's what the previous five bull markets that made it this far looked like. The bottom line? Years more of gains would be perfectly normal. https://t.co/FTzh4IWKYf
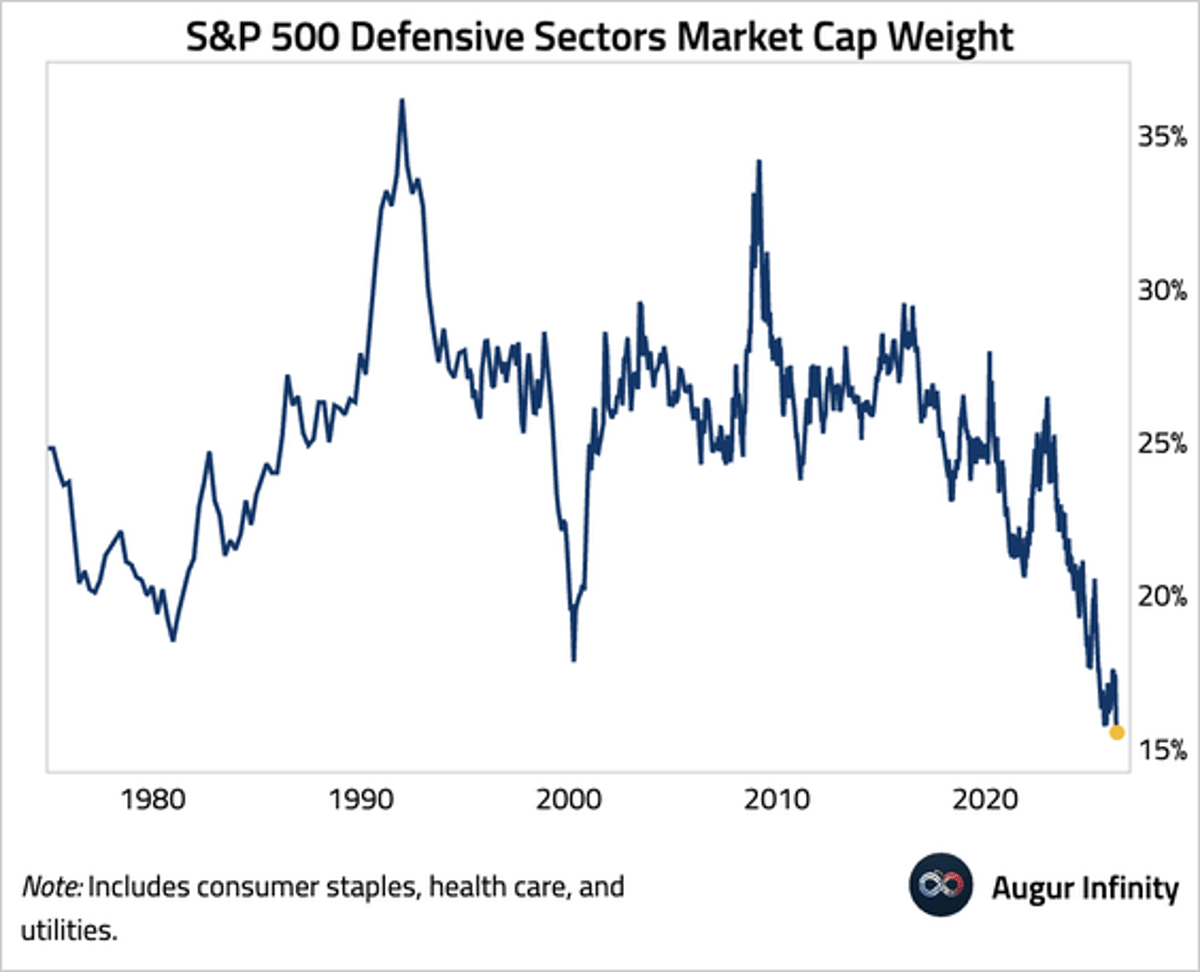
Defensive S&P 500 Sectors Hit Record Low Weight
The market cap weight of defensive sectors in the S&P 500 has fallen to a record low @augurinfinity https://t.co/KvIcxIReRU https://t.co/N5uatfPACb
Cerebras Systems Launches $3.5 B IPO at $115‑$125 per Share, Targeting $26.6 B Valuation
Cerebras Systems announced an IPO of 28 million shares priced between $115 and $125, aiming to raise up to $3.5 billion and achieve a peak valuation of $26.6 billion. The offering is led by Morgan Stanley, Citigroup, Barclays and UBS, and includes a...
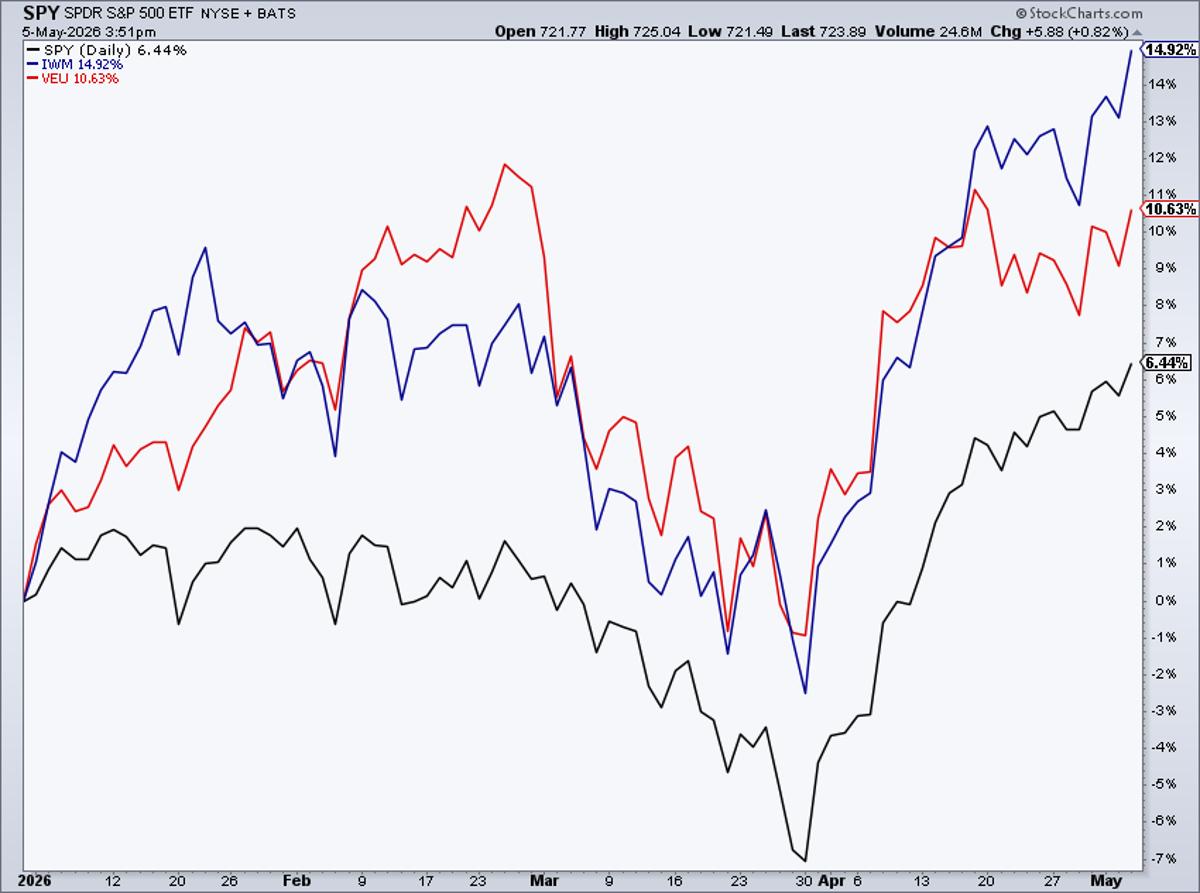
S&P 500 Lags Small Caps, International and MAG 7 ETFs
As the market supposedly hinges on the AI trade, the S&P 500 badly lags small caps and international stocks YTD $SPY $IWM $VEU Even worse for the S&P 100 ETF $OEF ... and even worse for the Mag 7 ETF...
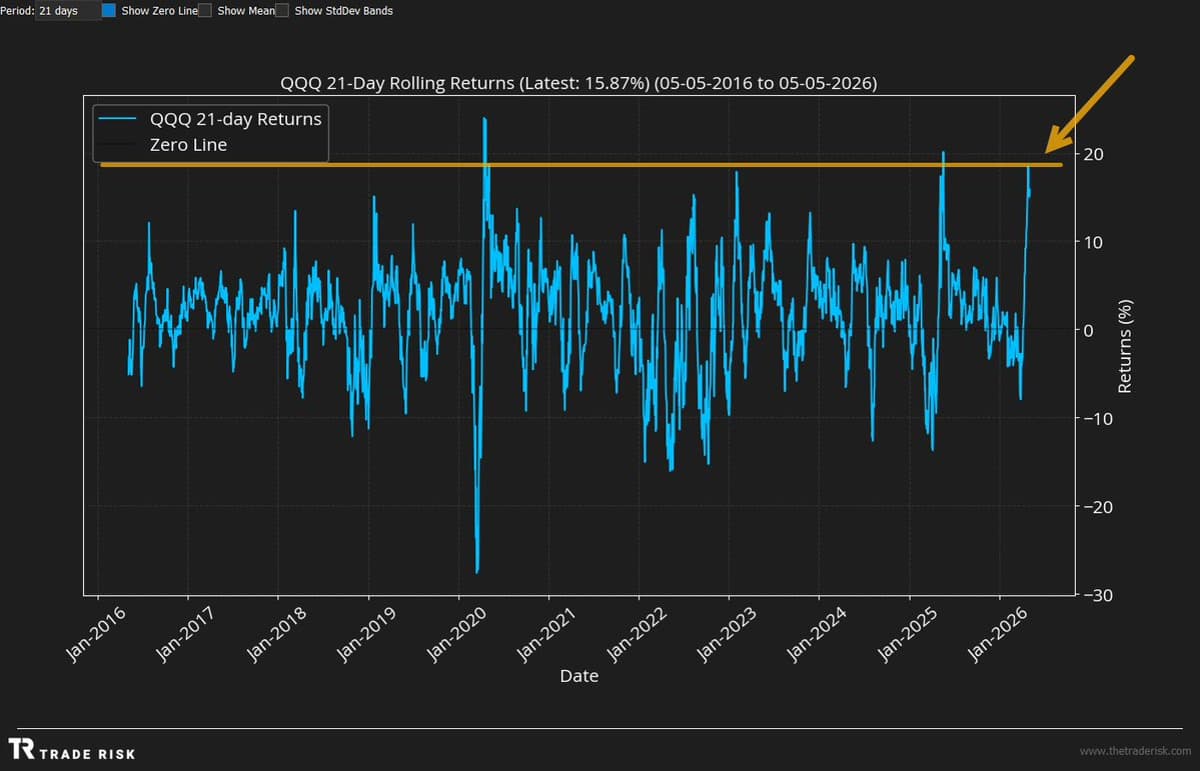
Nasdaq 100 Near Decade‑Best One‑Month Returns
One-month rolling returns for the Nasdaq 100 are approaching “as good as it gets” territory looking back 10 years. $QQQ https://t.co/dTWf01sTfH

Bulls Fueled by Groupthink, Not Fundamentals
Raging Bulls Run On Groupthink $SPX $AMZN $GOOGL $META $MSFT $NVDA Flows over Fundamentals, Part 3 😉 #LiveTradingRoom https://t.co/2x9sbANZVq
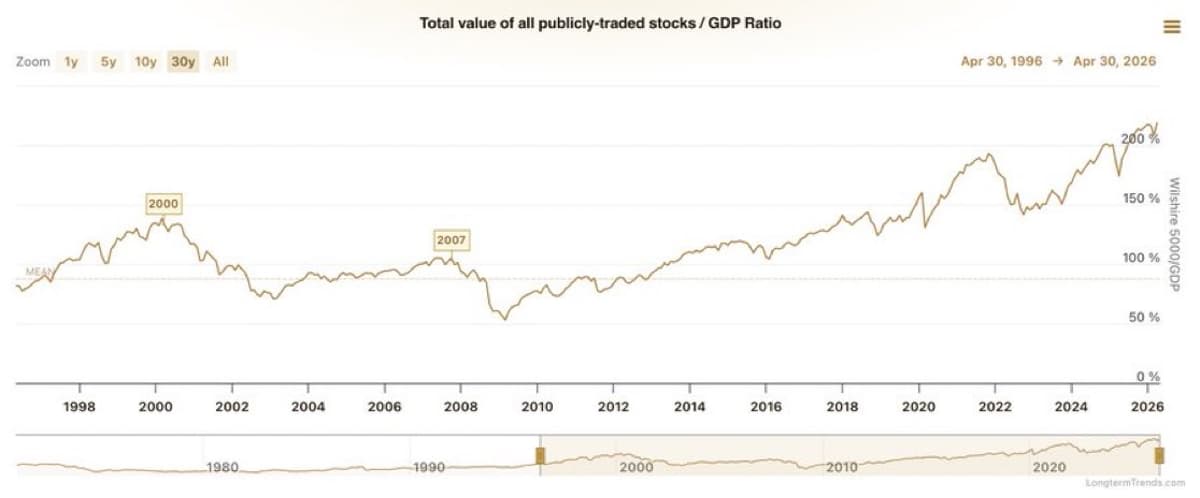
Market Hits Record Valuation, Buffett Indicator Tops 227%
Stock Market reaches it’s most expensive valuation in history after the Warren Buffett Indicator hits 227%, surpassing the Dot Com Bubble and the Global Financial Crisis: https://t.co/c3rpLbz8So

Mega IPOs Push New Billionaires Toward US Asset Purchases
the equity supply/demand picture could definitely be complicated by the behemoth IPOs this year. but then i ask, what do newly minted multimillionaires and billionaires do with a flood of liquidity? marginal propensity to consume nearly topped out… i think they...

US Index Rebounds to Record in 25 Days
I don't know if investors are truly "looking past the war in the Middle East," but it's pretty amazing that a major US stock market index took just 25 trading days to go from war jitters lows...to record highs 👇
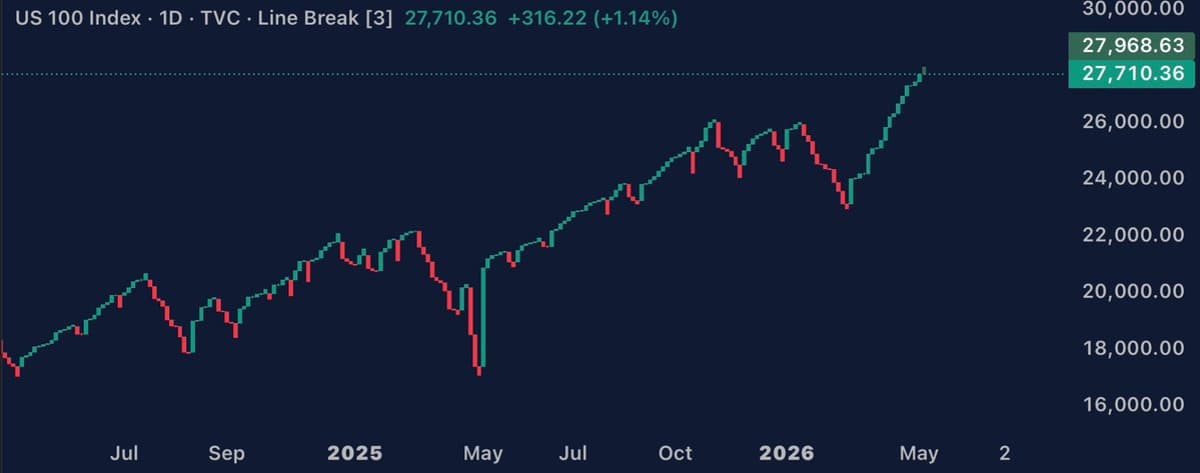
Nasdaq Surges 22.6% in Five Weeks, Hits Record
The Nasdaq just hit a new all-time high at 27,968. It’s up 22.6% in only 5 weeks, adding more than $6 trillion in market value. 🚀 https://t.co/PMyNwOB7V6
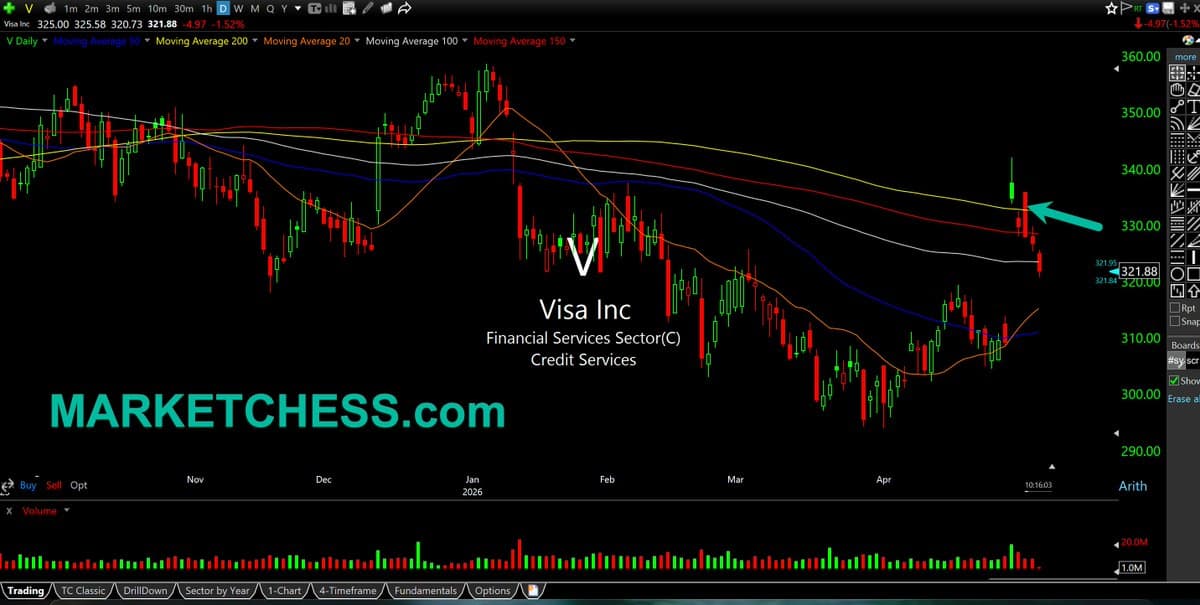
Market Split: Chip Stocks Soar as Majors Slump
$V Daily. Visa, and the likes of $CMG $NKE $LULU all red again. Incredible to see the bifurcation in this market still playing out as memory chips like $MU rally into the sky and nearly disappear into the atmosphere. https://t.co/adJJ4TDZtB
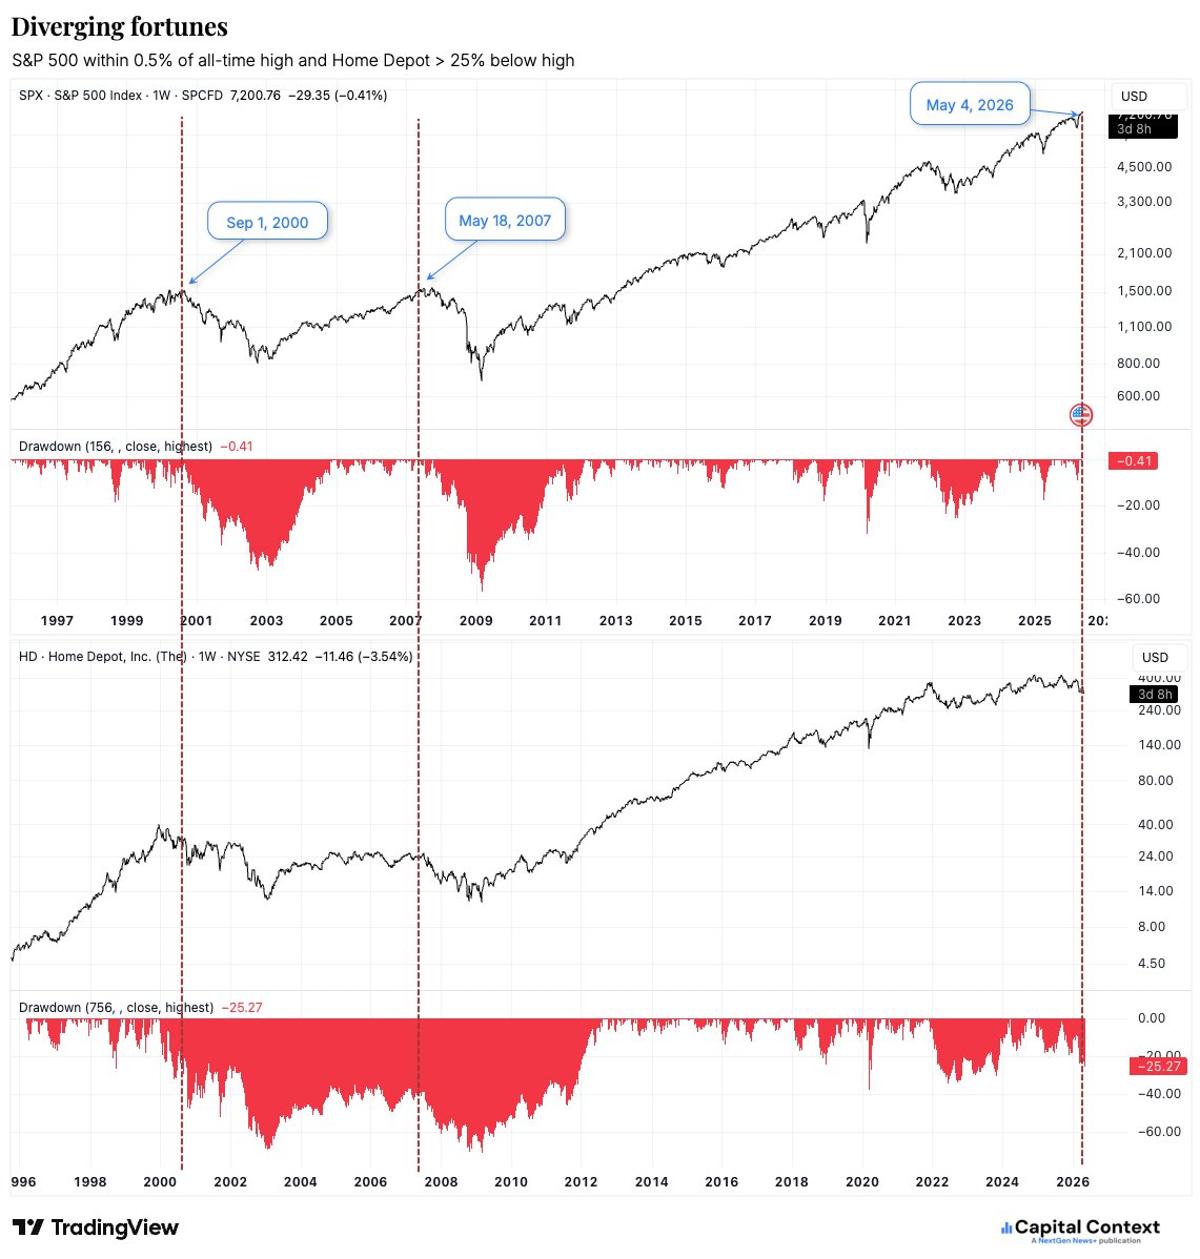
S&P Hits Record, Home Depot Plunges 25%—Rare Divergence
S&P 500 $SPY at/near all-time high while Home Depot $HD is more than 25% off. 3rd time in 30 years. Oh, well. This time is different. https://t.co/4WQAXlMCTv

Breadth Weakness Matters only without Strong Leadership
Concern for market breadth should ALWAYS be taken within the context of market construction and current leadership. Breadth Weakening less of a concern when we have solid offensive leadership and "big guys" participating.
S&P 500 Bread
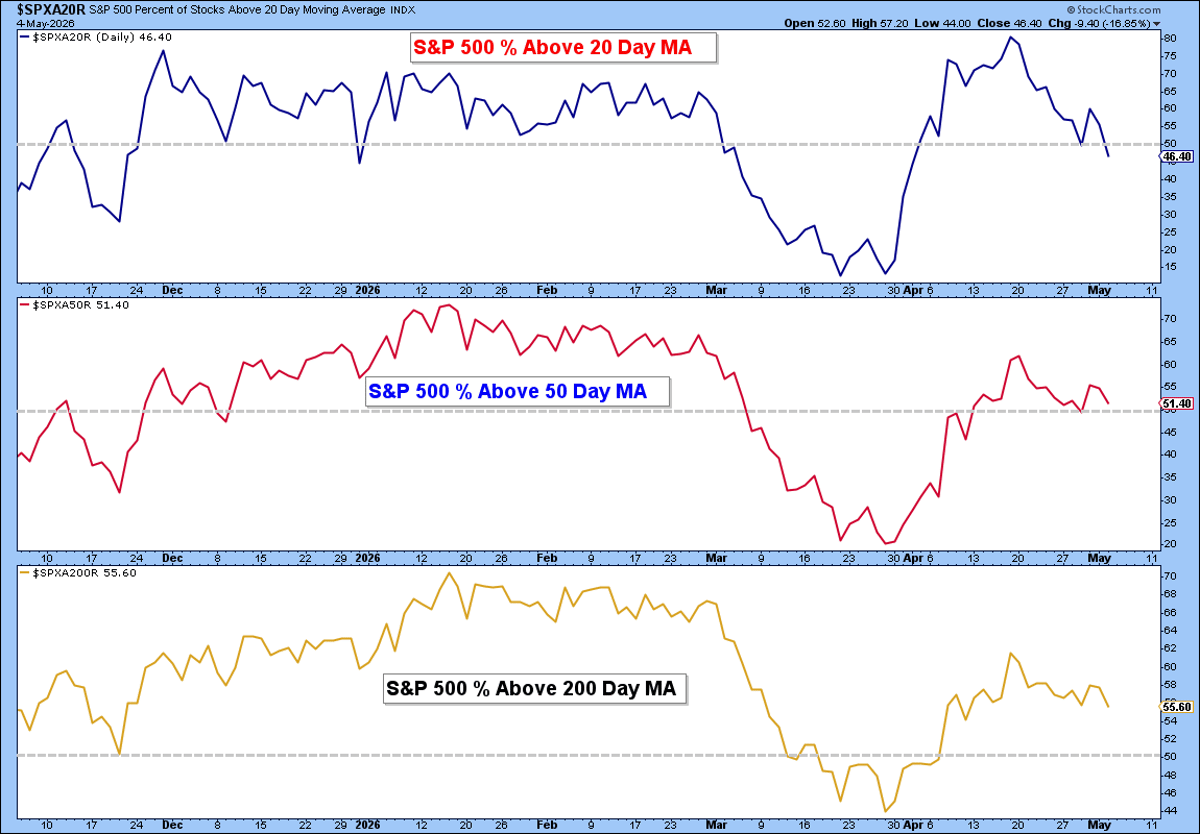
Not a call to be bearish just a data point to be aware of. Breadth weakening under the surface for the S&P 500. https://t.co/LcO3zUQv6W
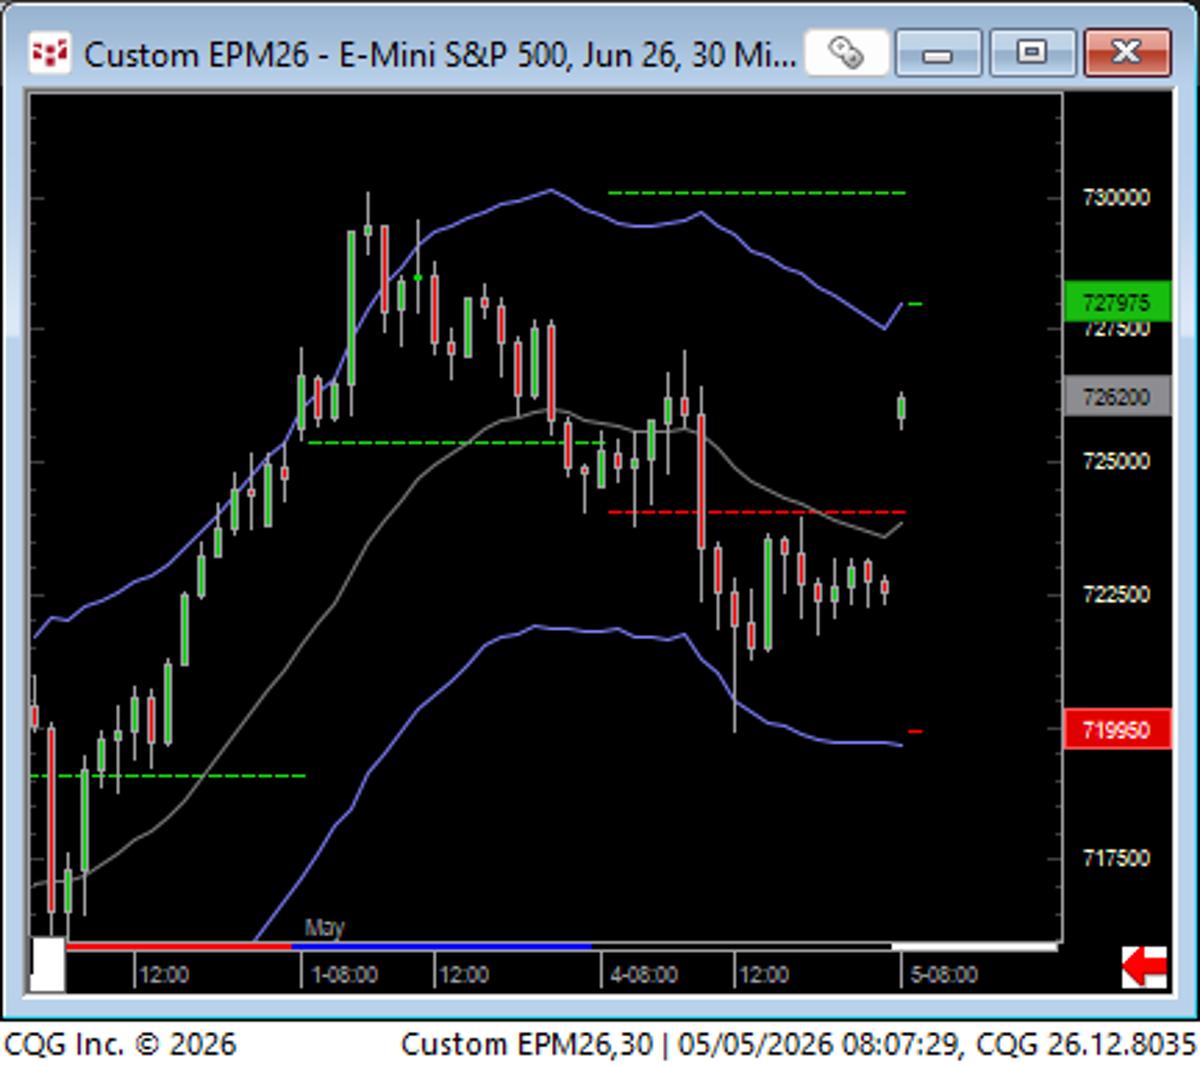
SP Opens Mid-Range After Two-Day Trading Range
SP: 8 AM reading - opens up in the middle of the previous 2 days trading range. https://t.co/kfcaaIJInP