Know What's Happening in Stock Trading
Know What's Happening in Stock Trading

Moving Average Crossover Strategy Shows 6.9% Annual Return in Backtest
The moving average crossover approach generates mechanical buy or sell signals when a fast and a slow average intersect. Common pairings include 9/21 EMA for short‑term trades, 20/50 SMA for swing trades, and the classic 50/200 SMA Golden Cross for long‑term trends. Backtests of the Golden Cross from 1960 to present delivered a 6.9% annual return.

The U.S. dollar opened the North American session mixed, firming against the euro and pound while slipping against the yen after testing 2026 highs. Technical analysis highlights key support and resistance levels on EUR/USD, GBP/USD and USD/JPY as traders brace for range‑bound action. Oil prices climbed despite a 172 million‑barrel Strategic Petroleum Reserve release, buoyed by ongoing Middle‑East tensions and attacks in the Strait of Hormuz. U.S. equity futures fell and yields edged higher ahead of key labor and trade data releases.

Gamma exposure for the combined $SPX + $SPY view shows mostly negative exposure under spot. $6700 is a key support level; if it breaks, we could see a move towards $6650 pretty quickly. The range we are currently in is...

Another day… another downside gap at the opening… and another test of the support at the December low. $SPY would have to rally to 673.34 and $QQQ to 605.03 to fill today’s gaps. How quickly they get filled -- if...

Gold is losing its traditional safe‑haven status as it increasingly moves in tandem with equity indices and opposite the U.S. dollar. The dollar’s recent strength has turned it into the preferred short‑term store of value, leaving gold vulnerable to equity...

#Corn story seems to be getting more and more bullish and the #soybean story seems to be getting much more negative. This isn't a production issue for soybeans such as hot and dry weather cutting the crop. The...

Order Flow Trading Momentum trades: - Check for thin book ahead (less resistance in the direction of the move) - Check for aggressive volume bubbles (green for longs, red for shorts) - Check for trailing limit orders (support/resistance building behind the move) Mean reversion trades: -...

XRP’s price action has been dominated by corrective phases since 2022, with impulse moves now fading rapidly. The latest technical analysis indicates the market is transitioning into an allocation phase, where investors begin positioning for longer‑term moves. The author provides...

Silver near $85.7; VC PMI & Square-of-9 point to $93–95 then $105. Risk: break $90, target $95–105 🔺 — Viktor Kopylov, PhD, CFA. More insights: t.me/si14Kopylov

With a stop loss at $192, where $NVDA has not been able to break out above, the risk is $10 from here with $40 upside (short) down to $142. Great risk / reward. Oh by the way, $NVDA is 7.7%...

Dow Jones futures fell 1.1% as crude oil prices jumped above $90 per barrel after tanker attacks in Iraq and Iranian‑linked threats in Oman. The International Energy Agency called for a record 400 million‑barrel strategic‑reserve release, with the U.S. committing 172 million...

Lennar $LEN - reporting today... currently more than -50% from highs... and a contestant on the 52-week new lows list (and multi-year new lows list)... https://t.co/gPTOqr0qj4

U.S. dollar $DXY, volatility $VIX and yields $TNX all rising in tandem > 20-day EMA... https://t.co/Dv49pGJIRC

The iShares Russell 2000 ETF (IWM) has slipped 3.8% over the past 30 days, trading near its year‑to‑date breakeven at $251.88. Despite a broader risk‑off shift away from small‑cap equities, IWM remains above its 126‑day moving average, roughly $250, providing technical...

Open Text Stock Price Crosses Below 50-Day Moving Average. Here's What Happened. (MarketBeat) #OTEX #Technology #Stocks #Valuations #JVGpost https://t.co/brHJMM3wep https://t.co/zKbPrCs6RV

Futures are struggling with the WTD AVWAP, a break of the overnight lows could be troublesome $ES_F $NQ_F https://t.co/pQGwLxlyHR

Arista Networks (ANET) is navigating a 19‑week consolidation pattern, with an official buy point at $164.94 and an earlier entry near $151.80. The company posted Q4 earnings per share of $0.82, a 24% increase, and revenue of $2.49 billion, up 29%...

Ok...let's do some thinking this morning. The "Bull Case" was breadth being strong. The "Bear Case" was Momentum, Risk On vs. Risk Off, Credit Spreads, Defensive Leadership.... Now breadth has weakened and the other variables have only gotten worse.....

#ALFA hit 9% although the FY Results read very well. ShareScope has fwd p/e 19.4 RISING to 19.8 and fwd Divvy 2.6% FALLING to 0.9%, BEFORE drop today. I guess AI fears are hurting but ALFA claim AI will help...
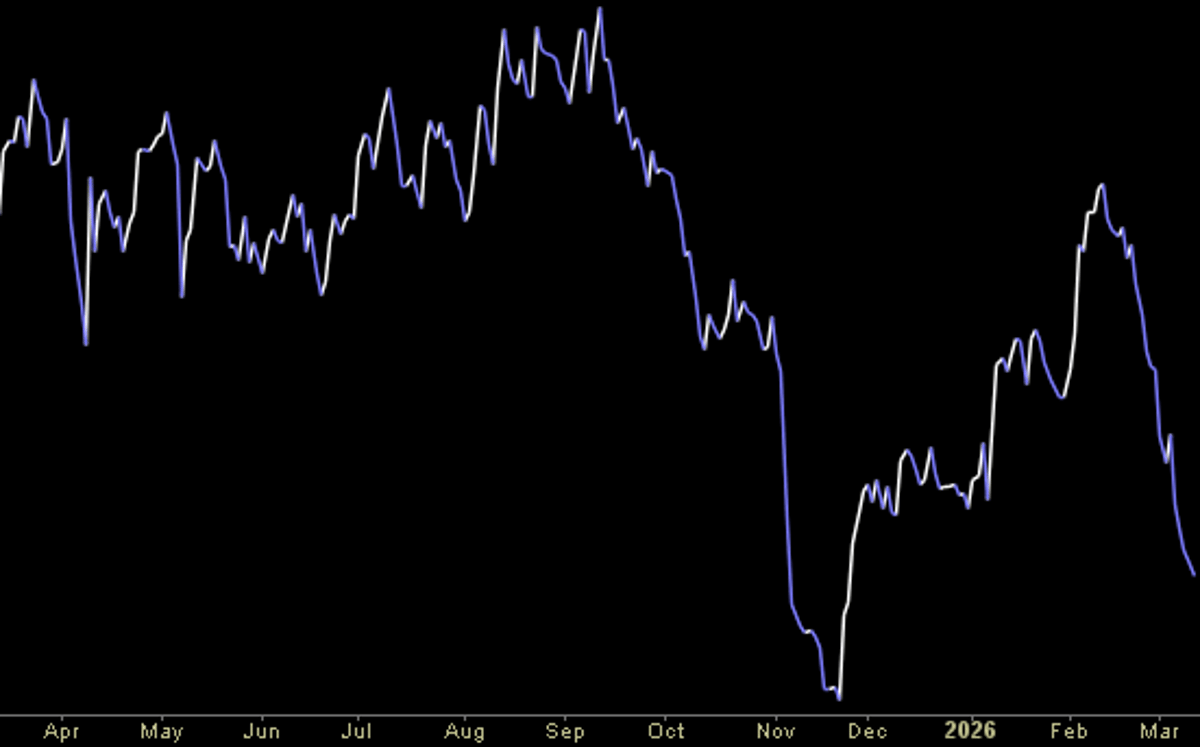
The Hedge Fund Trade Tip (PIN) post is gated behind a login, offering no public text beyond a membership prompt. An accompanying chart tracks a stock’s price from April 2025 to March 2026, showing early volatility, a sharp fall in late fall...

This is what you'd like to see. Consolidating within this range, and in the meantime, more strength is going towards the #Altcoins. As long as the 21-Day MA holds as support, I would suggest we'll see more momentum coming into the...

Oil (white) and the 10yr treasury yield (green) are going in the wrong direction ... up! Wen bailout? https://t.co/BCYqJRrZpQ

Serve Robotics reported a strong Q4 2025 earnings beat, lifting the stock to $10.66 and sparking a double‑digit rally. The company accelerated its rollout of autonomous delivery robots, adding White Castle and new contracts with Uber Eats and DoorDash. Short interest sits...

Gas Oil has retest support and should now push higher, although one more retest is possible https://t.co/NI5aQRpZPM

Most traders get chopped alive in Asia and London sessions. Not because they're bad traders. Because they ignore one simple signal. When your long-term MA and short-term MA are hugging each other, the market has no conviction. No conviction = no trade. The...
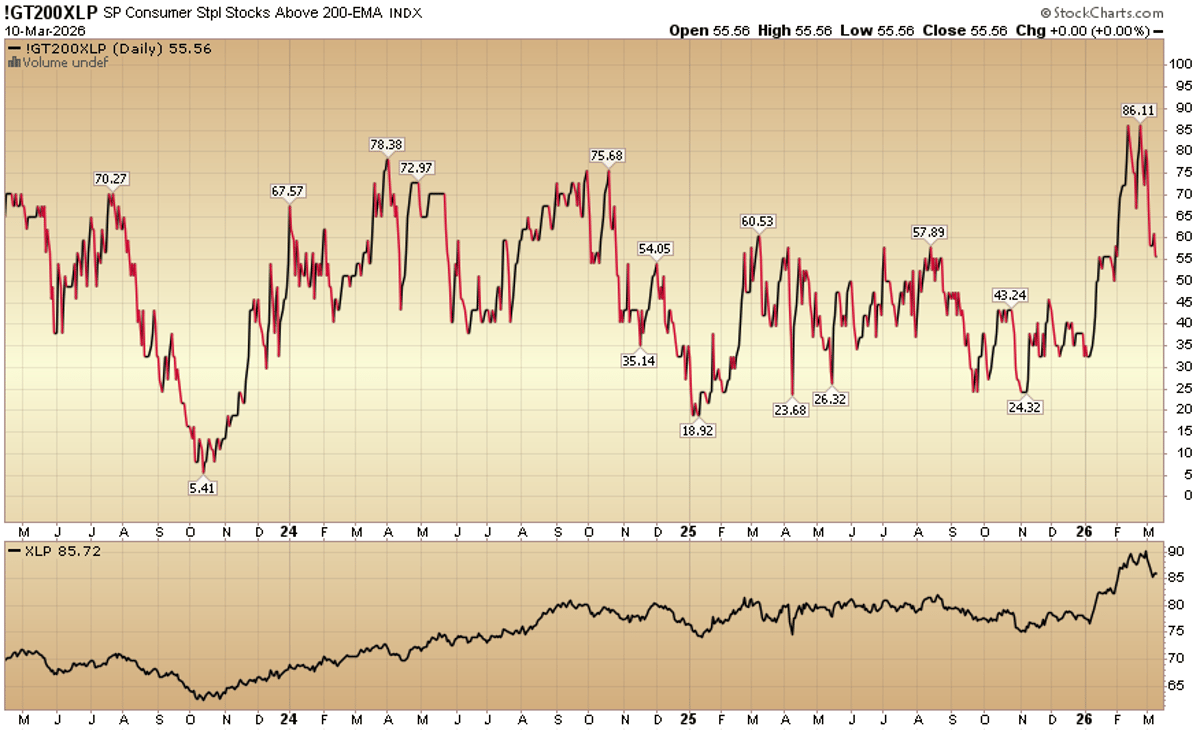
The S&P Consumer Staples Index has moved above its 200‑day exponential moving average, a key technical signal often interpreted as a bullish trend. The crossover suggests that the defensive sector is gaining upward momentum after a period of volatility. Investors...

$QQQ - The bullish engulfing candle on Monday didn't have follow through in the last 2 days. It has to close above the 100 day MA to in order to confirm an intermediate term low. The odds favor that it...

Wave 2 retraces 50–61% of the length of Wave 1. Wave 4 retraces only 38% of the length of Wave 3, and then you get Wave 5, which is typically the same length as Wave 1. What does all this mean? It means...

If the markdowns continue for equities, then the Mag7 will likely break support (below). That could be enough to turn what so far has been a 4% SPX drawdown into a more bona fide 10% correction. We can see from the...

Oil volatility is back 🔥 One VWAP Bounce this morning paid before 8AM. In strong trends, VWAP becomes dynamic support, not mean reversion. Most traders fade it… Professionals buy the pullback. Comment VWAP and I’ll send the free guide + Discord. #trading #futures #vwap
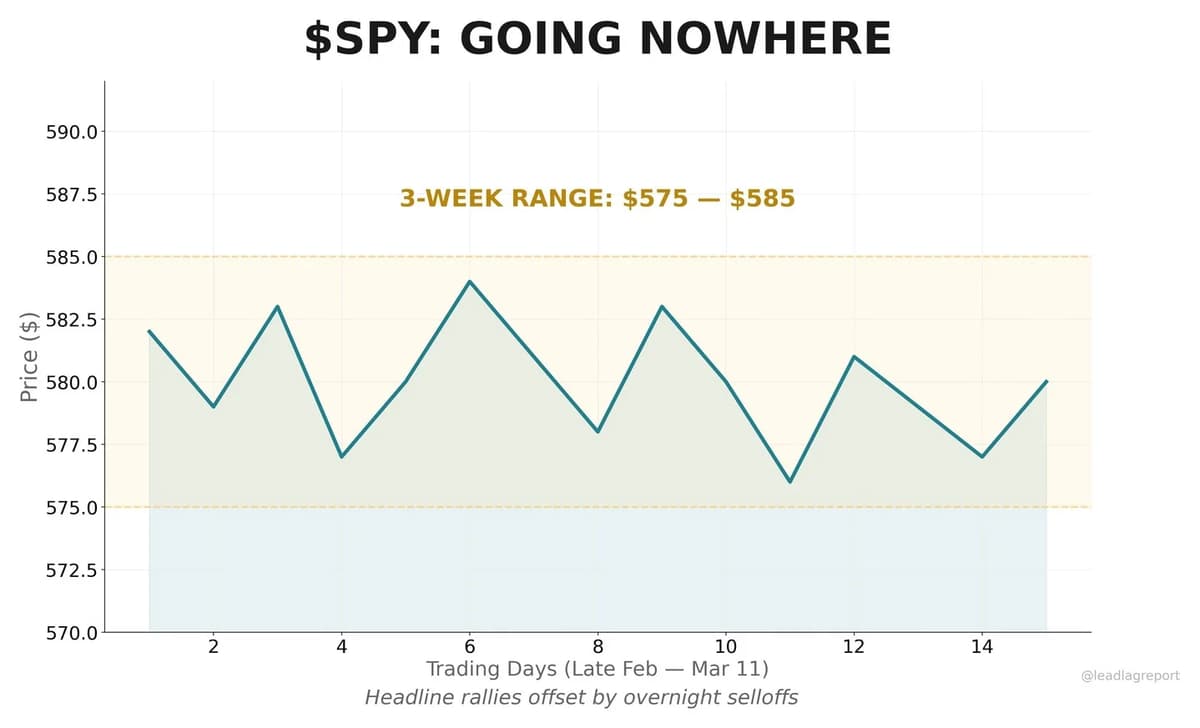
$SPY has gone nowhere in 3 weeks. Stuck between headline rallies and overnight selloffs. Range-bound markets after a shock aren't stability. They're indecision before the next leg.

Check in – Broadcom Inc. (AVGO) Recommendation: STRONG BUY Price: $342.58 Intrinsic Fair Value: ~$450 (anchored on 25–27x 2026E EPS ~$17.51) 12-Month Price Target: $440–$460 (Base, +28–34%) Current Signal: TACTICAL BUY Entry Zone: $325–$335 (50-DMA support pullback) Fair Pricing: AVGO trades at 19.7x forward EPS amid 57% guided...

Check in – Taiwan Semiconductor Manufacturing Co. (TSM) Recommendation: STRONG BUY Price: $352.59 Intrinsic Fair Value: $428.00 (Based on consensus & AI-driven growth models) 12-Month Price Target: $430.00 (Base case aligned with analyst avg ~$418–$470) Current Signal: TACTICAL BUY Entry Zone: $340.00 – $355.00 (Near 50-DMA...

claude, buy norwegian equities every time Bodo/Glimt scores a goal. don’t hedge the FX. make no mistakes

#FTSE100 doji Candle and Sideways. Support 10082, 9630. Resistance 10636, ATH 10935. RSI 48.5 near Neutral. Doing 13/21 day EMA Bear Cross. Bottom Bollinger Band 10075. Midpoint Line 10530. Top Band 10978.

#DAX doji Candle and dropped back into the Gap from yesterday. Support 23342, 22927. Resistance 24061, 24367. RSI 40 not low. 13/21 day EMAs Bearish. Bottom Bollinger Band 22852. Midpoint Line 24170. Top Band 25470.

#BrentOil Comp Doji Candle and Sideways. Support $84.1, $80, $73.2, $66.8. Resistance $95, $100, $108.2. RSI 70 Overbought. Top Bollinger Band $105.6. Midpoint Line $85.3. Bottom Band $64.9.

What would you say the prevailing trend is for the $SPX? That is a question of time frame of course, but there is a multi-week descending trend channel tentatively forming against the larger bull trend from last April's Liberation Day tariff...

My first tweet predicting $1.10 would be a level. At the time $AMC was barcoding $1.50. I told you that this level was where $AMC would fight for its soul.

This could be an important chart. Discussing it today with members of the Factor community at https://t.co/gDeM5nTRIY $FGBL1! https://t.co/4KCxWZ88fE

$SPX -0.08% and closes smack-dab in the middle of its intra-day range. Was it a failure to go up or an inability to go down?

📈CBOT November soybeans pushed higher on Wednesday, ending at $11.63-1/4 per bushel and marking their 11th consecutive session in overbought territory (RSI of 70+). Relative strength index has reached 85. Last time new-crop bean RSI was 85+ in year of expiry?...

Your daily reminder that we’re still in a trendless market at the index level. Don’t spin your tires too fast trying to force trades within the chop fest. https://t.co/T9j49HfLtq

Consumer staples getting some of that premium knocked out of them over the past week. If you wanted a pullback you're getting it. $XLP https://t.co/ro0tAusmFy

This is how the single print cave fill area looks on Damon's market profile charts where he is working this live... @DamonPavlatos https://t.co/mGAgEsHYQ4 https://t.co/zoRmbEuifu

Australian Dollar Forecast: AUD/USD Resistance Under Siege – Bulls Eye 7200 https://t.co/Z4xmadvNgr $AUDUSD Weekly Chart https://t.co/GZy1mBhw92

The index trend matters first. Understand the trend and make trades based on that trend.

$QQQ resistance on underside of 20sma, so needs to get over 615. Support near 572. Tons of noise in between. https://t.co/pyLqnAyrf6

Until that supply and trendline taken out bias short term with bears towards 200sma $SPY https://t.co/C6tM7zhQhj

So far so good $SMH against 20sma weekly support. Fantastic tell going forward even if you don't trade SMH https://t.co/Q73Q72lzBz

These are the setups of the best traders I’ve interviewed: Catalyst Gaps Base Breakouts Mean Reversion Long Mean Reversion Short Pullback/Undercut & Rally They allow you to manage risk versus a key level/turning point where you can expect significant expansion from your entry