Know What's Happening in Stock Trading
Know What's Happening in Stock Trading

Arm Holdings shares rally on AGI‑optimized CPU launch
Arm Holdings' stock jumped after the company unveiled an AGI‑optimized CPU aimed at efficient inference for agentic AI. Analysts likened the move to Nvidia's recent surge, highlighting Arm's architecture dominance and growing adoption by firms such as Meta and OpenAI.
Also developing:

GAM's head of global equities, Paul Markham, cautioned that the recent market relief rally is unlikely to endure. He expects investors to stay wary despite the bounce, citing potential volatility from ongoing geopolitical tensions. Markham is keeping his current stance—long technology, short banks—and is moderately bullish on industrial firms benefiting from AI. He warns that frequent portfolio changes could lead to whipsaw losses in such an environment.

📺 SEMIS ARE LEADING AGAIN? Join Power Plays: https://t.co/m0rkY6jL0N Late last week, I suggested focusing on semiconductor plays: Broadcom $AVGO, Marvell $MRVL, and Nvidia $NVDA, which all showed relative strength and offered profitable setups. $AVGO was the clearest setup, holding above the $323...

Thrilled to be featured on @TheStreet with Caroline Woods @Cline_Woods in a piece by Rebecca Mezistrano. The topic: why panic markets create the BEST buying opportunities. This morning was a live case study. Oil at $119 → back under $97. VIX at 32...
Shriram Finance shares surged 7% on March 10, rallying from a two‑day decline as market sentiment improved following easing of US‑Iran tensions. The jump to an intraday high of ₹1,056.80 reflects value buying in the wake of a broader sell‑off in...

Why is Rohm (6963) down hard after popping so much the past two days? I wrote about it over the weekend. 1) It SHOULD be up. The approach reveals the value of the SiC biz. 2) It makes a lot of...

7x relative volume here on $BYAH in after-hours, weak 8pm close but still worth keeping on your radar. Will only begin to watch this if it can coil underneath & break over it's key 2.70 daily level. As always, no break...

SpotGamma’s Compass, Equity Hub, and HIRO flow tools identified a bearish breakdown in MicroStrategy (MSTR) after the stock slipped below the critical $165 call wall, a key gamma level. The breach triggered aggressive put buying and call selling, prompting market...
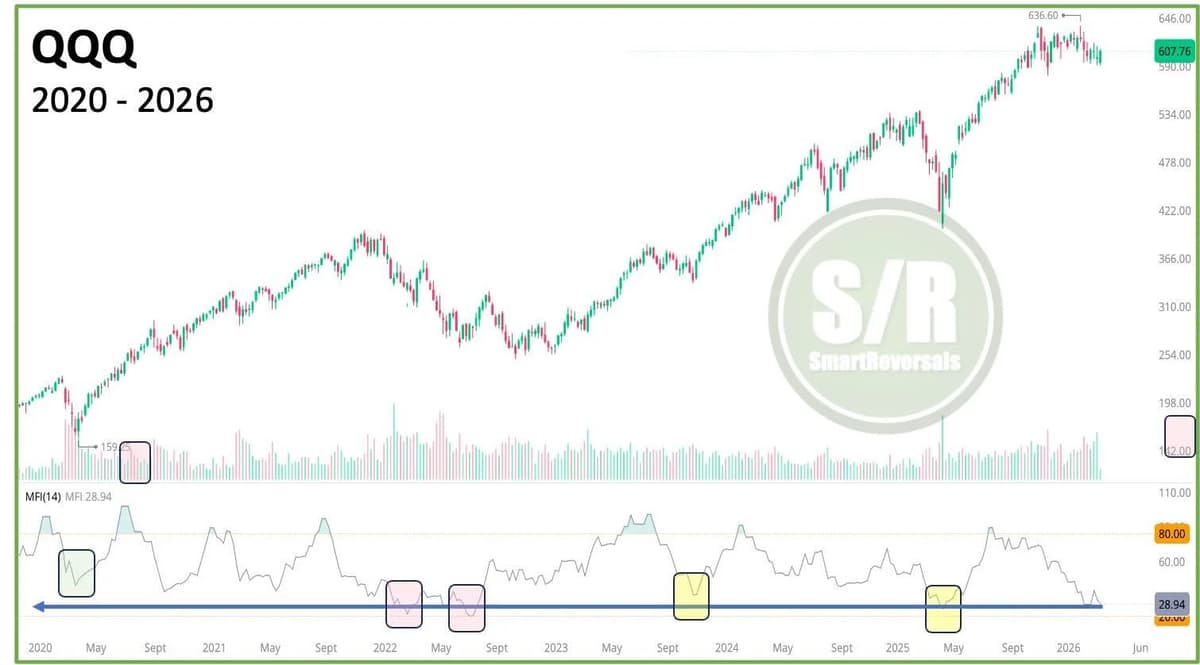
QQQ: The Money Flow Index is as oversold as the 2023 correction and the 2025 bottom. It sits BELOW COVID crash levels, exceeded only by the 2022 bear market lows. Most of the bearish move is likely in.
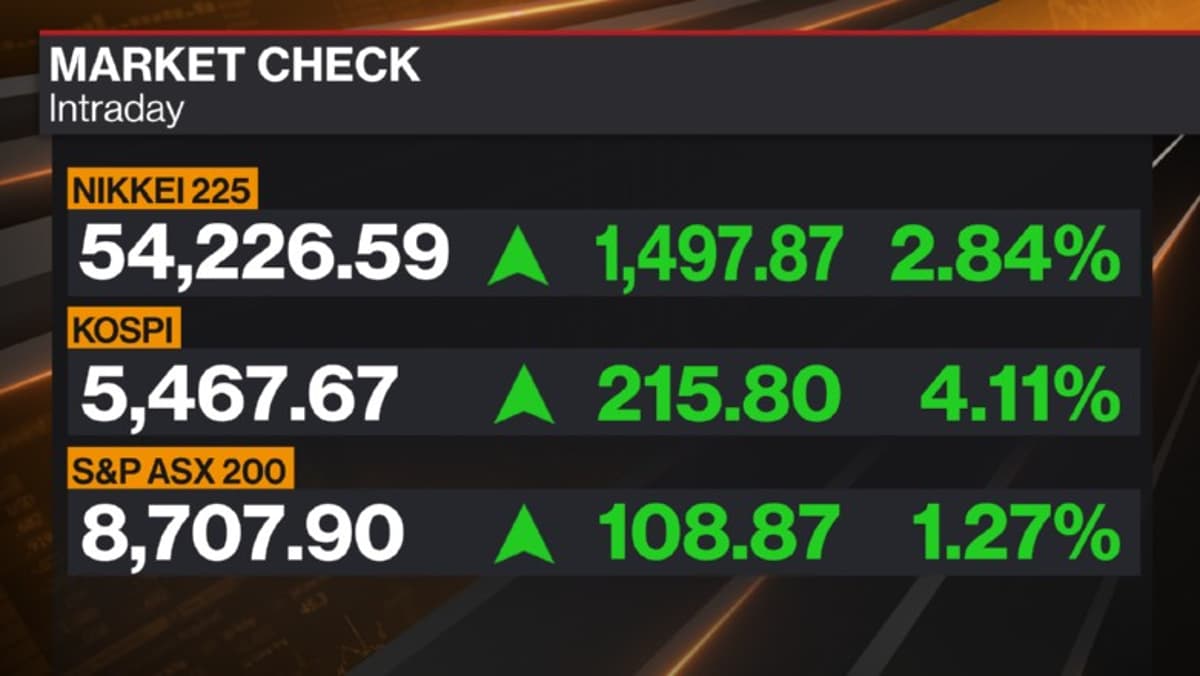
Massive sigh of relief playing through in Asia: Equities higher, oil significantly lower Tuesday. Note of nuance: - US assets have reversed direction from the Monday close - VIX futures up in Asia Tuesday - USD (safe haven recently) just turned higher We...

Dick's Sporting Goods (DKS) is trading down 2% at $193.50 ahead of its Q4 earnings on March 12, marking its lowest close since June and reflecting a 10.1% year‑over‑year revenue decline. The stock’s options market shows a pronounced bullish tilt,...
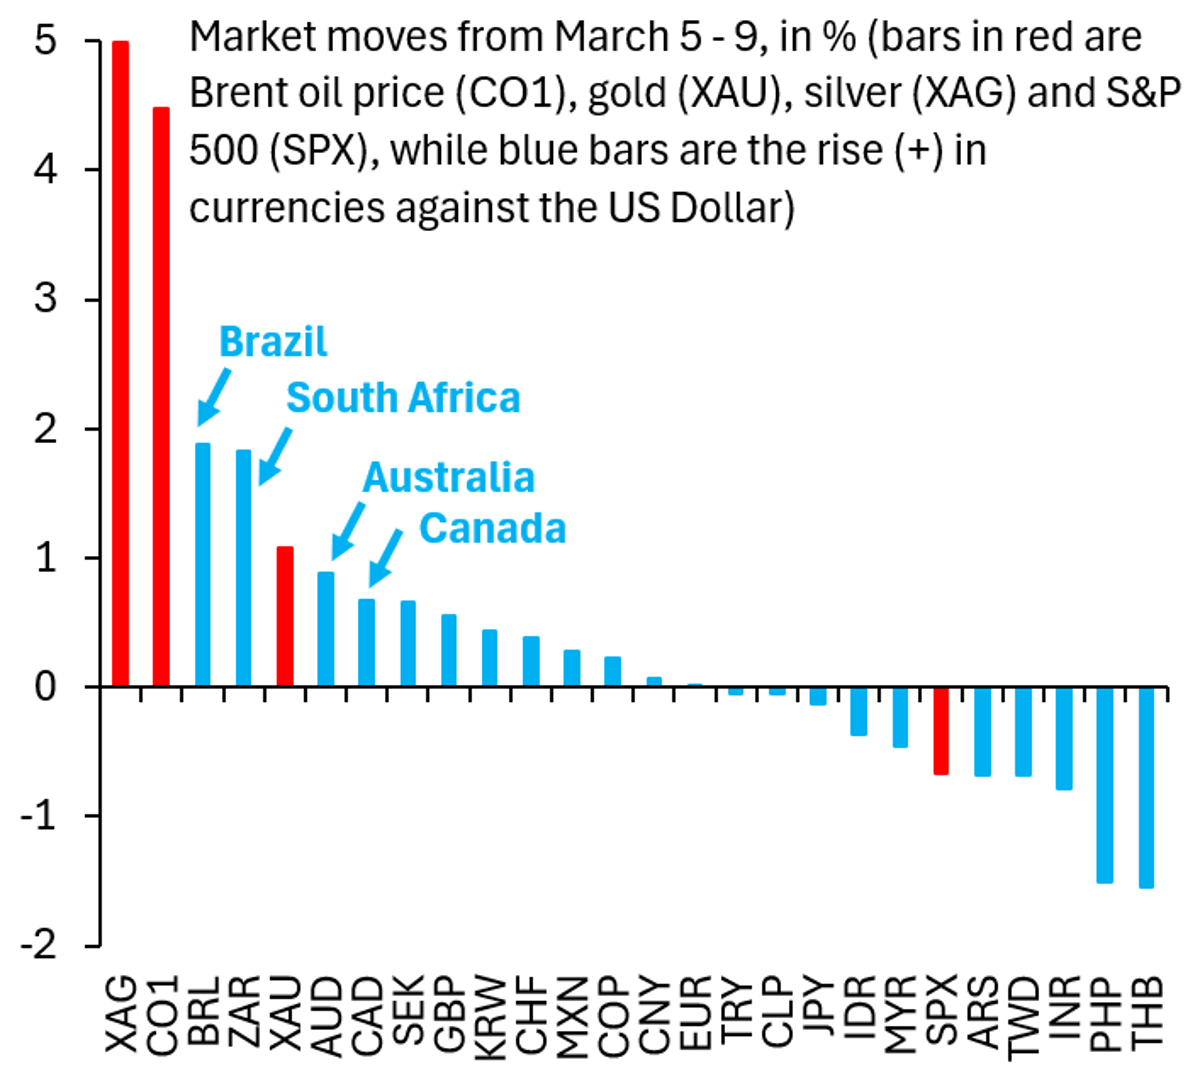
Trump yesterday said war will be over soon. Oil tumbled. As I signaled over the weekend, better to steer clear of the frenzy around oil and focus on EM differentiation. That theme's only been traded for a few days and...

#ES_F mean reversion strategy update. 13 trades since inception (May 21, 2025), 50% return (1 contract/$50K), 21% YTD. Sharpe ratio is 1.67. Link in reply below 👇 https://t.co/kptIfdqx6F

The company is aggressively expanding, targeting over 300 locations system‑wide by 2026, with early test markets delivering higher average ticket sizes, increased transaction volume, and a near‑4% lift in comparable sales. Technically, the stock has pulled back from a recent...

the massive $USO flush in final hour ystdy just brought it back to trend... https://t.co/qZjWtShXON

Bonus momentum and mean-reversion switching strategy update with new signals. +4.7% YTD vs. -0.5% for $SPY ETF. 1.19 Sharpe since inception (October 9, 2025). $TLT $GLD $TLT Link in reply below. 👇

SoFi Technologies (NASDAQ:SOFI) slipped 2.8% to $18.36, extending a 29.7% YTD loss and remaining trapped below the $20 resistance line. Despite the decline, options traders have flooded the stock with activity, logging 3.6 million call contracts and 1.3 million puts over the...

$WTI hit $111 intraday. Pulled back to $97. Still up 70%+ YTD. Markets priced in a ceasefire that hasn't happened. The Strait of Hormuz is still closed. Unpopular opinion: the high for oil is not in yet. https://t.co/Ag4wJnGVhR
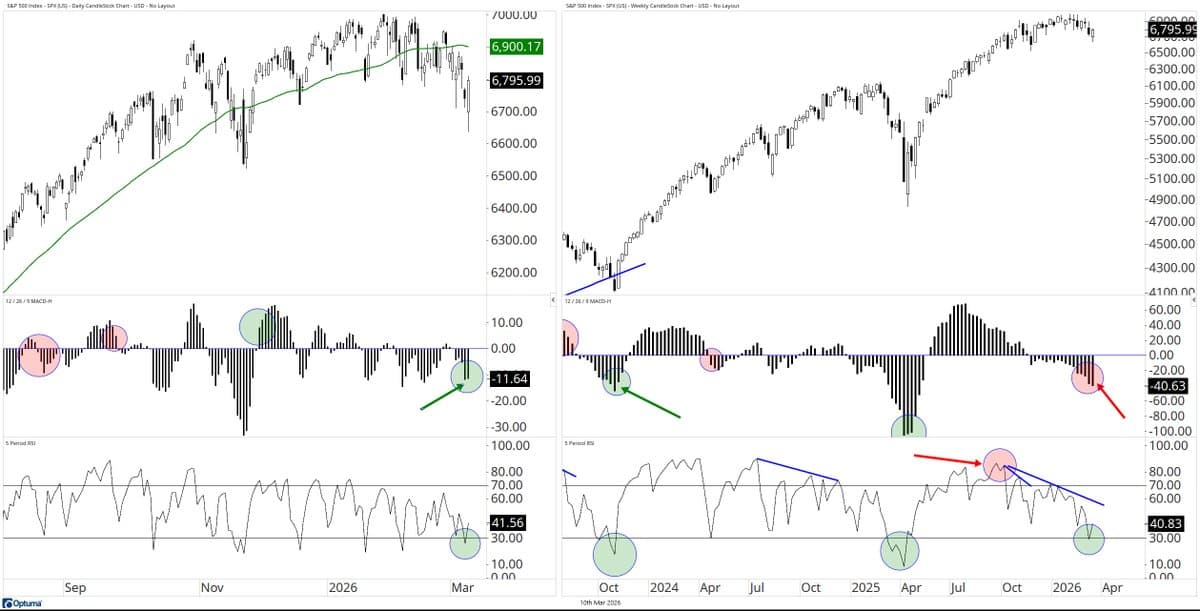
S&P 500 $SPX left: daily chart - #MACDhist ticked up right: weekly chart - early in the week and not enough to tick same (yet)... both reached RSI(5) oversold as shown... https://t.co/Avd7QYZoI2
Talked about this Friday....not the place to short the market...the bounce is expected the real question is do we get follow through.... https://t.co/kcrLhvuPuA
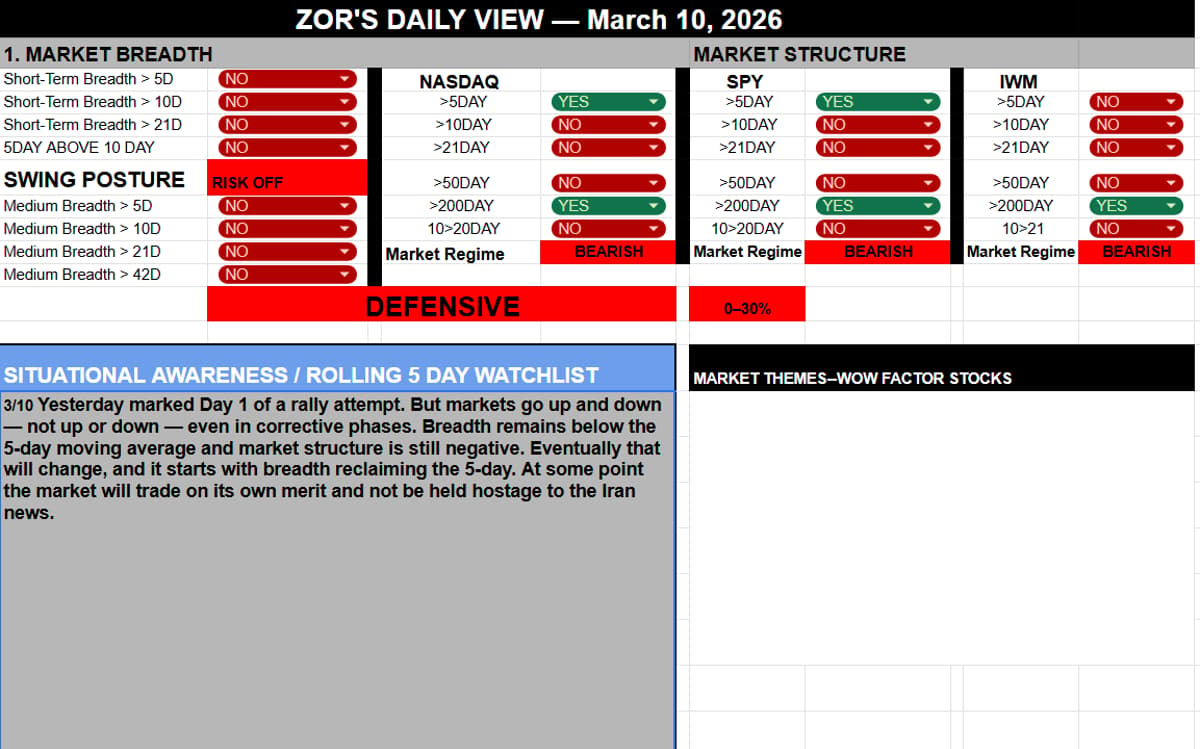
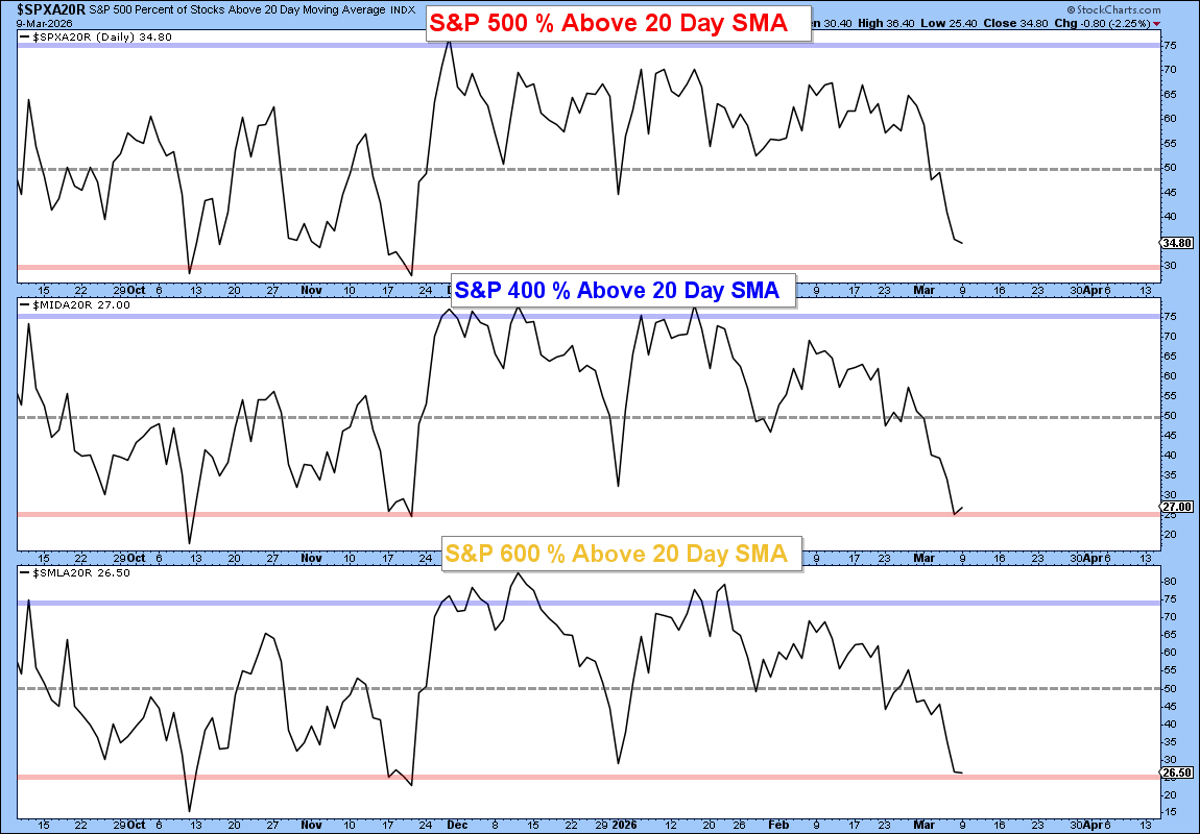
Yesterday was Day 1 of a rally attempt. But markets go up AND down — not up OR down — even in corrective phases. Breadth remains below the 5-day MA, and market structure is still negative. Eventually, that changes, and...
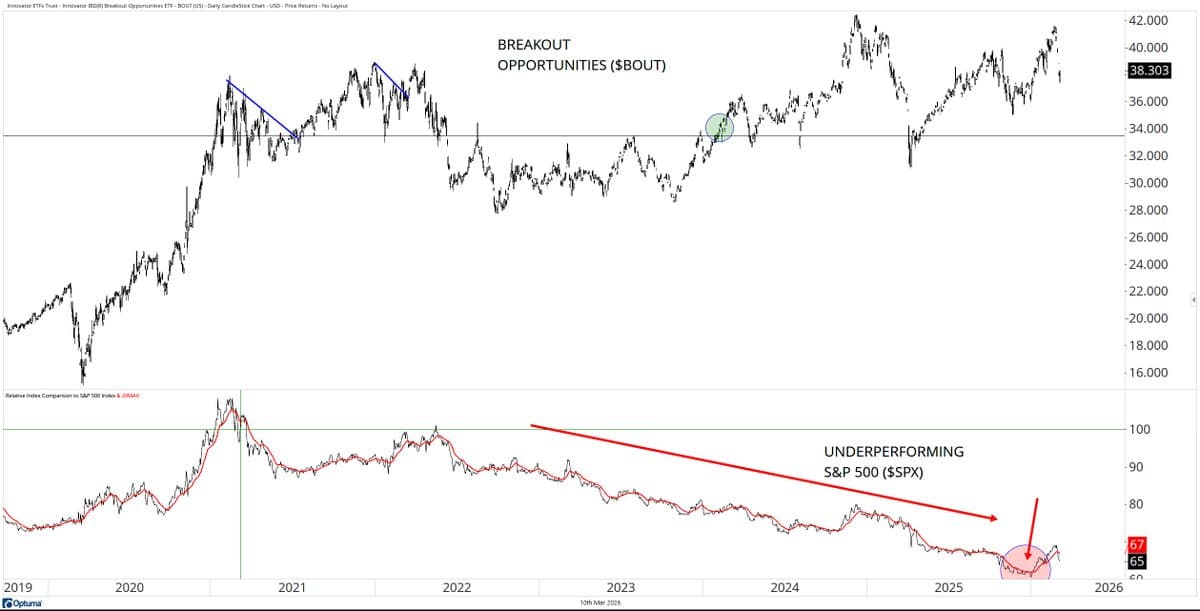
interested in your take/interpretation and if you can relate, breakout-wise, with these charts? top: Innovator IBD Breakout Opps $BOUT bottom: relative to $SPX @markminervini @OliverKell_ @Trader_mcaruso @dryan310 @chasharris1025 @MMMTwealth @the_chart_life @Zeninthemarkets @Upticken
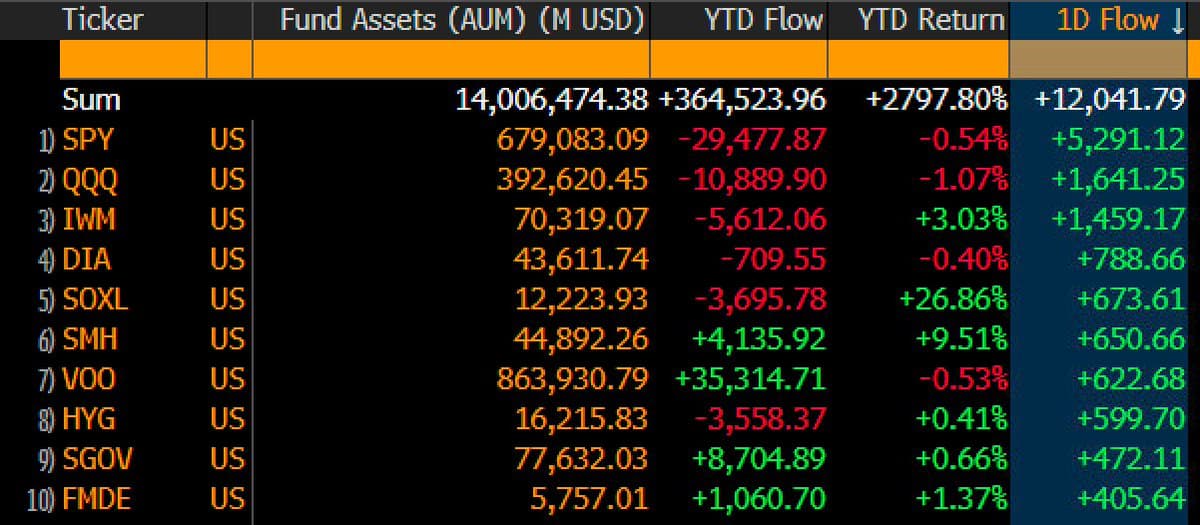
Flows did a 180 yesterday and went FULL risk-on with $12b flooding into trading crowd favorites $SPY $QQQ $HYG et al.. while $VOO (the tortoise in the wealth creation race) doing its half a bil a day regardless of the...
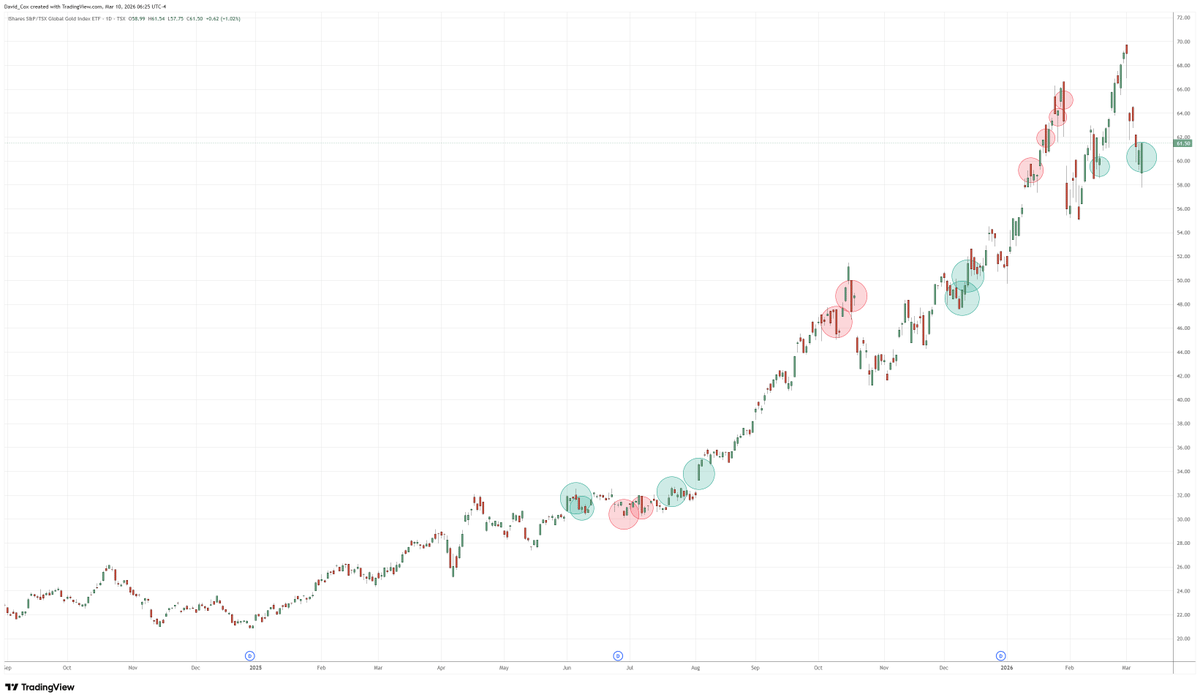
we piled back into gold stocks $XGD $GDX yesterday on the RSI(5) oversold pullback in both absolute and $TSX $SPX relative uptrends... https://t.co/9Vc1oUmaJs
Caught a 13% move on the short and then 10% the long off the afternoon lows. Pretty good day, now time for bed.

$AMD If market holds up then this one is super interesting down here given it's at a key support and large buyer defense down at the lows with small deviation below https://t.co/yzT7I4qsnq

Pretty wild to catch both sides of that expected move in a single session. Might be time to leave the rest of this volatility rodeo to the cowboys. $OIH $OIL $USO $XLE $XOP https://t.co/c9YzDXraIF
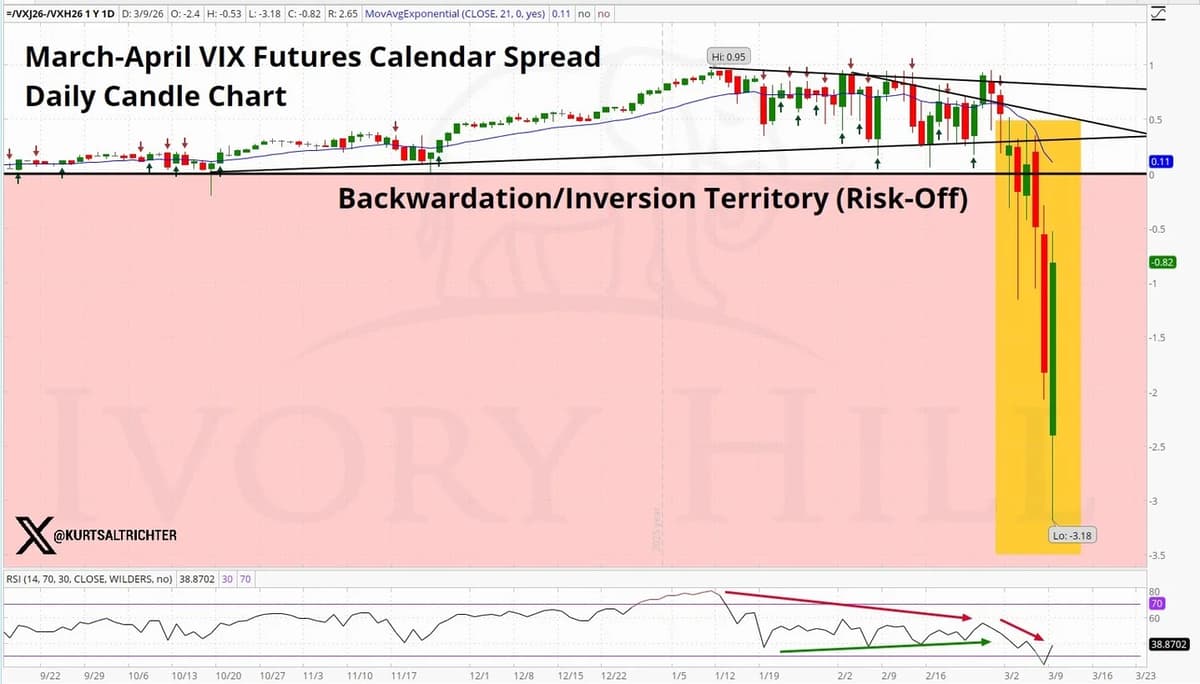
Carnage in the short-vol trade. The Mar–Apr $VIX futures calendar spread collapsed through -$2, printing a > $2.50 weekly range and a -$3.18 low. That’s roughly a 6σ move, meaning the probability was at ~0.0000002% Translation: the volatility complex violently flipped into...
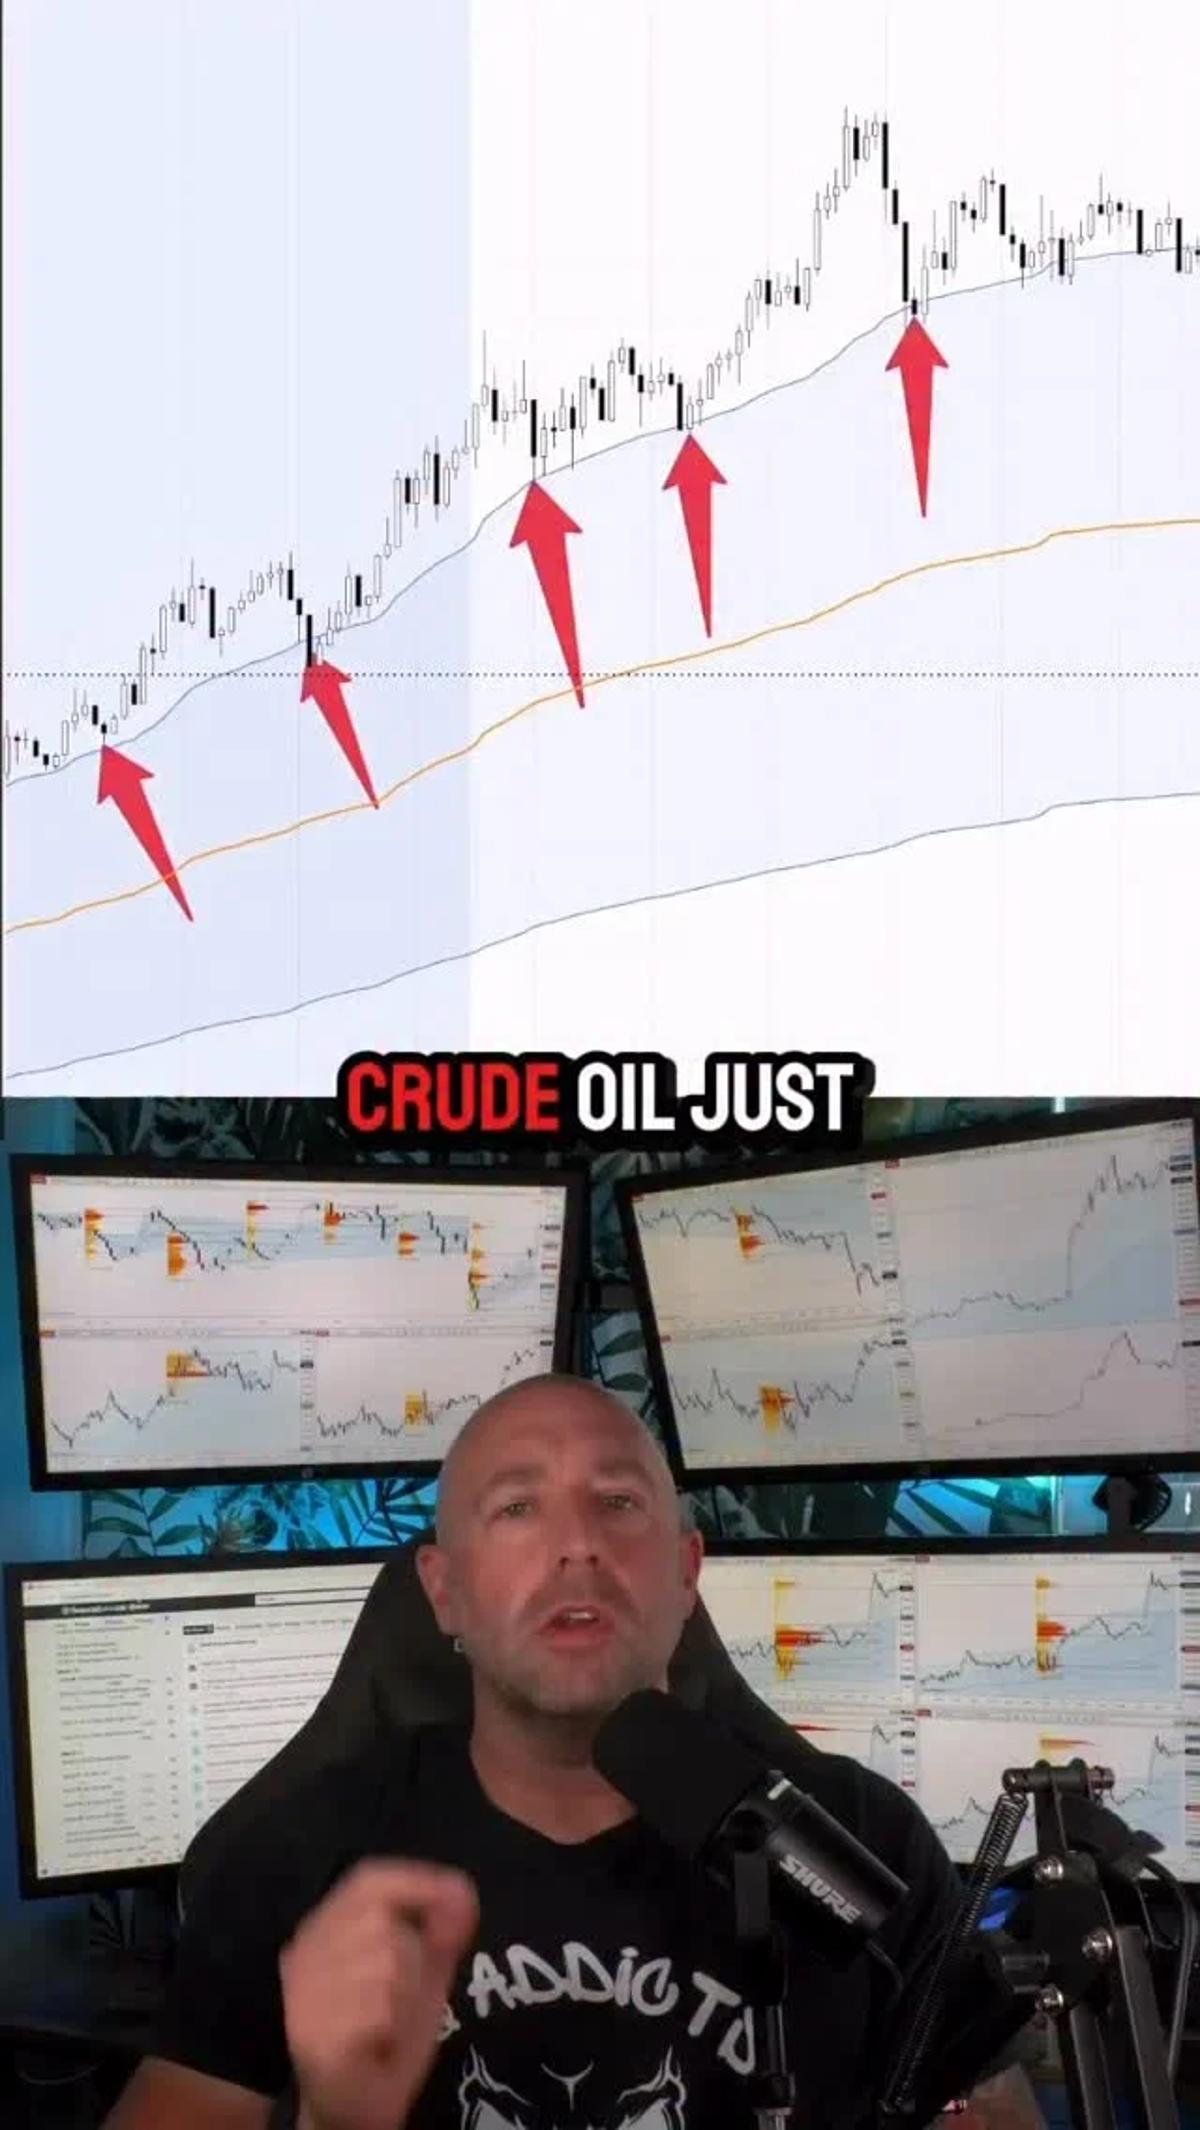
🚨 Oil just woke up. Biggest weekly move since the 1980s Then another 12% move today. Perfect trend day structure: 📈 Momentum leg 📉 Pullback to +1 VWAP deviation 💥 Buyers step in 🚀 Continuation higher Those were clean PDC trades all day. Pulled 6K trading CL today. Comment VWAP...

The Nasdaq Composite bounced off its 200-day moving average and today is Day 1 of a rally attempt. From here, I would like to see minimal to no distribution over the next few days and a follow through day later...
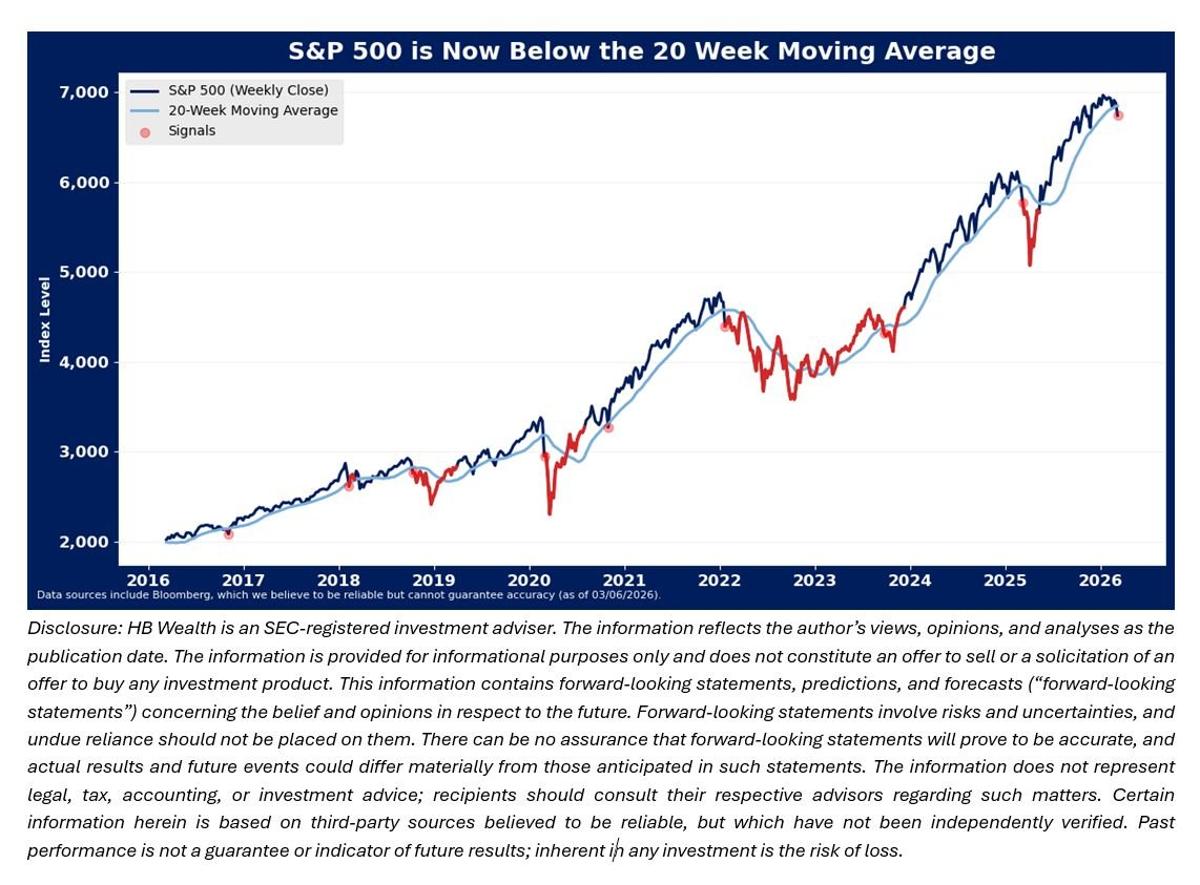
The S&P 500 has broken through key support at its 100-day and 20-week moving average for the first time in about a year, increasing the probability of a full correction in the index in coming weeks. There have been just 8...

Canadian materials $XME (so much stronger than U.S. materials, so let's stay on topic) had a 2nd "biggest bar against" last week and that to me puts extra question marks that need answers... slows me down for sure... in most...
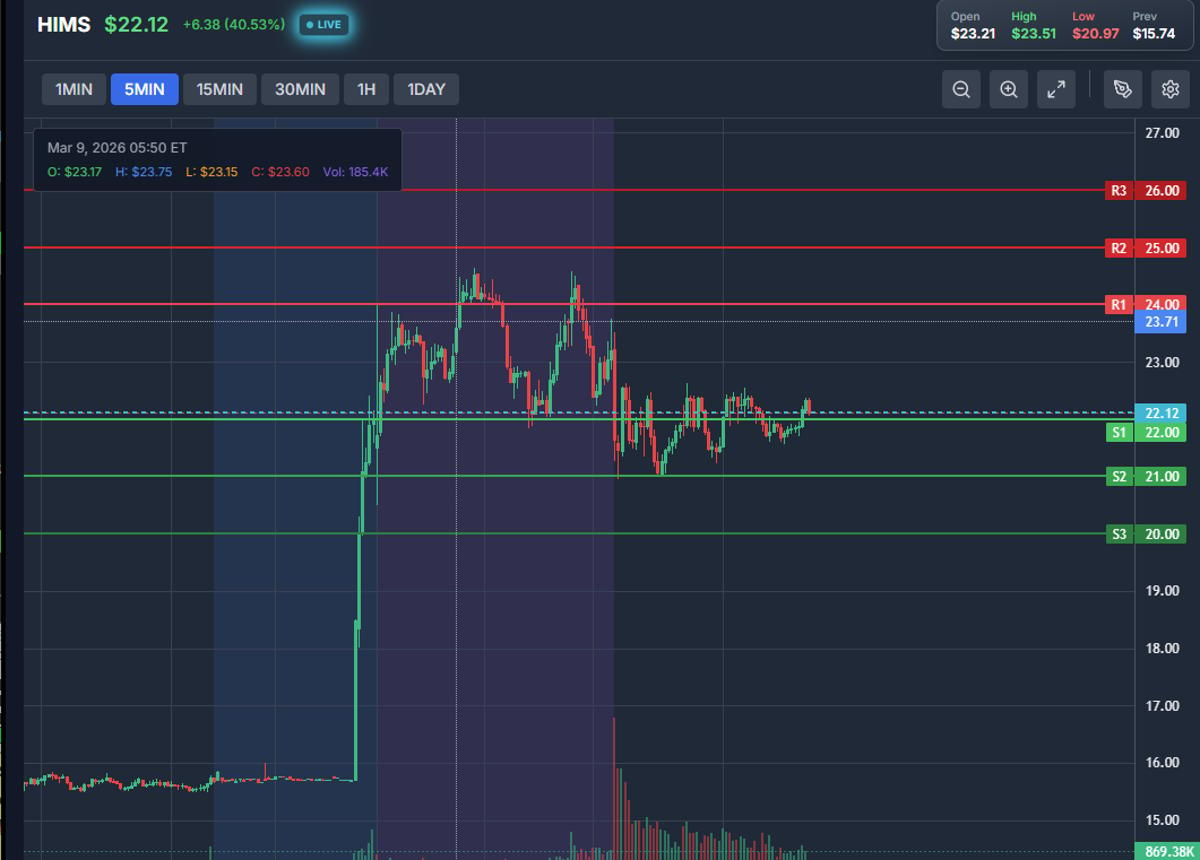
a trader asked me over the weekend about placing trades against game plan S/R levels: --one idea is long against S2 in a stock that has fresh news that isn't very negative ($HIMS #1 GP today) --another is 2nd Day Play...
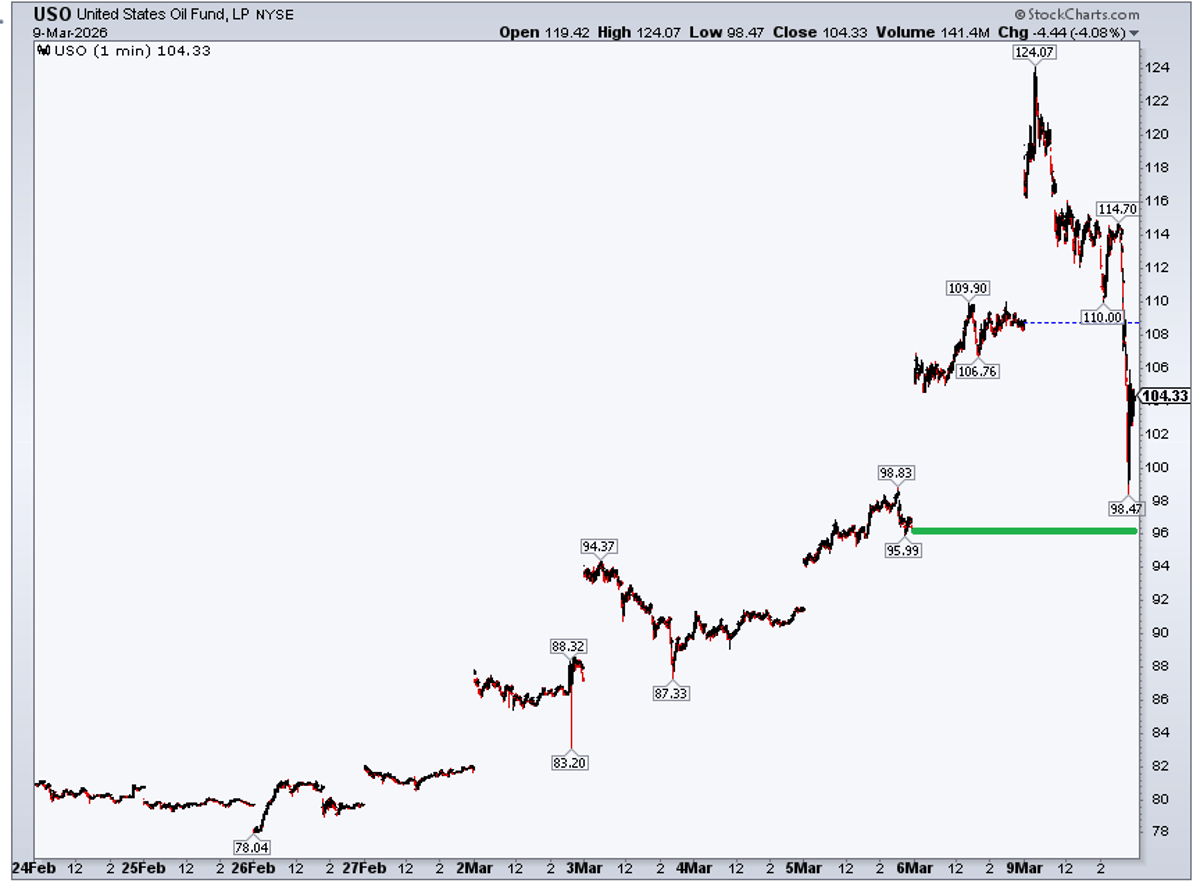
$USO.. don't count oil out yet... didn't even fill the gap.. could be a bullish sign...+6% from the day's low @stockcharts More from me: https://t.co/AEHbNDK3Qe https://t.co/329u34lpLv

Struggling to find any "edge" in the chop aside from just finding quick reversion momentum at extremes Hard to find many HTF hold opportunities lately across the board with most everything going sideways

ICYMI: Weekly S&P500 ChartStorm blog post https://t.co/R1NJQM4nyj Thanks + follow reco to chart sources @MarketCharts @topdowncharts @StockCharts @MikeZaccardi @zerohedge @dailychartbook @Bluekurtic @BoringBiz_

South Korea ripped off the 50-day. 11:20am sweeper bought 149K of the 3/27 150C. Feels like the same trader who nailed the short last Monday. Reminds me of the old $DIA sweeper from back in the day. If you know, you know. $EWY https://t.co/35pRSiDF13
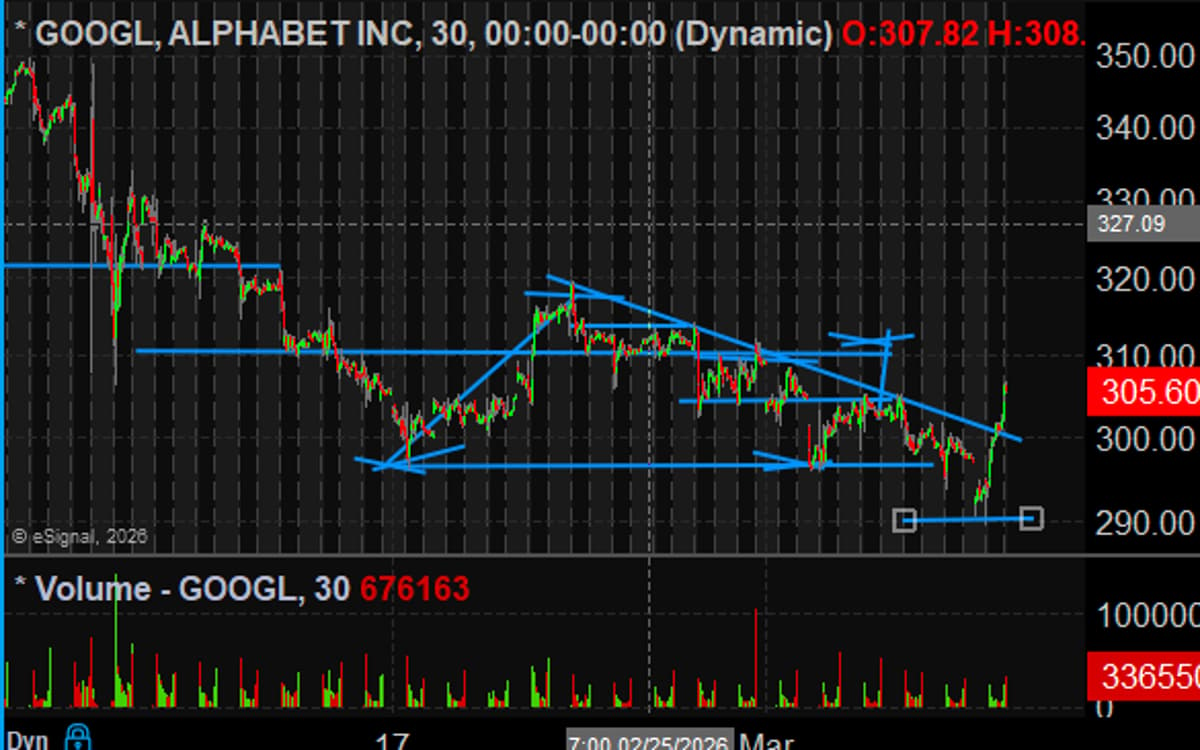
nice bounce in $GOOGL closes above the 30min downtrend. need ot see a couple of closes above 305 to believe the short term low is in... https://t.co/zbD0srOwCf
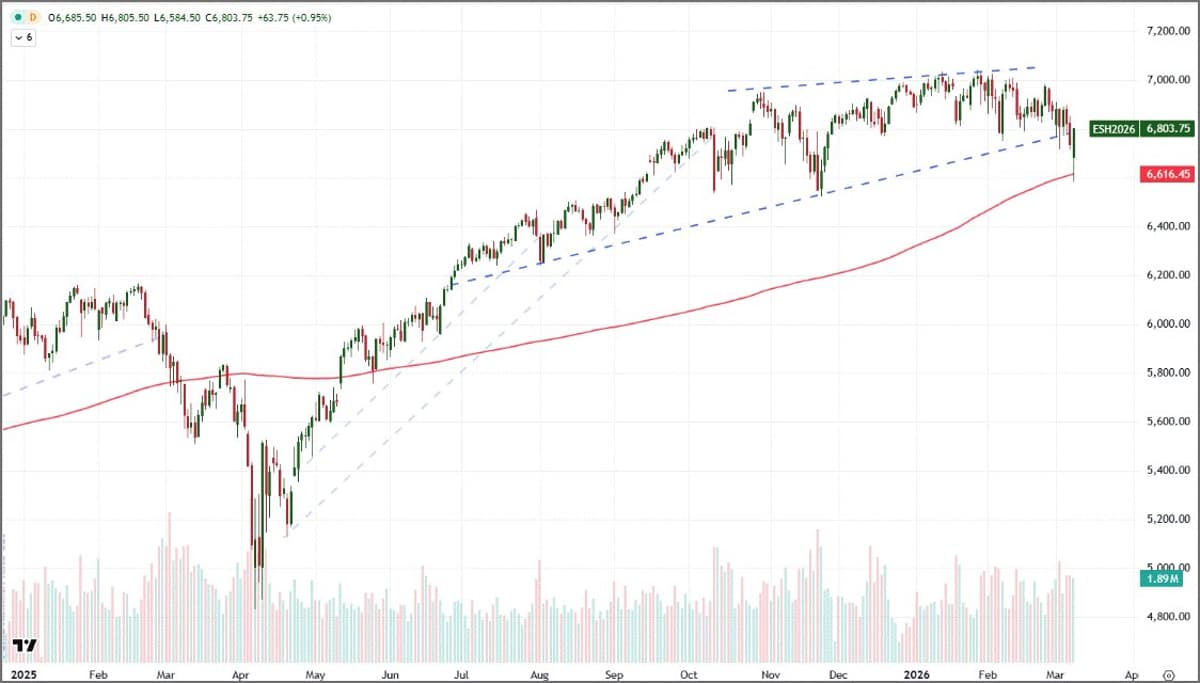
Perhaps President Trump's negotiation backstop is the 200-day SMA on the $SPX just like the rest of us... https://t.co/Jw1ZvsM3pP
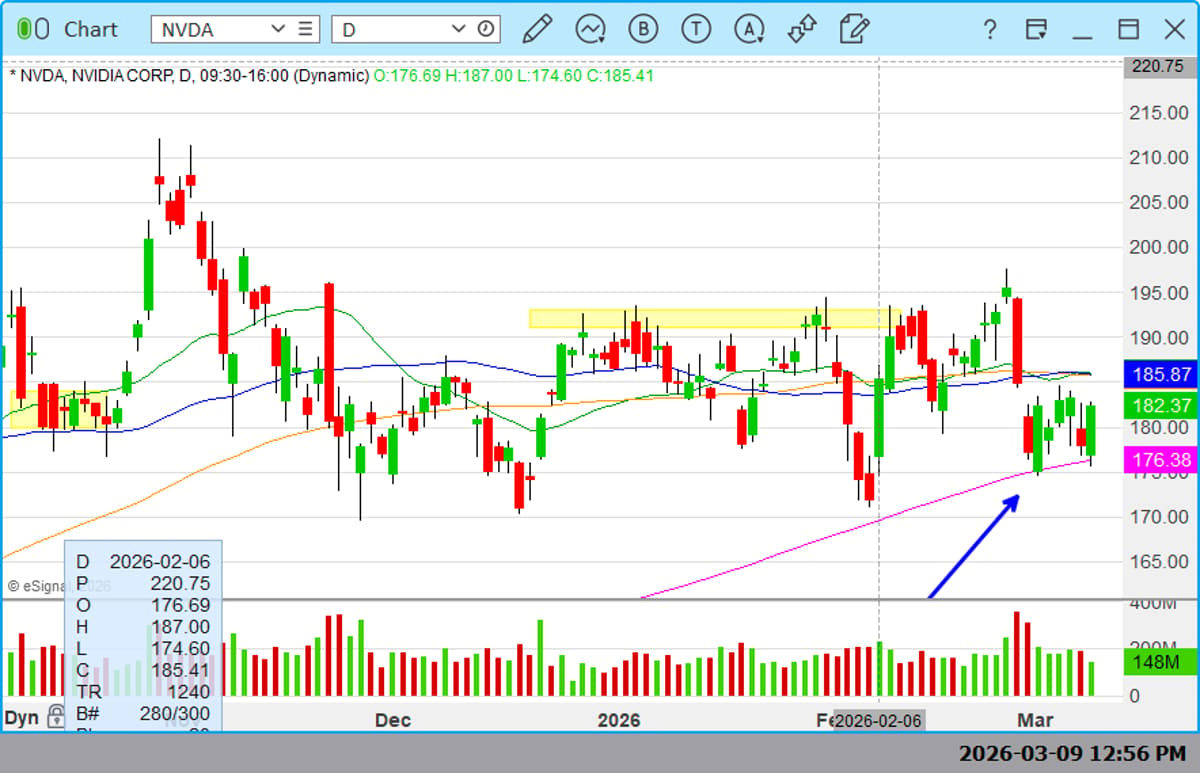
$NVDA 200sma again coming in clutch and a solid spot as a tell going forward https://t.co/GkapjyrNKa

Seems sort of fitting that the market would have a major upside reversal on March 9th.

Oil turned red, and stock indexes turned green. Looks like an oil blow off top and a stock index washout low in the futures market overnight.
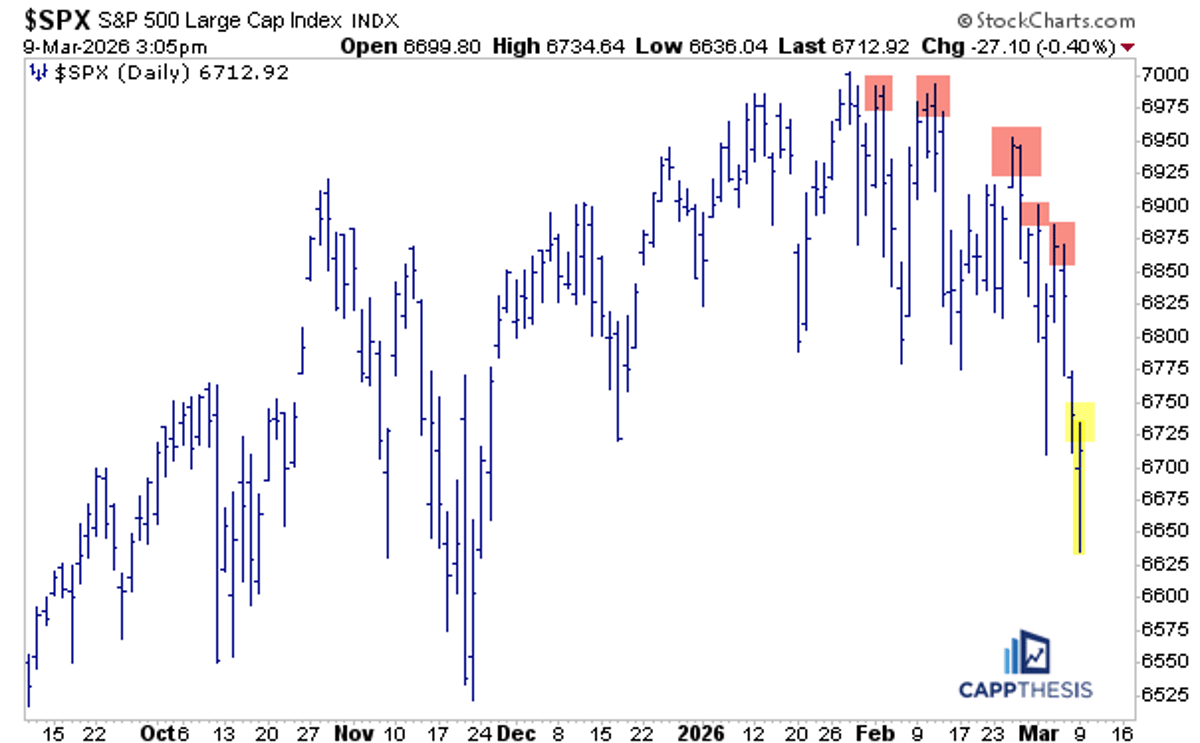
$SPX Monster reversal. ✅ 👉But it means nothing until the series of lower highs is broken. https://t.co/S175U5VDpk
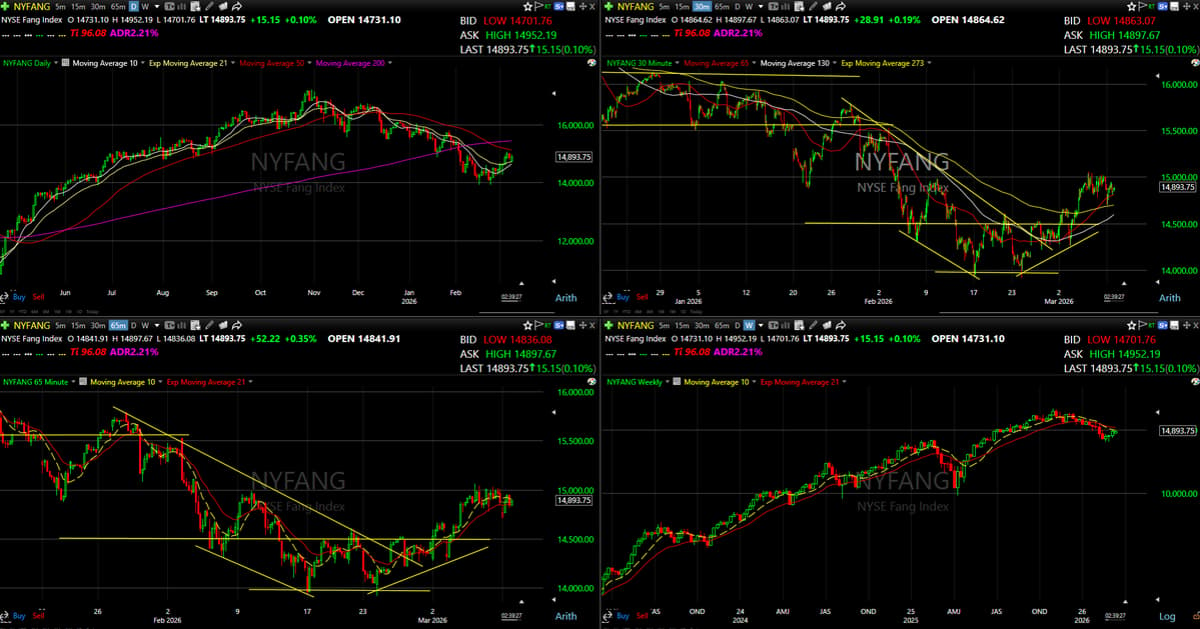
$NYFANG was the first mega-cap index to crack; it peaked back in November. But it's also the first to bounce, leading since late February, while the others haven't. https://t.co/im29c9GnlA
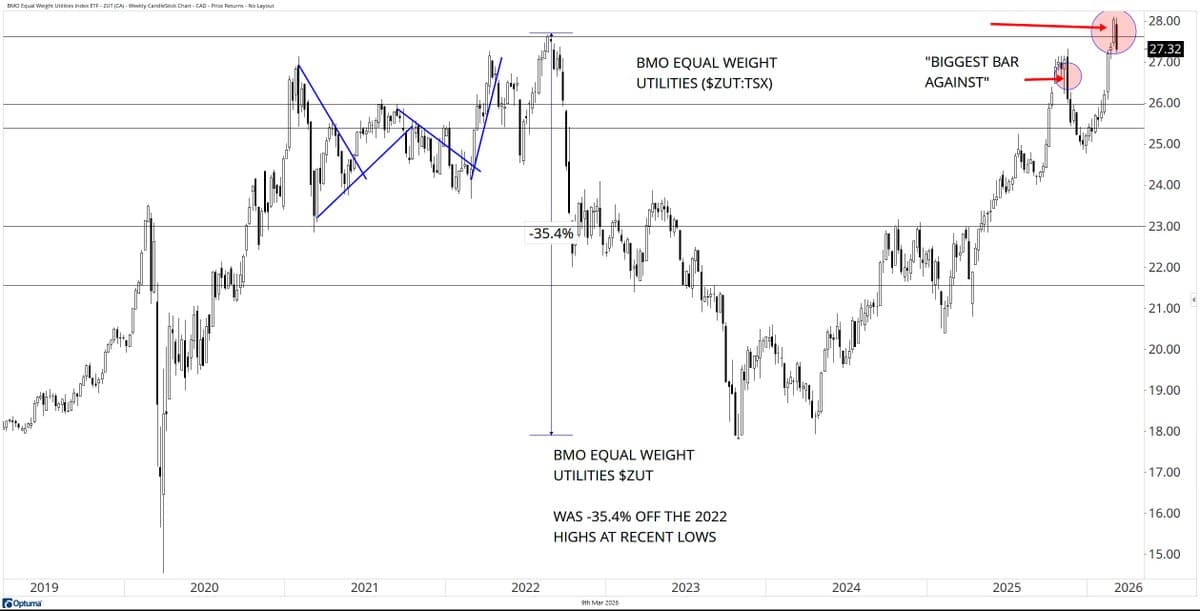
Canadian utilities $ZUT reversaed last week after making marginal new highs and finally exceeding the '22 highs... if see more struggles here, we don't get to be surprised... https://t.co/YczSyoxJZe

emerging markets $EEM - that's a 3-bar bearish reversal as i see it... going to need to see how this area settles... https://t.co/JEg00hA5vt

A rung of the swing trade on $CRM sold for a bit over $15 a share profit. I still own plenty of shares with variety of stops to make coin.
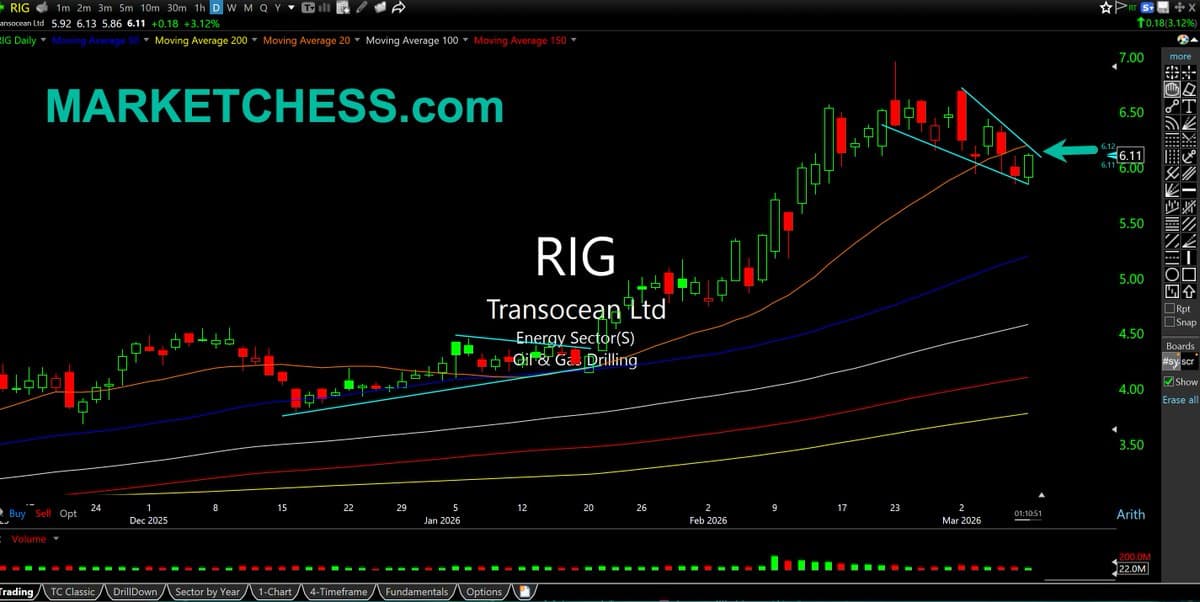
$RIG Daily. Nice-looking, orderly pullback for Transocean. Oil services play has ~ 17% of float held short, meaning it's a short squeeze play. Long idea into strength https://t.co/f3SgpDySND
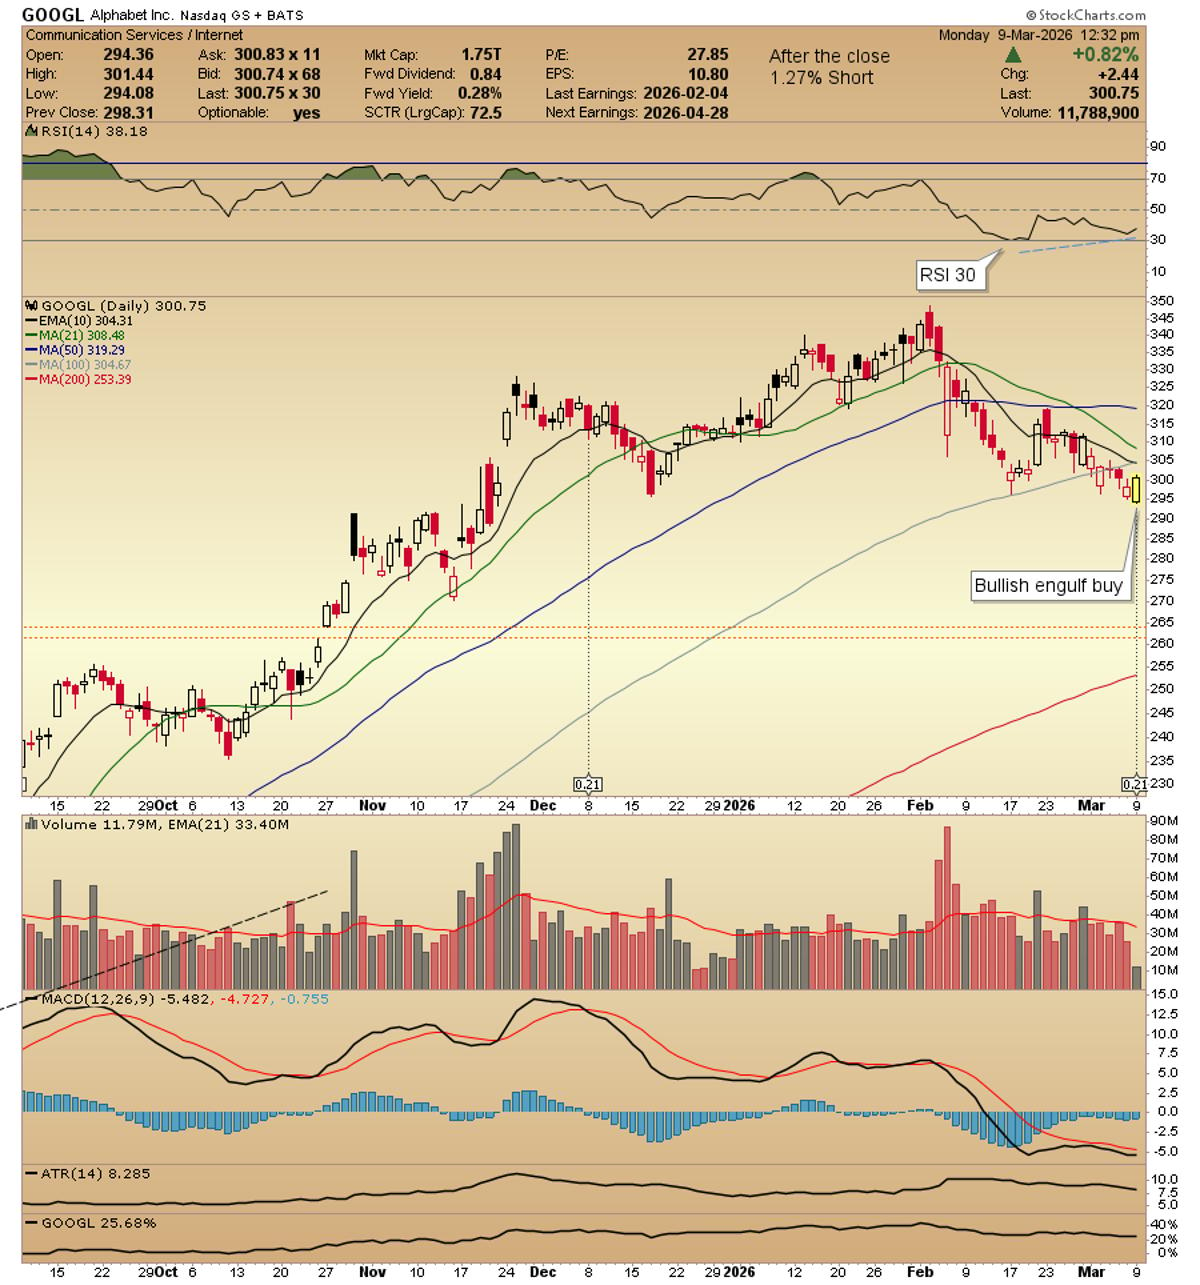
$GOOGL bullish engulfing today. Not confirmed and will like it better if tomorrow's stick confirms. A move over 304-305 next on my radar. https://t.co/9dd61slCPY
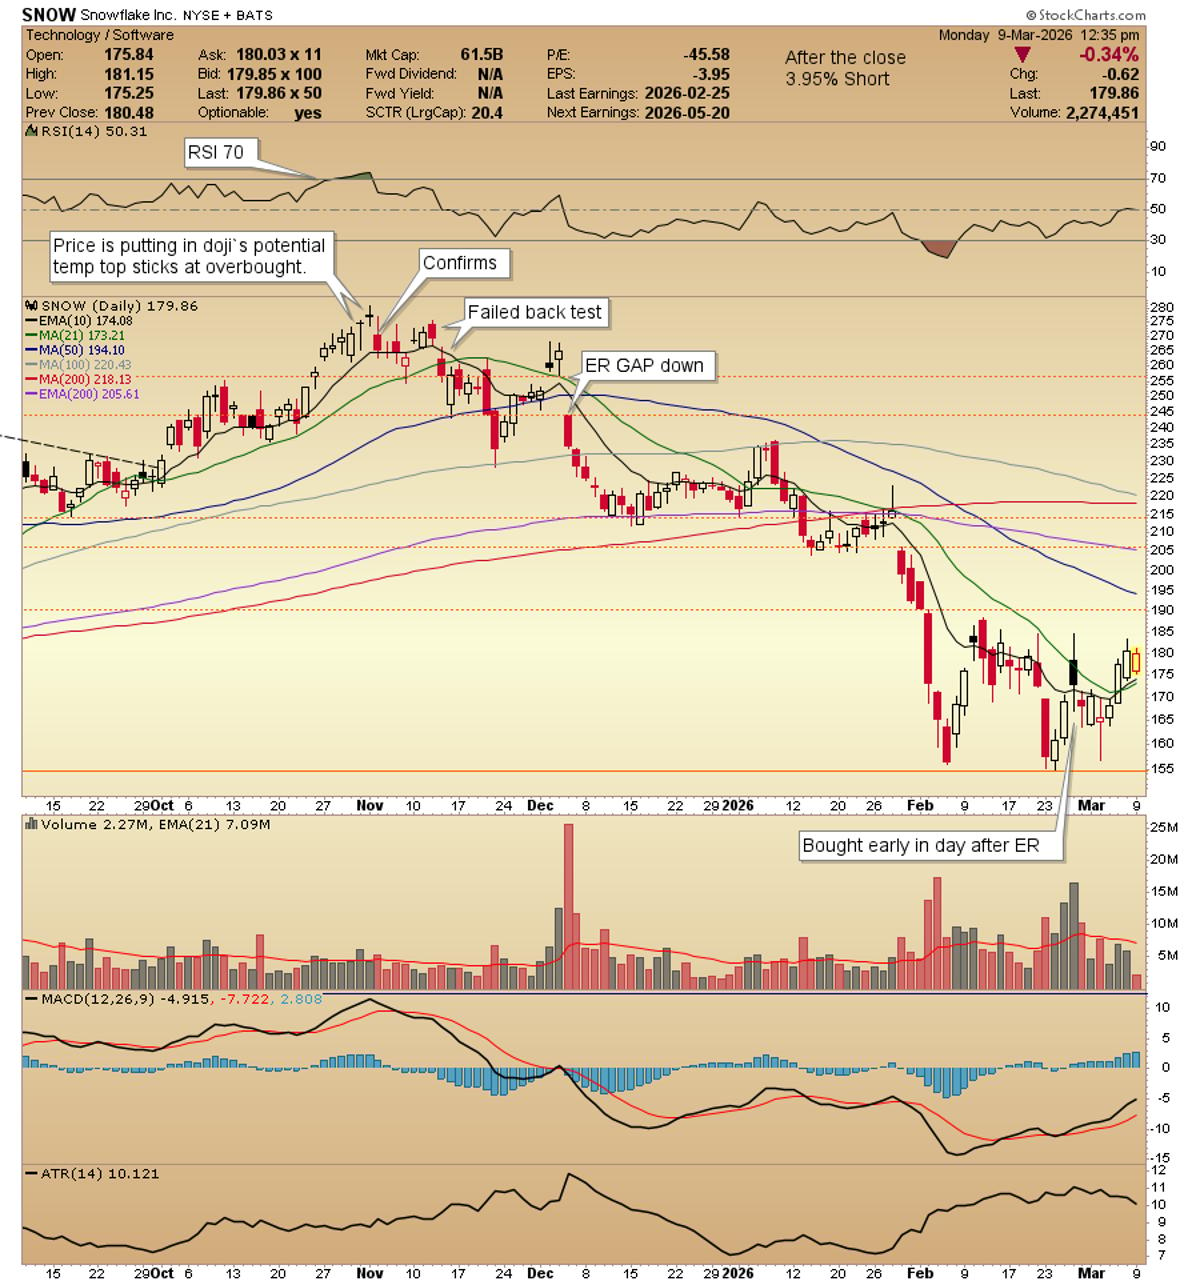
$SNOW what I see in the chart. A move over 185 then 188ish and the small gap overhead. Been a choppy trade for me. I am green on it after going red for a few days. https://t.co/fflE1UPhg6

The bullish divergence on $BTC vs. Gold remains to be active. This means that we're likely going to see a strong move in the coming period. Bitcoin > Gold. https://t.co/bcm6OJnBdr