Know What's Happening in Stock Trading
Know What's Happening in Stock Trading

Moving Average Crossover Strategy Shows 6.9% Annual Return in Backtest
The moving average crossover approach generates mechanical buy or sell signals when a fast and a slow average intersect. Common pairings include 9/21 EMA for short‑term trades, 20/50 SMA for swing trades, and the classic 50/200 SMA Golden Cross for long‑term trends. Backtests of the Golden Cross from 1960 to present delivered a 6.9% annual return.

GitLab (GTLB) heads into its quarterly earnings call at 4:05 pm, with an implied 15% price move priced in by the market. The stock has tumbled 50% since the end of October and now trades at roughly three times forward revenue, reflecting several sell‑side downgrades tied to concerns over Claude AI competition. Despite low guidance, software peers have demonstrated positive price reactions to mixed results, and the market typically rewards revenue beats of 2‑4%.

Always make a call out or chart you see on X your own. Use your own style, time frame and rules. This might mean the buy is at higher levels like my $SOFI. My rules, my trade...
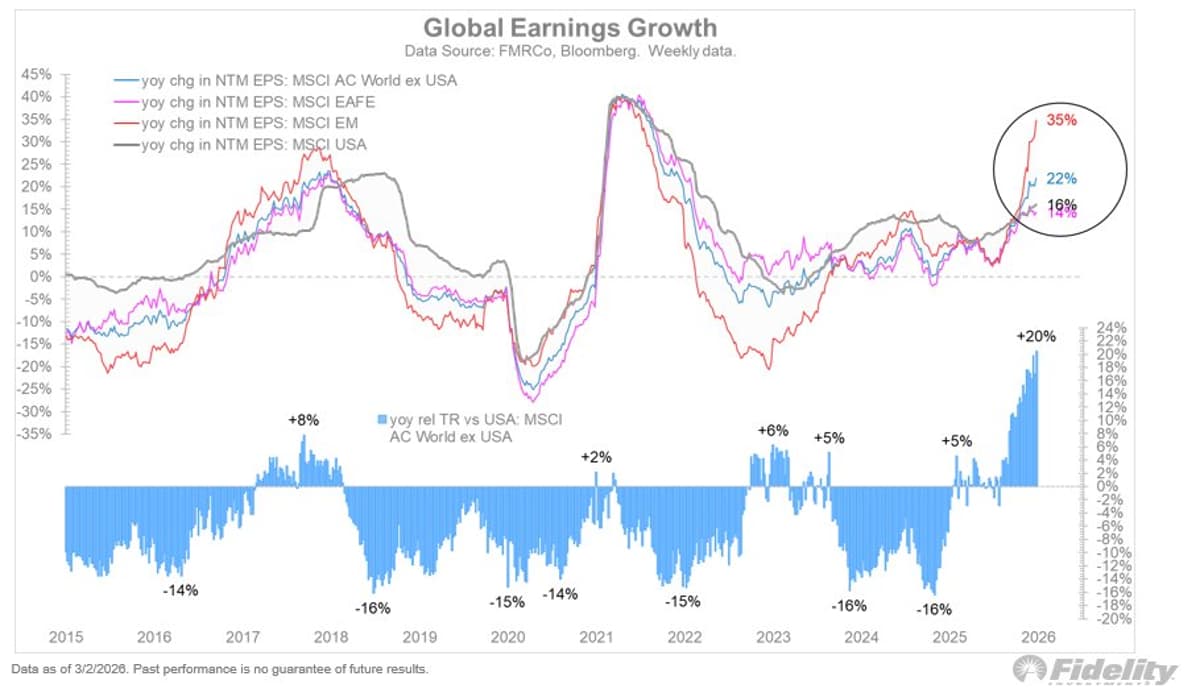
Global markets are at or near all-time highs, supported by strong earnings growth around the world. The rest of the world is outperforming the US on a combination of better earnings growth, competitive payout ratios, and lower valuations. As such,...

The $SPX is still below the gamma flip. That keeps us in negative gamma, meaning volatility can expand, and rallies can fade fast.

Good recovery in Gift Nifty 24145 to 24400+ 250 point up from day low. #usiran #GIFTNIFTY
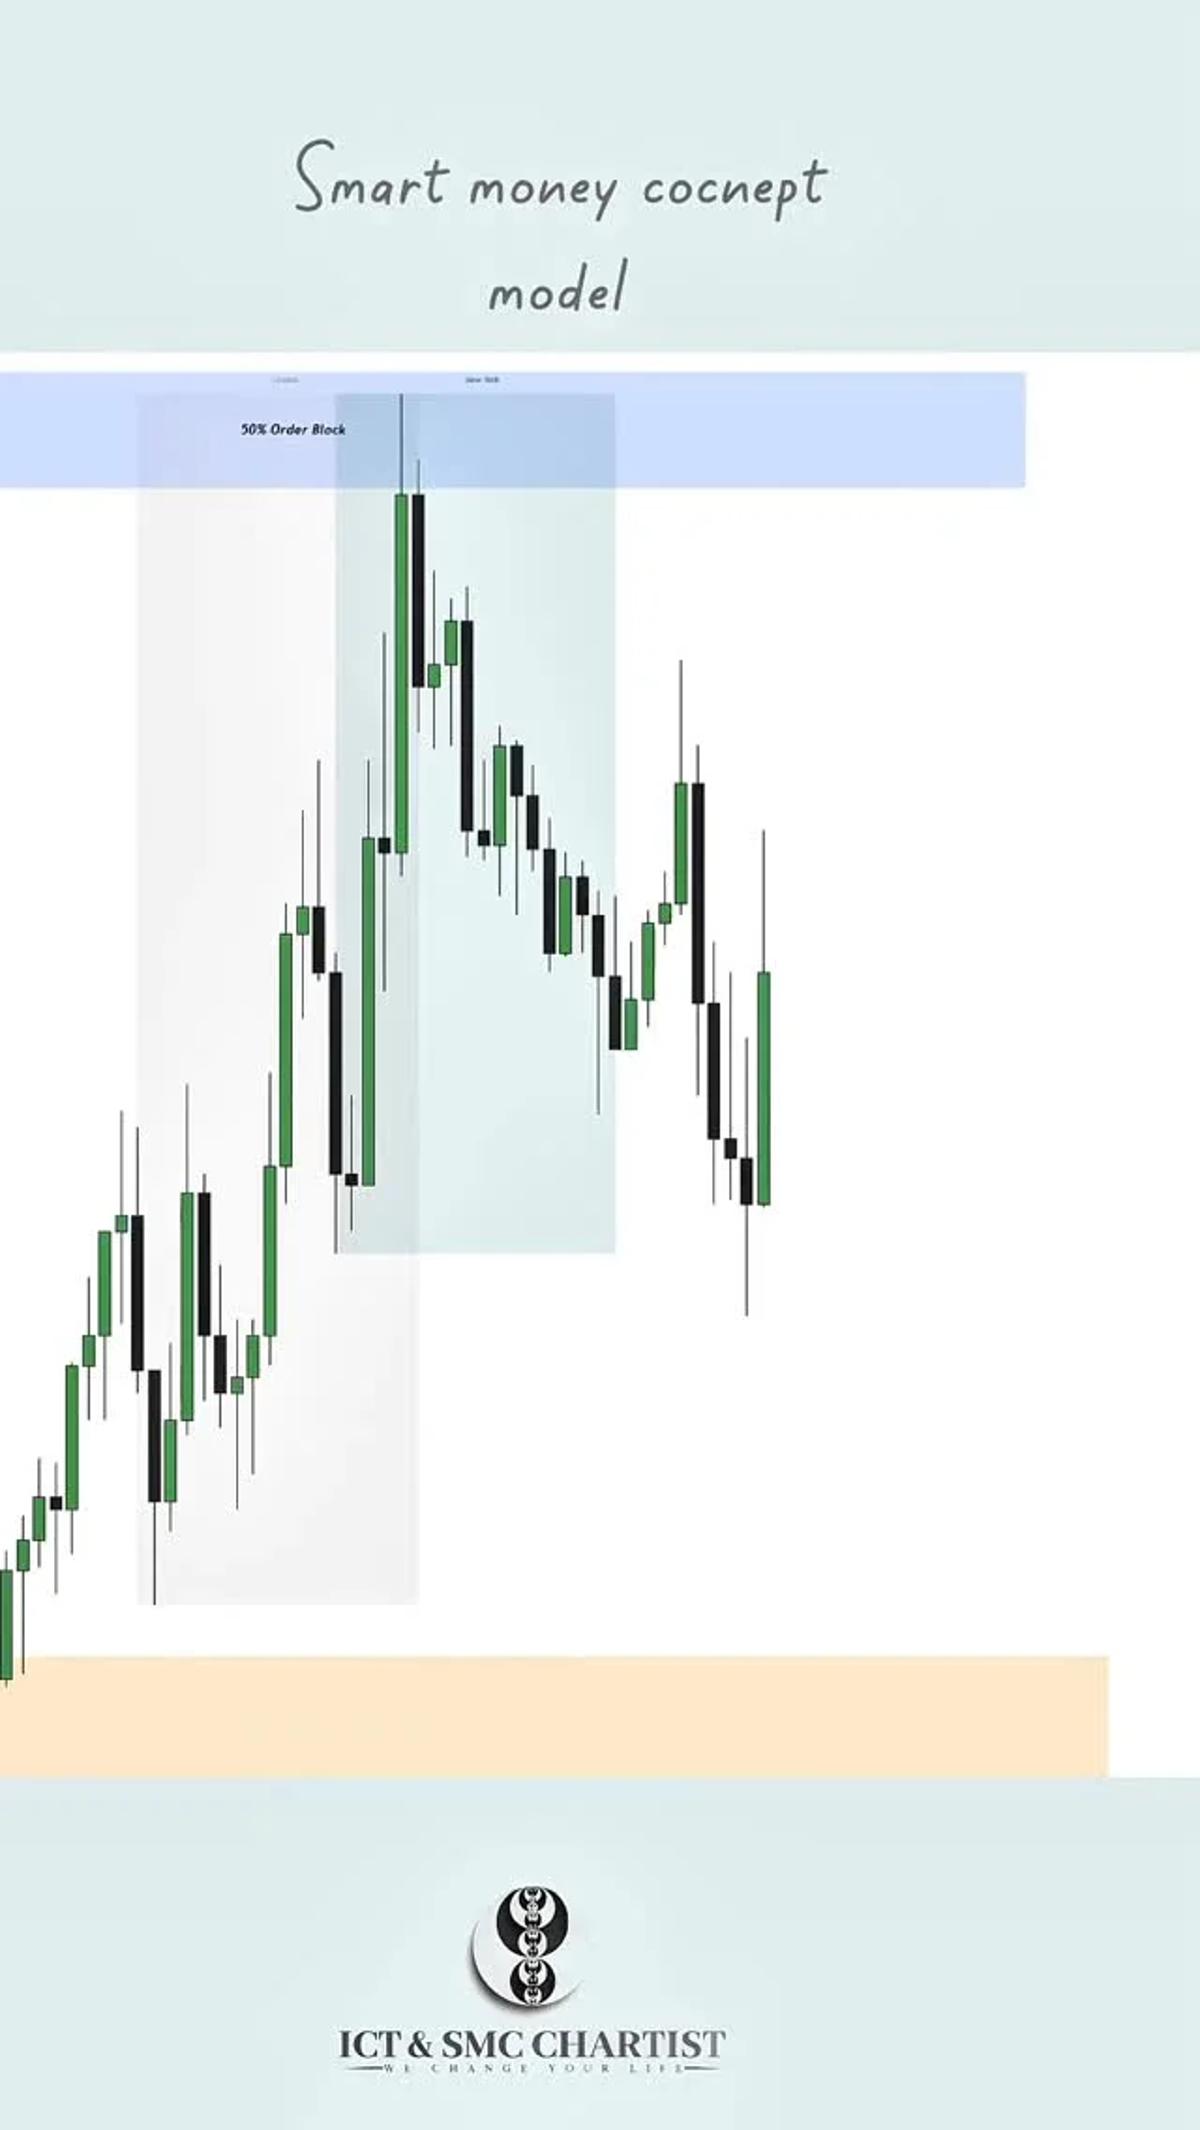
Smart Money Concept isn’t about guessing — it’s about understanding liquidity, structure, and institutional intent. Order Blocks. Break of Structure. Session timing. When you learn to read what smart money leaves behind, the chart stops being random. It becomes a map. Trade with logic. Execute...
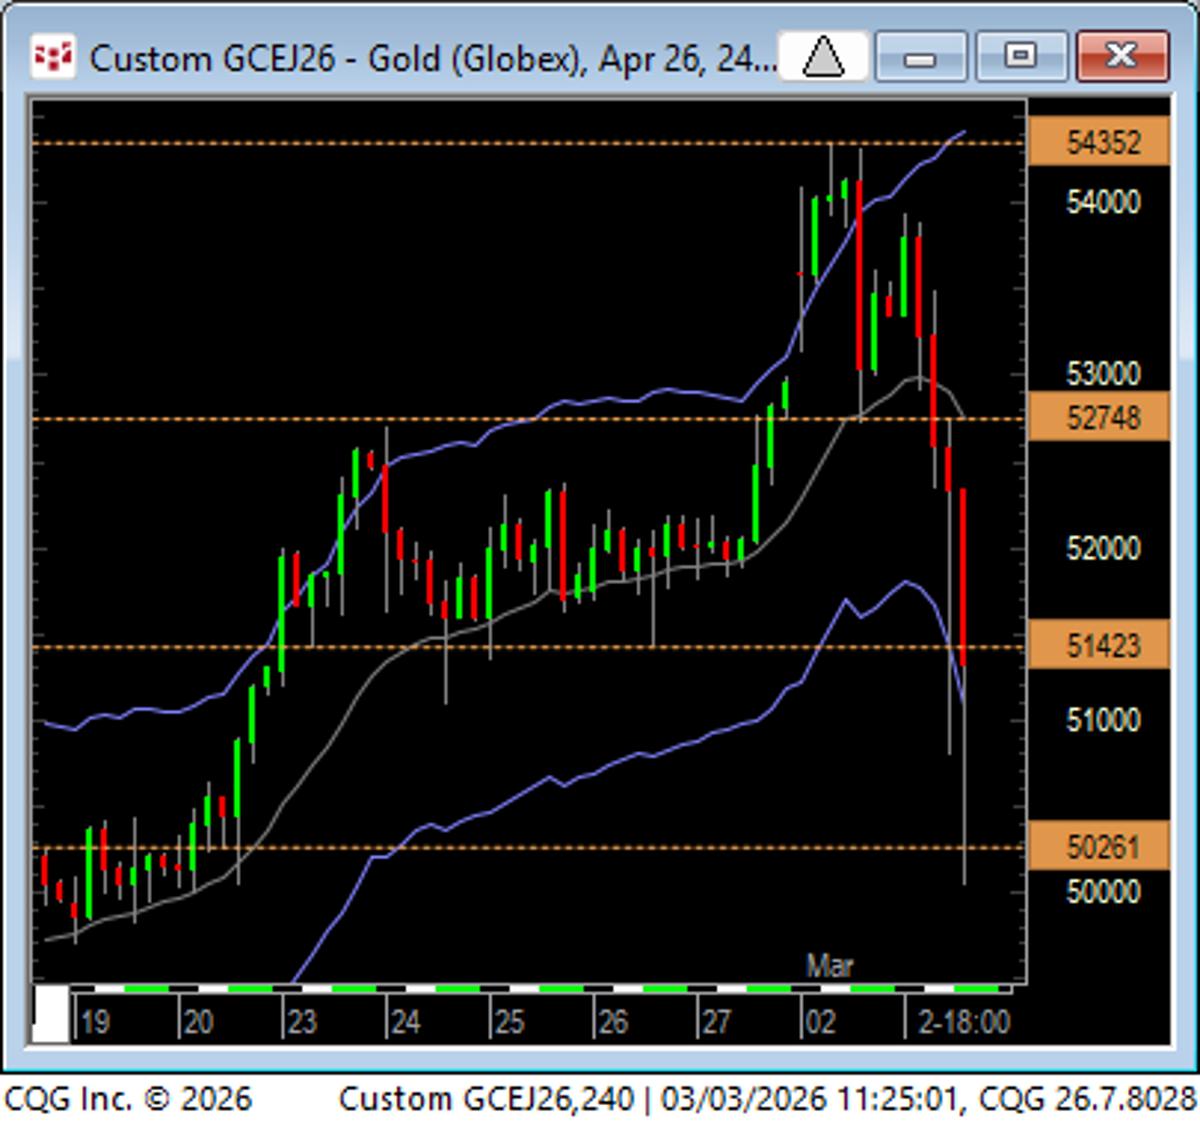
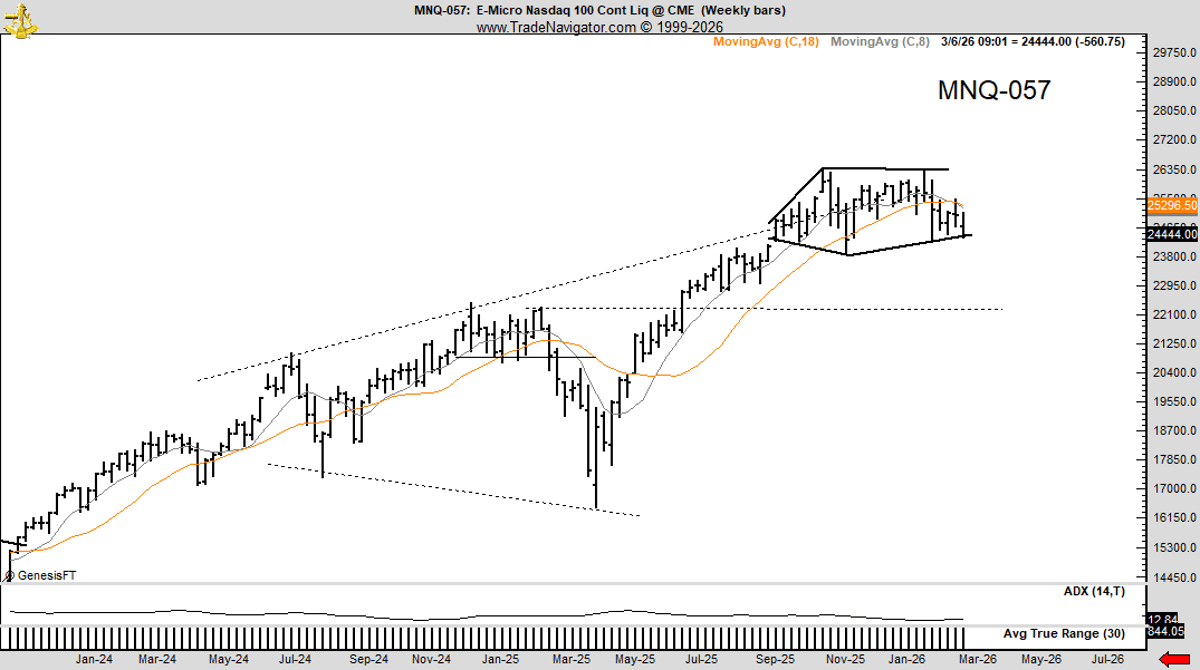
Technical analysis isn't meant to be a prediction tool, but better used to show levels and momentum. Then it is up to Mr. Market to see how it trades. GC met the projected downside, but it did not have...
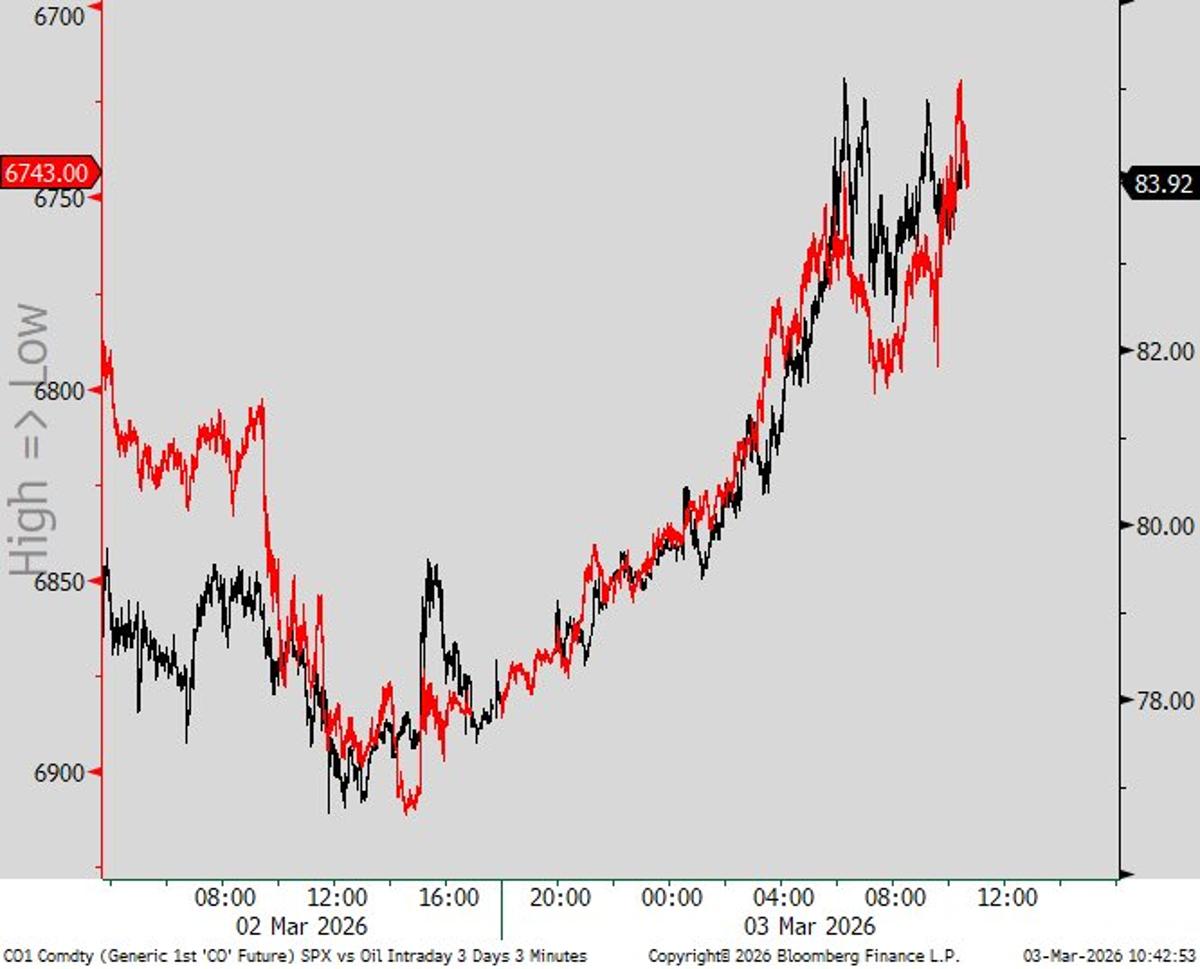
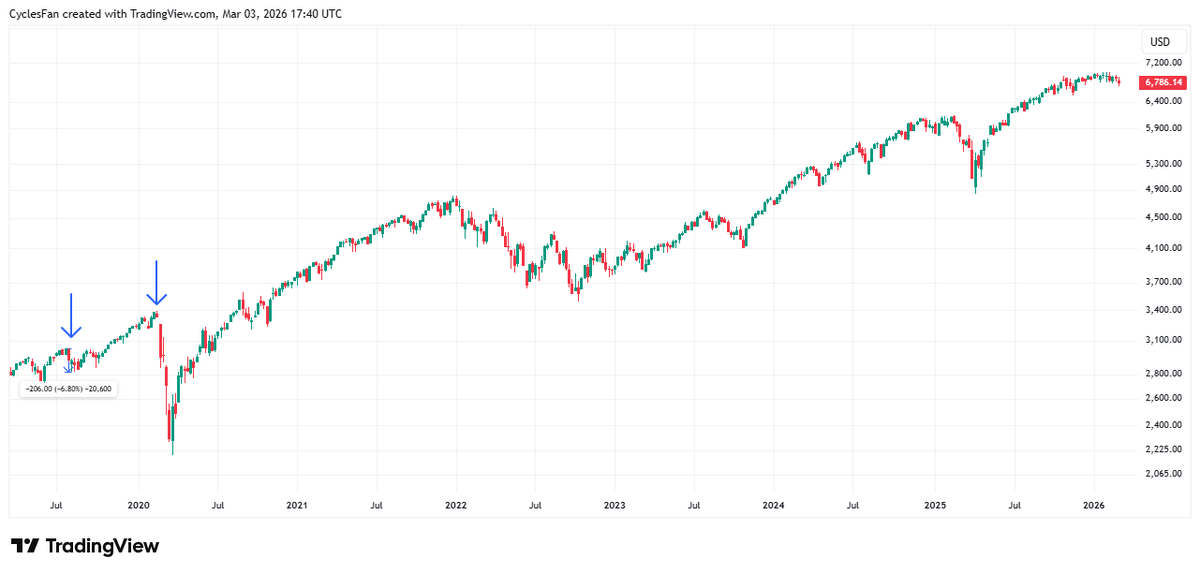
Updated chart of our 1-variable stock market. This is how markets behave during exogenous shocks - stocks need oil to peak. Aftermath eco forecasts rarely matter. Same thing happened last year, but with trade uncertainty. Need something to the...
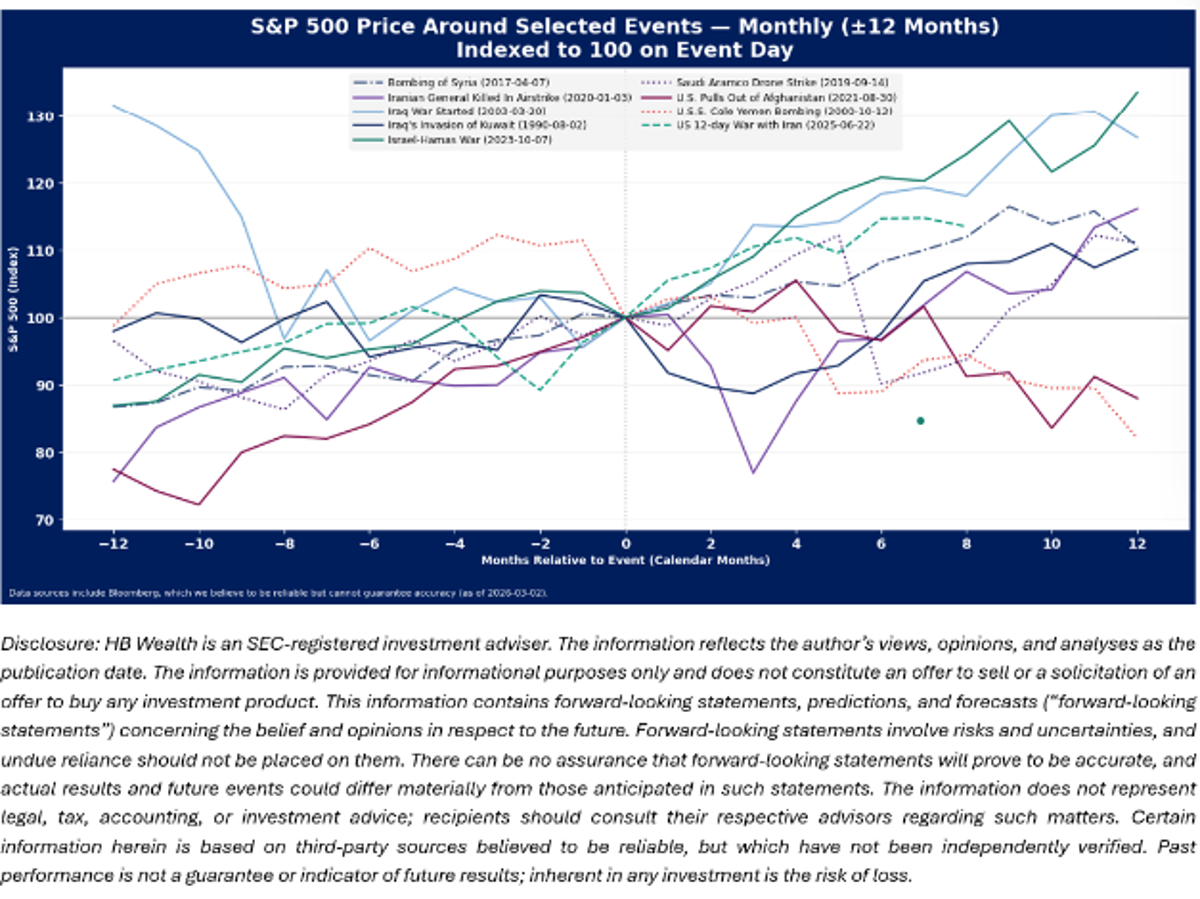
Geopolitical risks may weigh on the outlook for stocks in the short run, with the S&P 500 now below key support at its 100-day moving average. Stocks have been transitioning leadership toward commodity-sensitive sectors and value stocks so far this...

As always, risk management is paramount. In a market under distribution, tightening stops and prioritizing capital preservation isn’t just prudent — it’s essential. When the tape refuses to reward low-risk setups and breakouts fail to follow through, discipline becomes your greatest...

$SPY - Sideways price action cuts both ways... Yes - "Only XYZ % from New Highs" but also now this move puts us at new 3 month lows. People yelling stats without context are not doing analysis and analysis is the...

$V updated chart nice basing high and tight. A move over the 21ma next on my radar. https://t.co/0PKkcb17YC
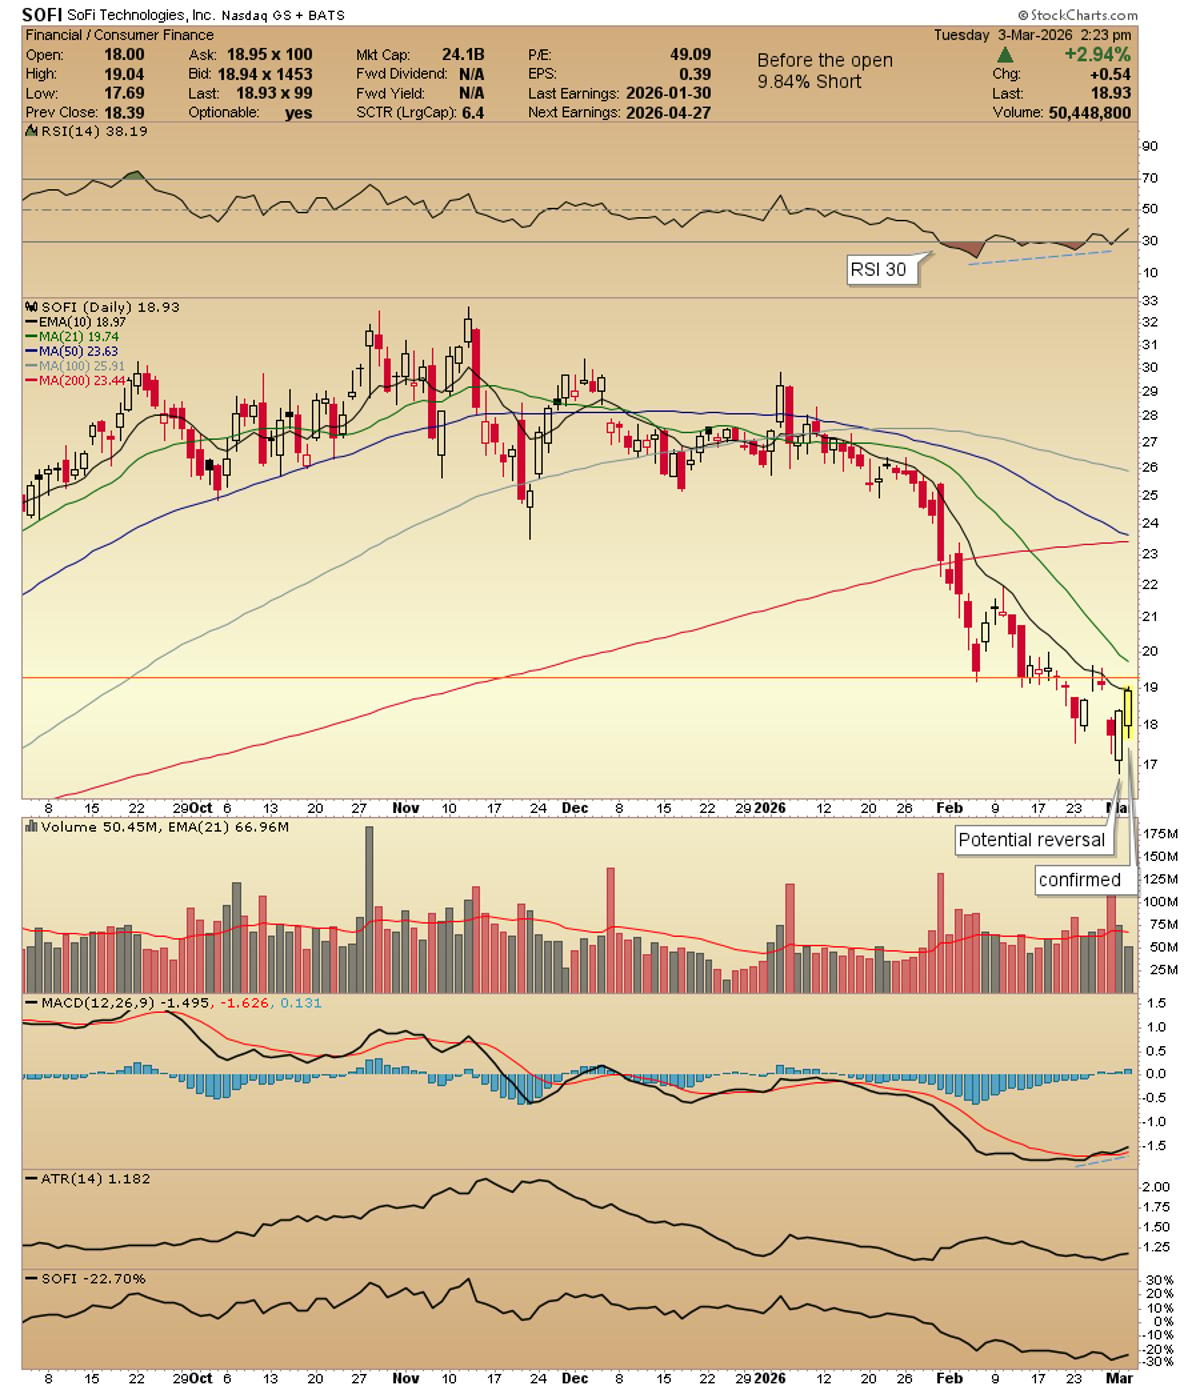
$SOFI I have a trading pal who brought this name up and bought it recently. I had to wait for the confirmation stick. A move and hold over the 10ema and the horizontal line on the chart...

$ONDS once again touched the bottom of the base, broke higher and now back in the base. Watching it close

$JPM stops are stops. Looking at the daily again and my jump back in see closer to close
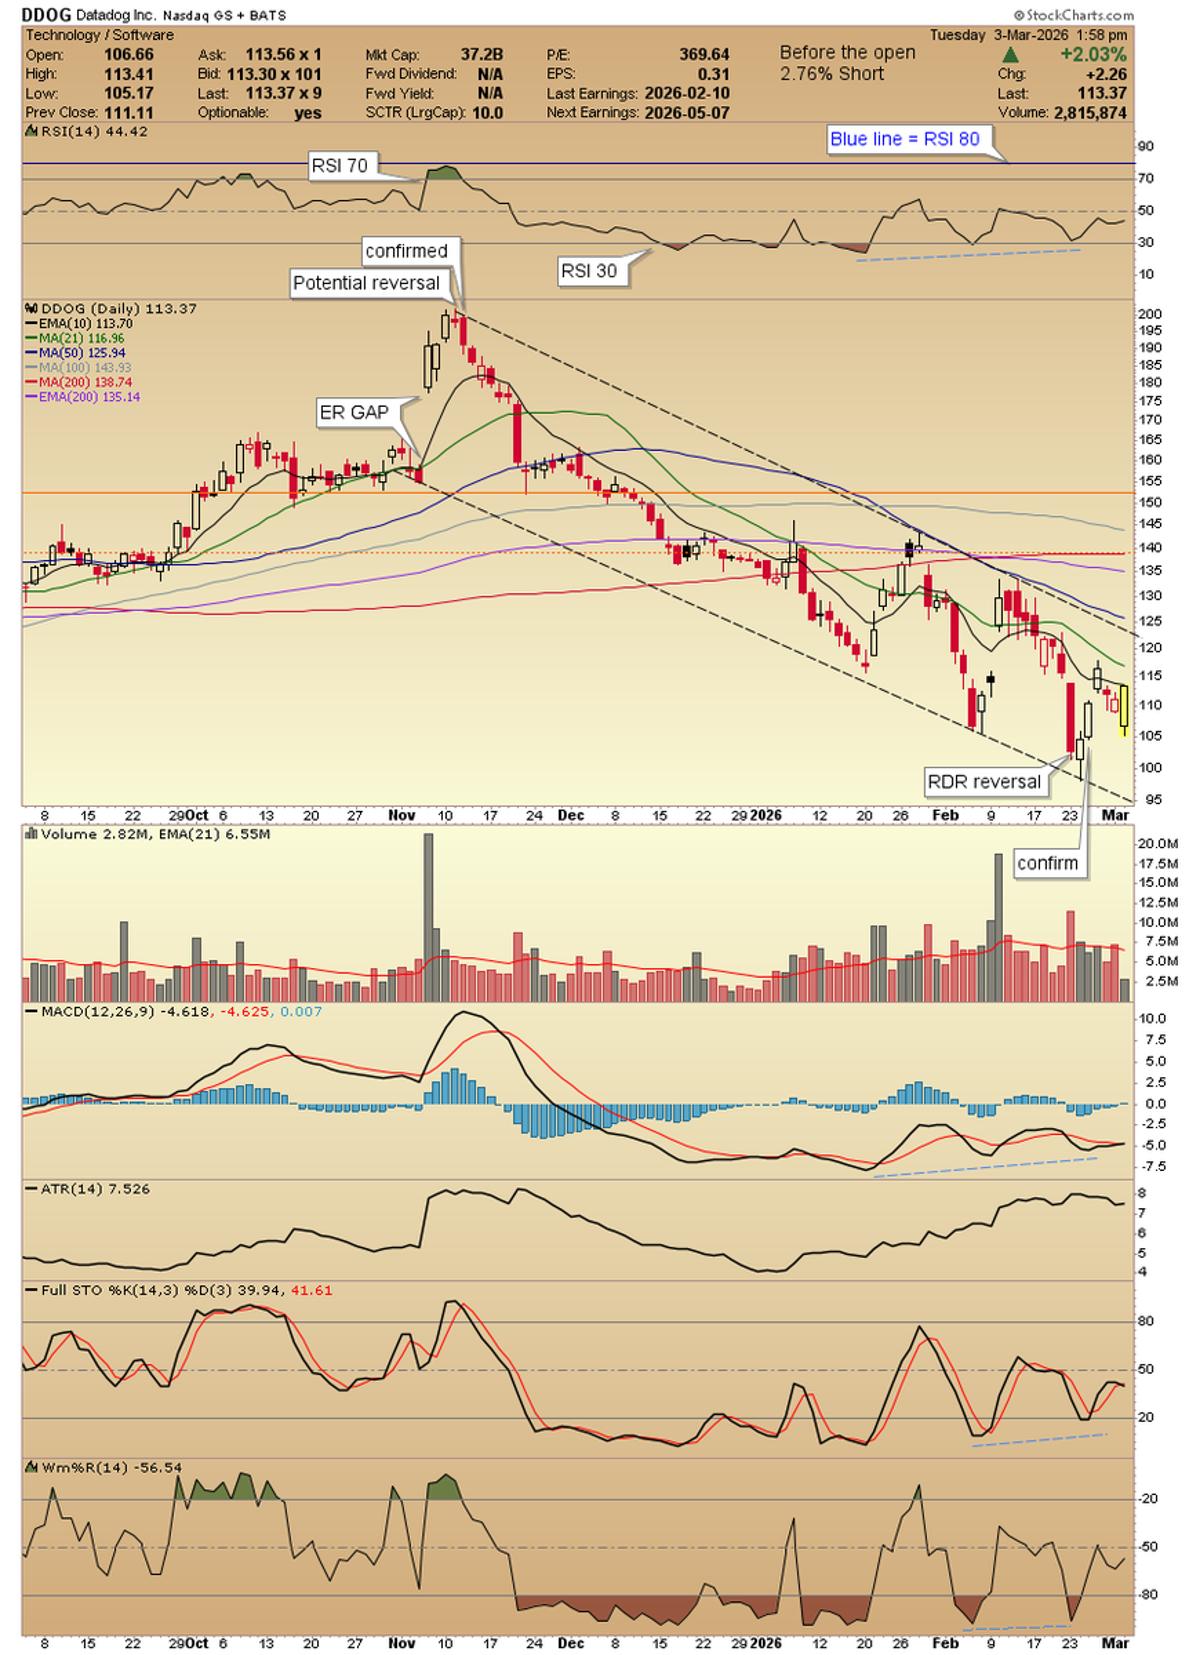
$DDOG continues to sit in the base. a move and hold over the 10/21ma's needed and then maybe the trade works. https://t.co/7vFbUIP7xA

$IWM Seven points off the lows, but still down $3 from the previous close. That is the new up. https://t.co/66p4vPZcEF
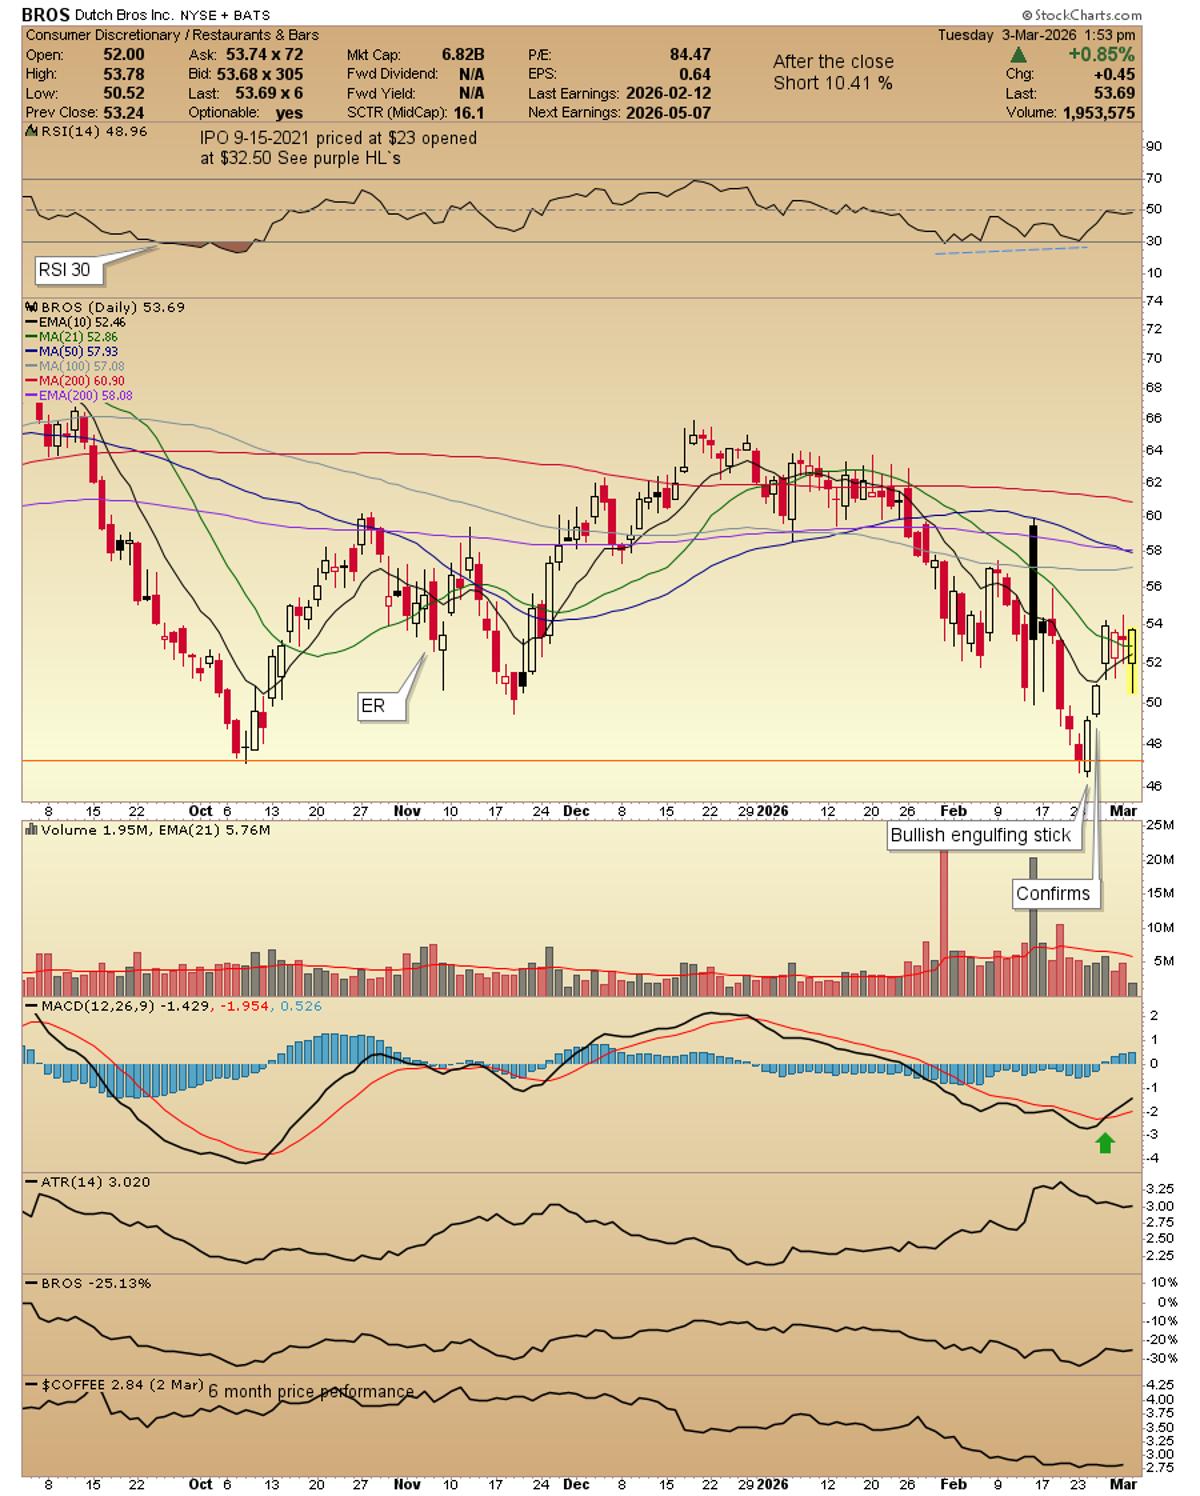
$BROS sitting in a high tight base. 2 charts one with all the indicators/ma's and one naked to zero in on the base. https://t.co/rBBh9Z9UnS
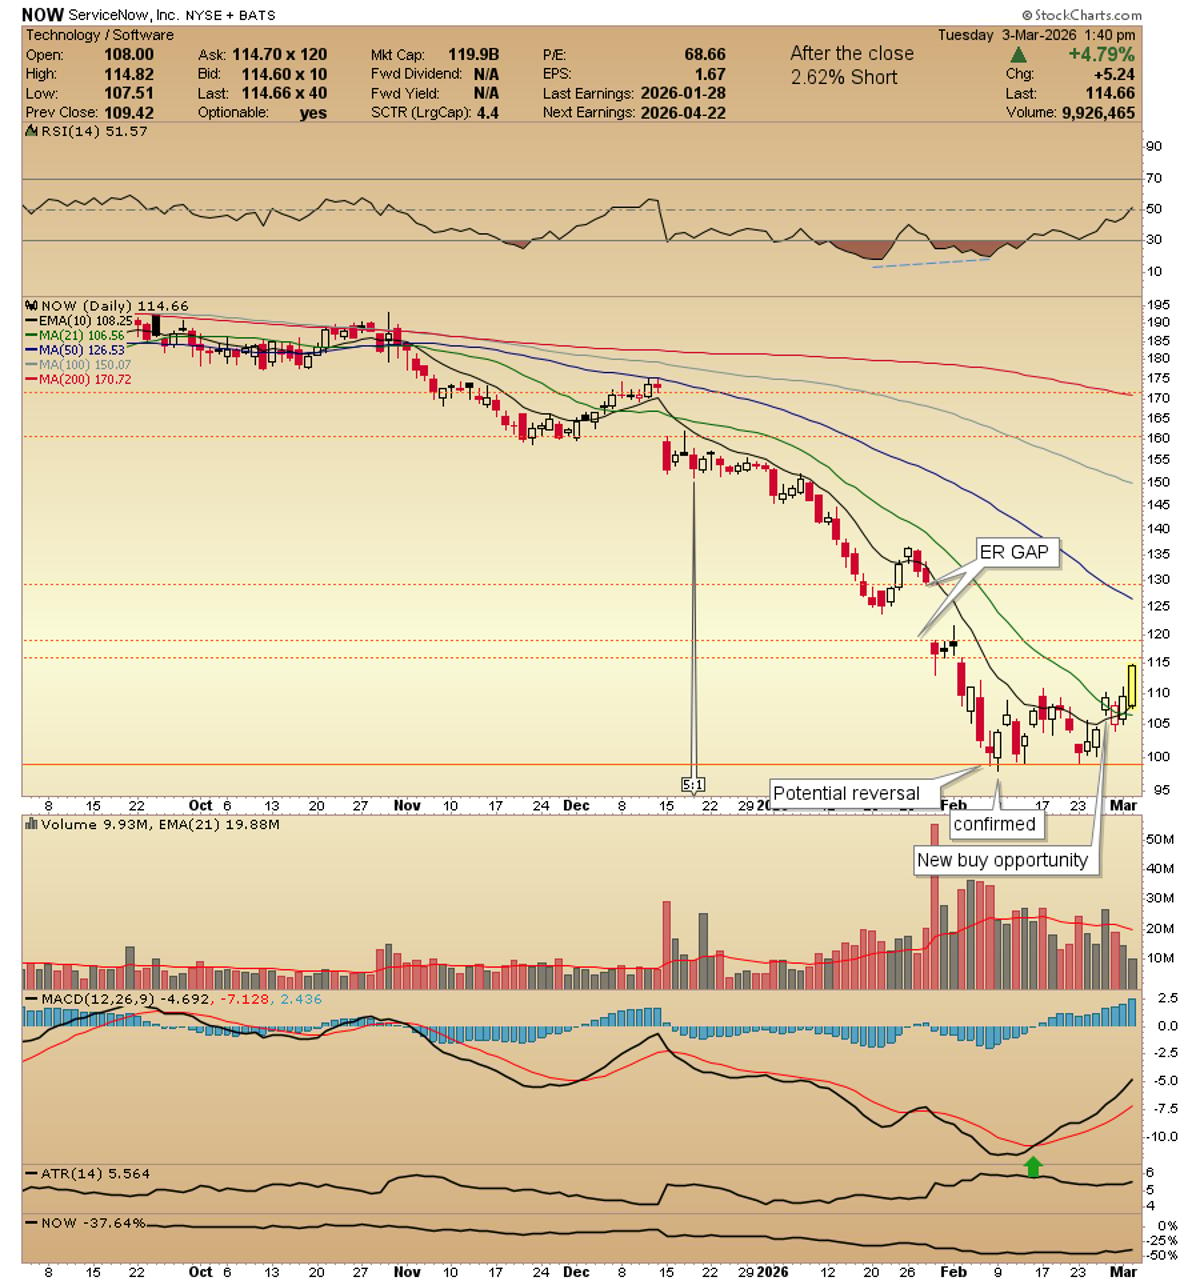
$NOW nice mover today watching the small gaps overhead and the big ER gap. What I see in the chart. https://t.co/Gola7E6MXM

$CORN Weekly. Wheat and Soybeans have been hot. But watch corn fund for long-term base bottom breakout above $18. Big-time input for broad economy https://t.co/yPBIFa6GwG
Joining @CNBCTheExchange in an hour to discuss market volatility, $SPX, and what the pullback in former leaders like $MU signals for semis #fairleadstrategies
Yesterday a 7th Omen was triggered. The last instances there was a cluster of 6 or 7 Omens were February 2020 and August 2019. Obviously this is not February 2020, but it's similar to the August 2019 downtrend in which...
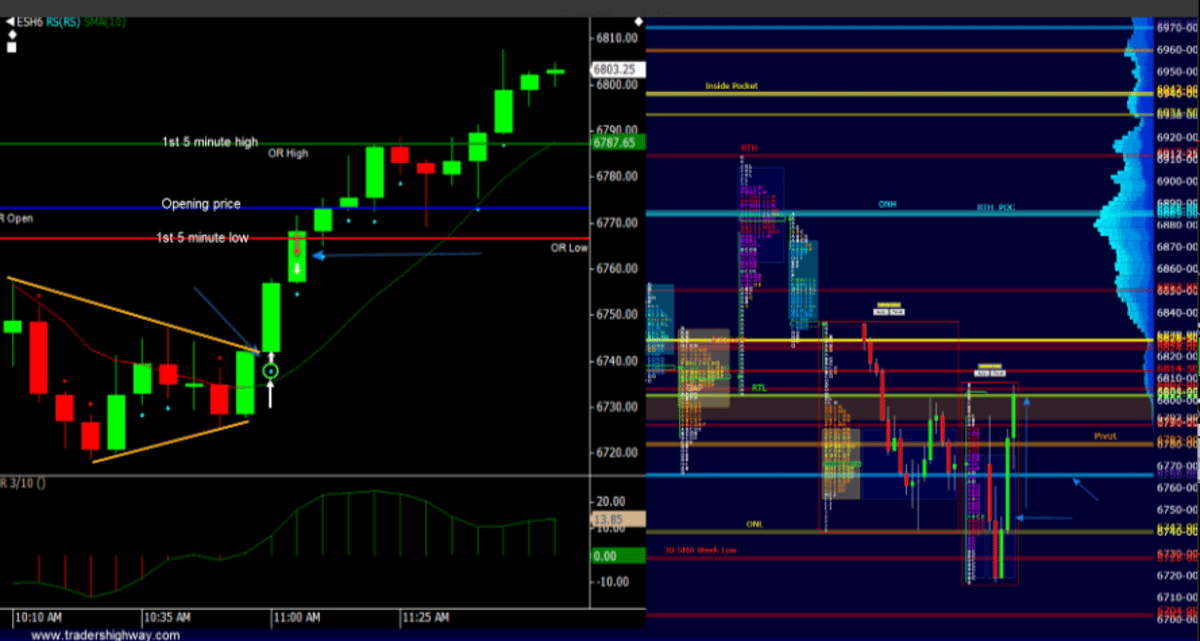
Damon's morning buy. (he shows his trades live online as well as his market profile work). #DamonPavlatos https://t.co/Hs8kF4Xy68
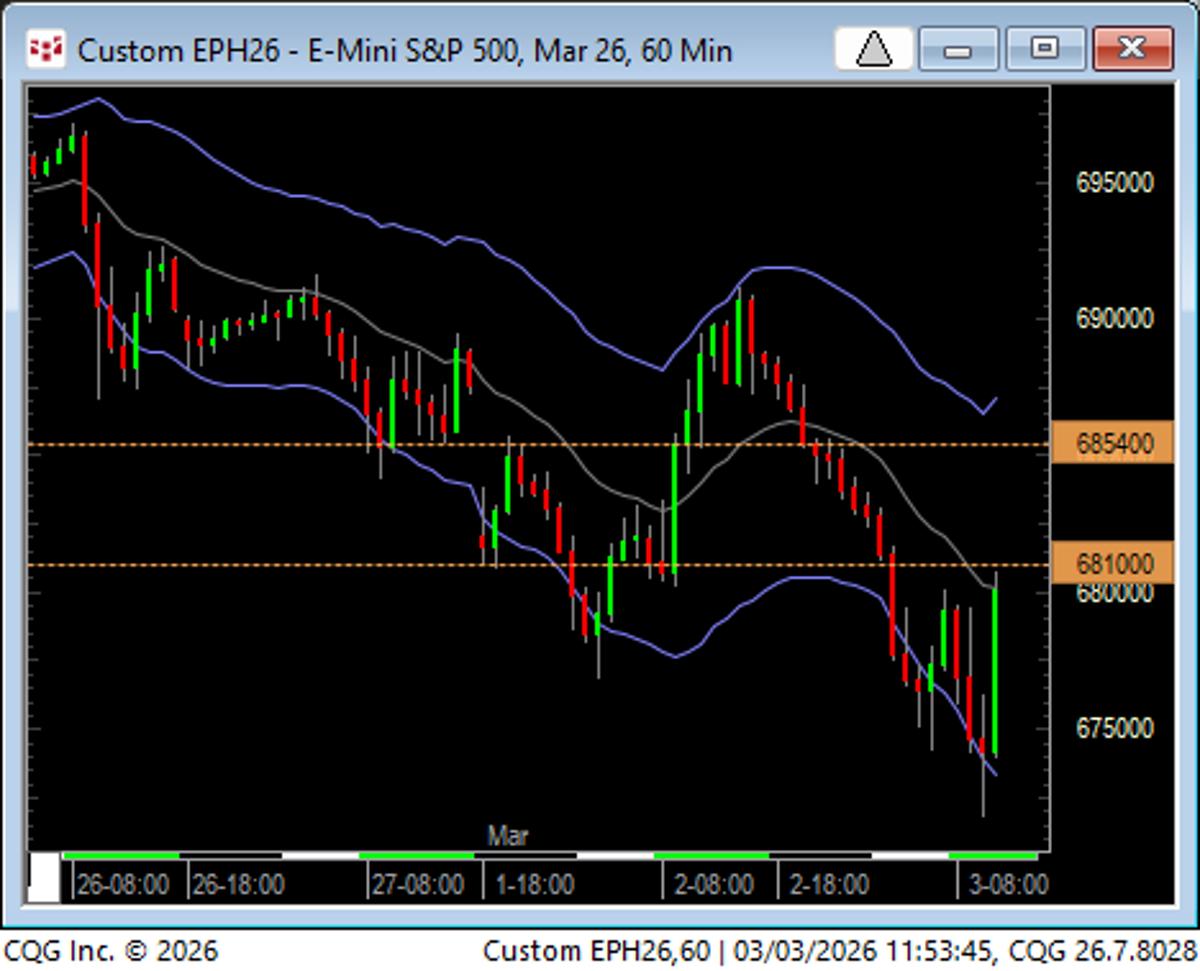
Morning reaction up was best play of the day...now what? No leadership shares making new highs on the day (T and VZ do not count.) Close under or over 6800? Market rarely pulls same move two days in...
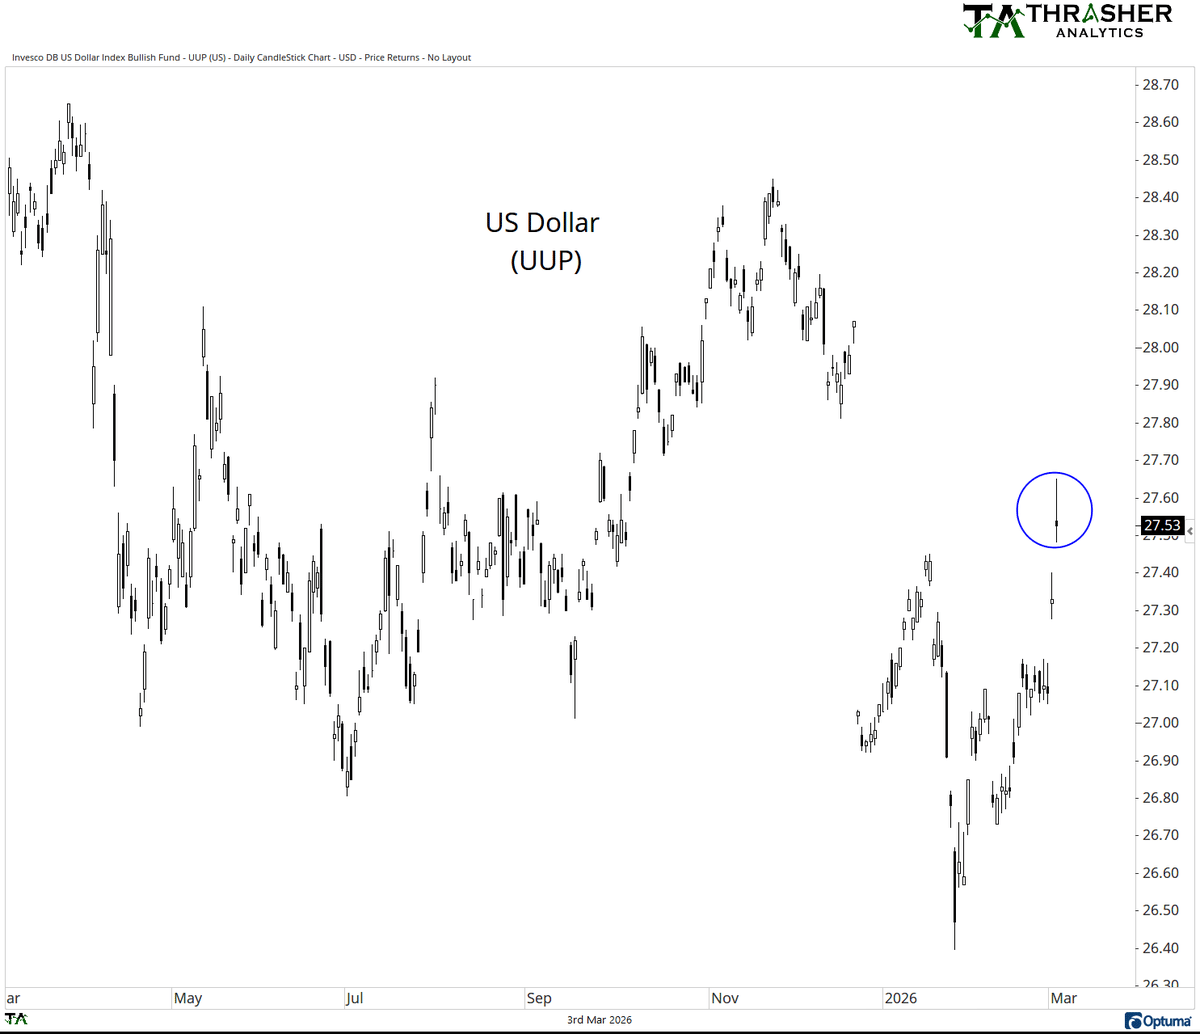
U.S. Dollar gapping up to the highest level since early Dec. '25. Written recently at Thrasher Analytics about the pot'l for dollar strength based on COT positioning data. $UUP $USD https://t.co/Q0aZULVSnr
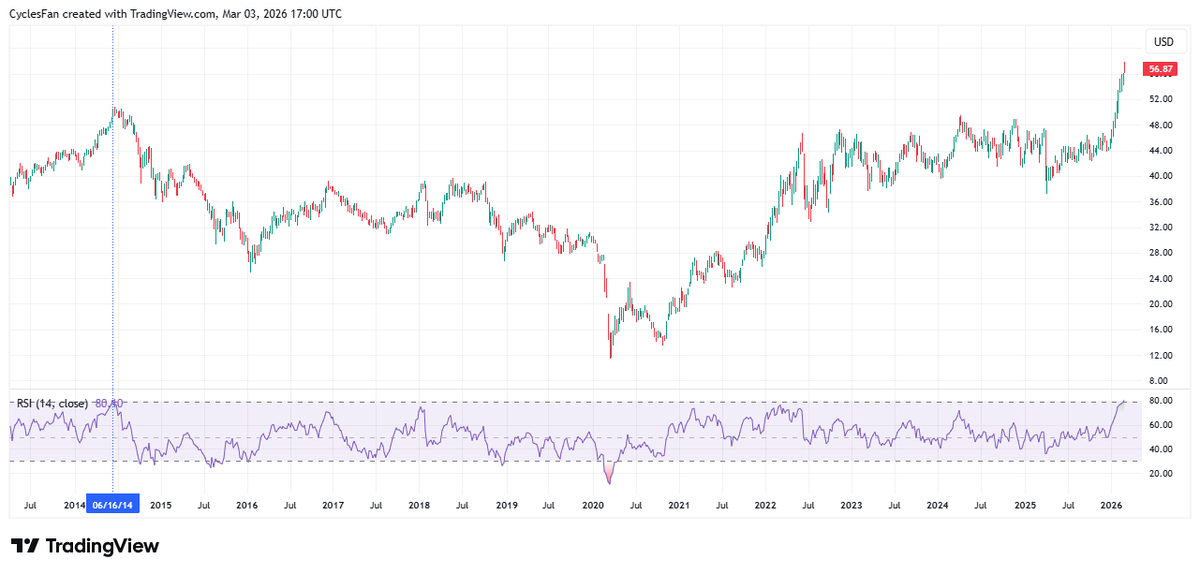
$XLE - The 14 week RSI is currently around 80. The last time it reached 80 was in June 2014. The June 2014 top was a major top that was followed by an almost 6 year bear market. https://t.co/VHRCjpkX18
Not as meaningful cavefill levels to upside (prefer to see on 120/240) but still, shows the importance of Europe levels. US session charts shows in a different way (8 AM EST) https://t.co/wQnjwcg9P9
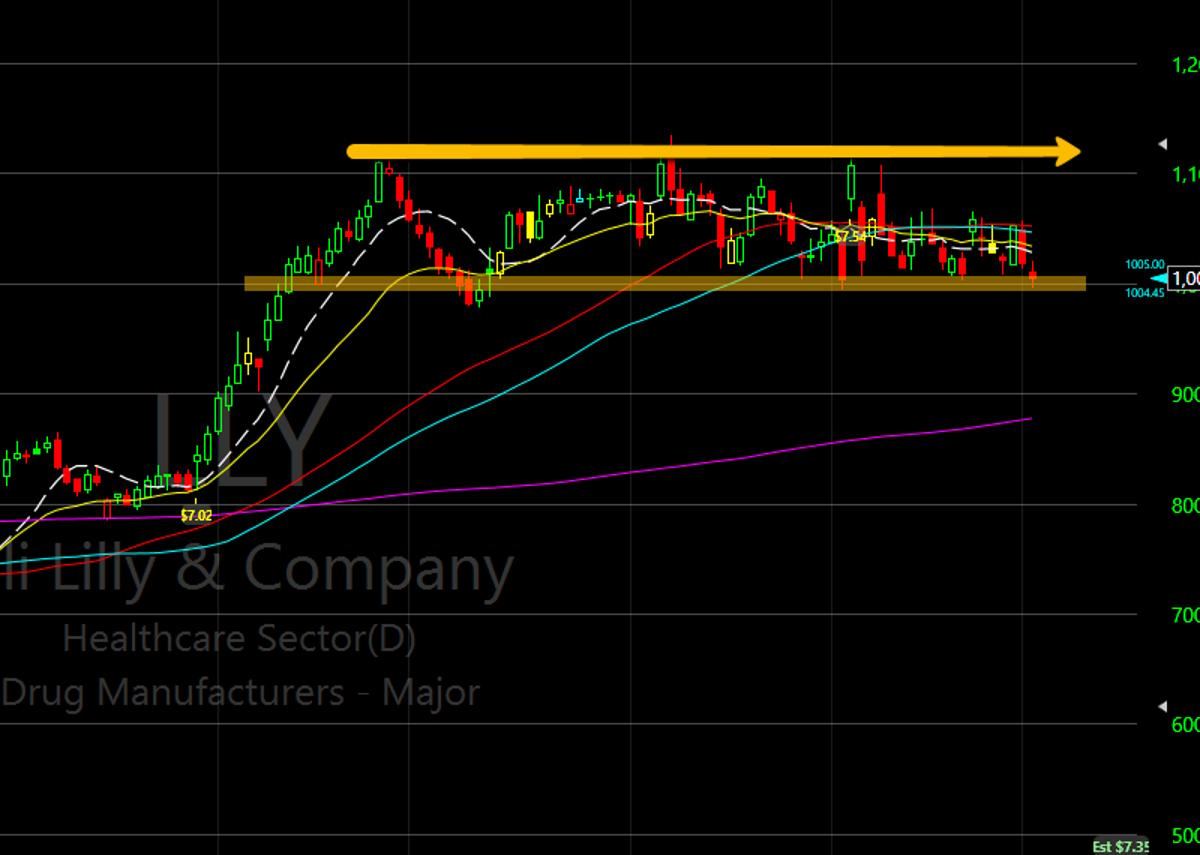
$LLY sideways for 3 months, underneath the 10-day, 21-day, 50-day, and 63-day moving averages. A little umbrella top. But RETA. Goddamn RETA, powerful, game changer. https://t.co/89KoJgjmV2
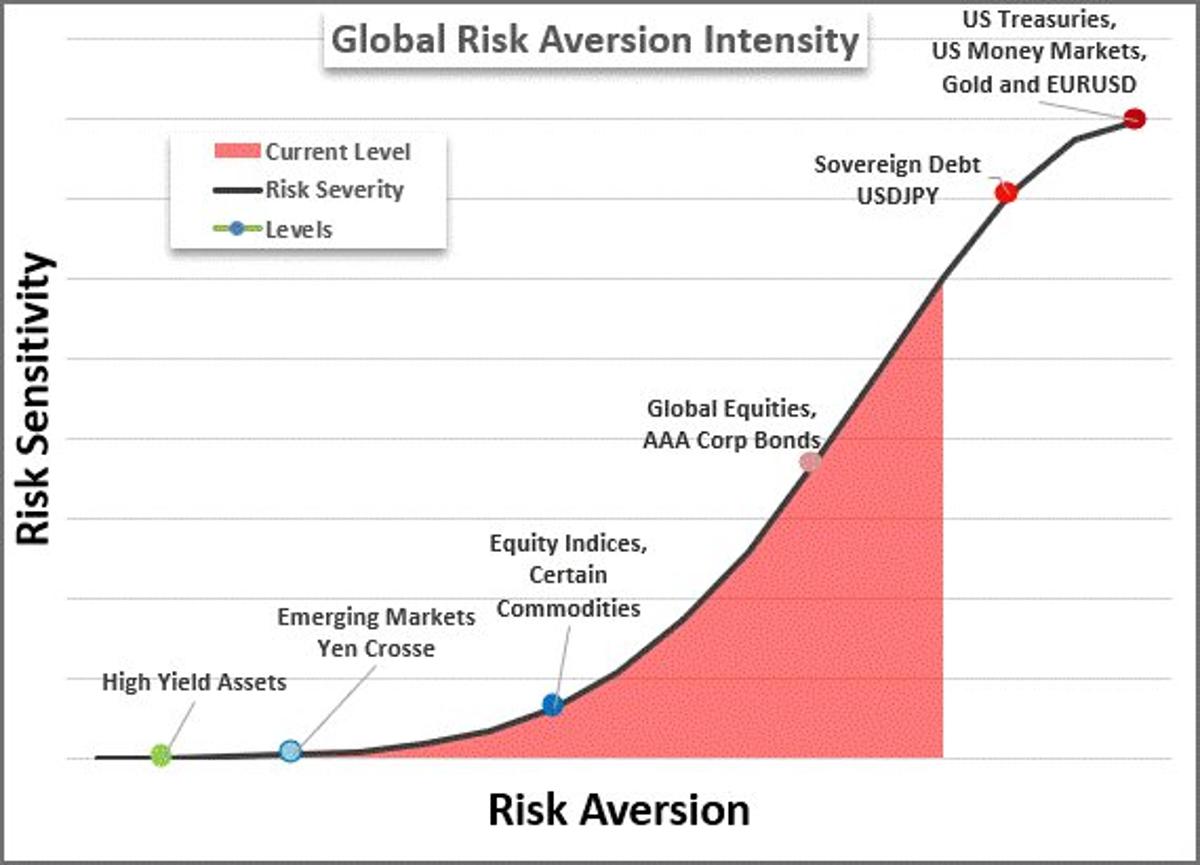
I did a video on the overview of the 'risk off' position last night after the US close. We are shifting into the more intense, sentiment-driven scenario: higher correlations, preference for liquidity above most other features, more intense moves. https://t.co/wSiCdtzp9e https://t.co/sRCRYfdQxz
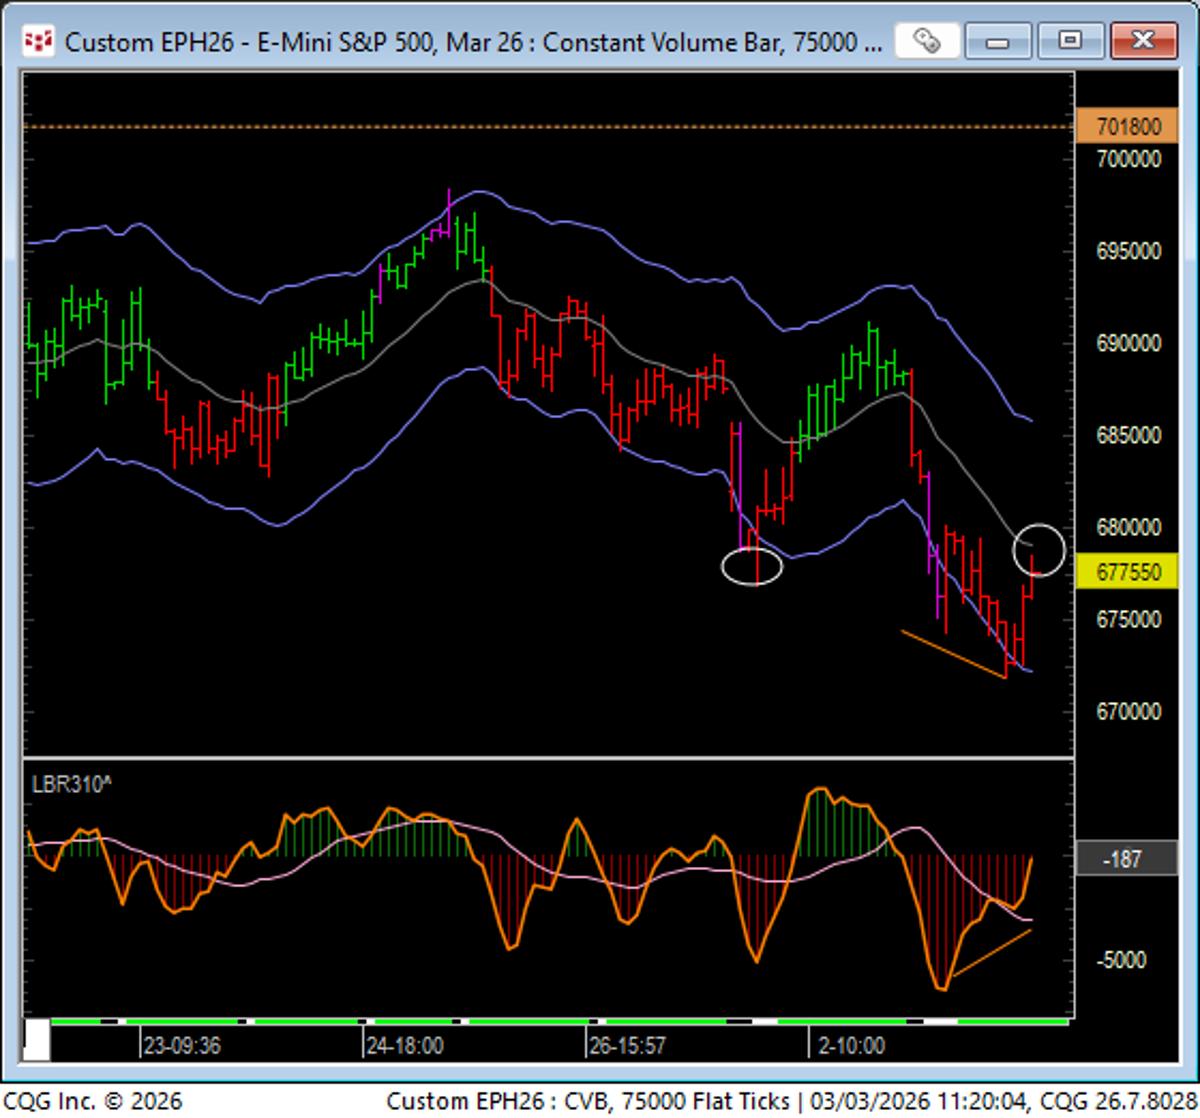
SP: technical reversion to the mean after time of day (end of first hour) climax on financials currencies, metals etc... https://t.co/Dgn0sGiXMm

Here is a podcast I did with @Stansberry Research and explained how Trading is Math: ⬇️ The 2:1 Rule That Makes You Profitable https://t.co/bgnpbRBOw9
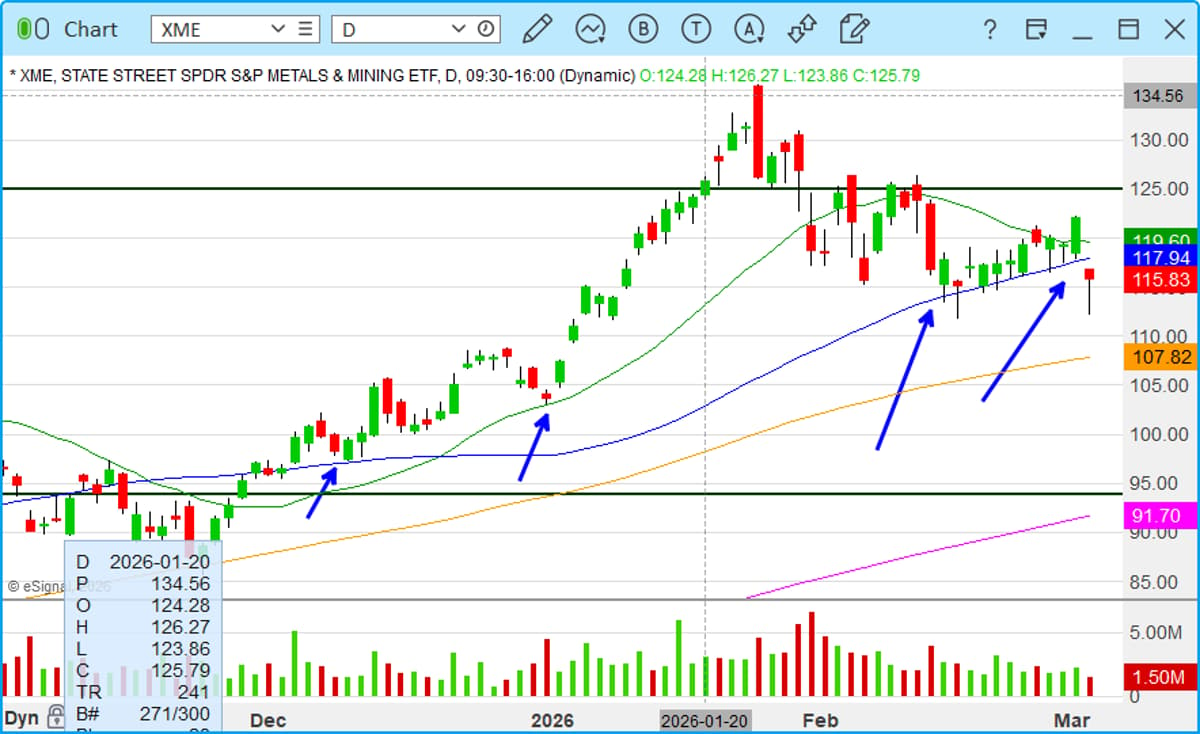
Beautiful move yesterday off 50sma, gap down below it today. $XME Metal volatility never disappoints https://t.co/XWFZZ8XFWH
Some software went green again and some of them keep making higher lows $msft $igv $now
Probably 15% to 20% coming on the downside The problem is that 20% can become a complete rout https://t.co/7zx4utMhwU
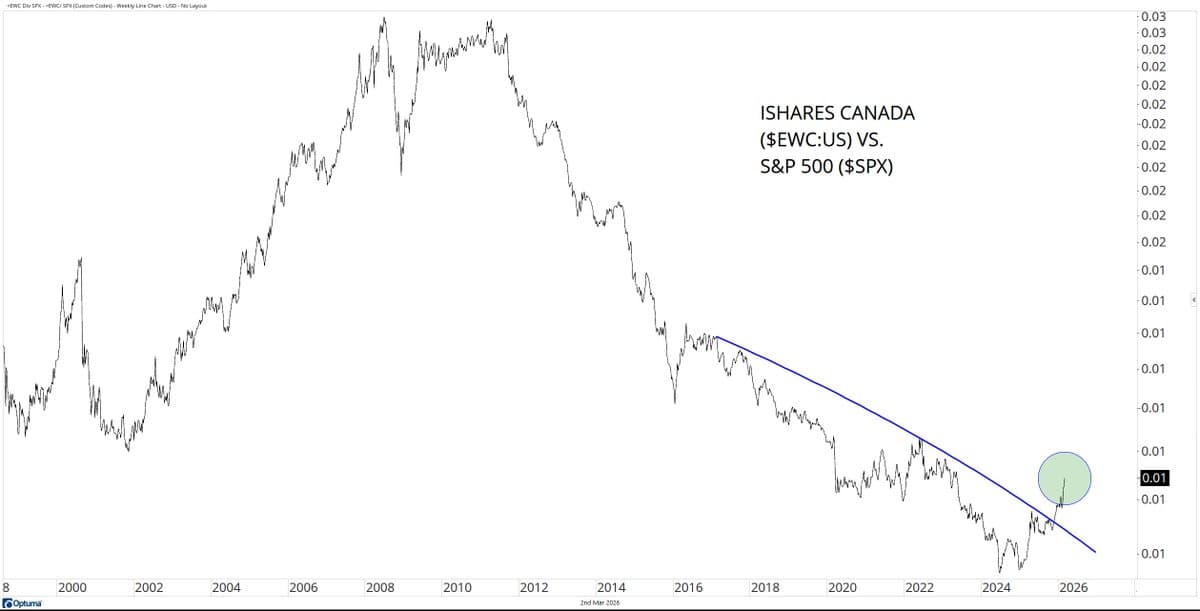
Canada stocks $EWC vs. U.S. stocks $SPX if this ends up being a big picture uptrend in development, you won't count me as surprised... remember, short-term trends turn first, then intermediate and then long-term... some choose to never rotate and stay...
Risk is off today: S&P 500 -2.2% Bitcoin -2.2% Nasdaq 100 -2.4% R2000 -3.4% Gold -4.7% EAFE -4.9% Emerging Mkts -6.7% Silver -8.9%
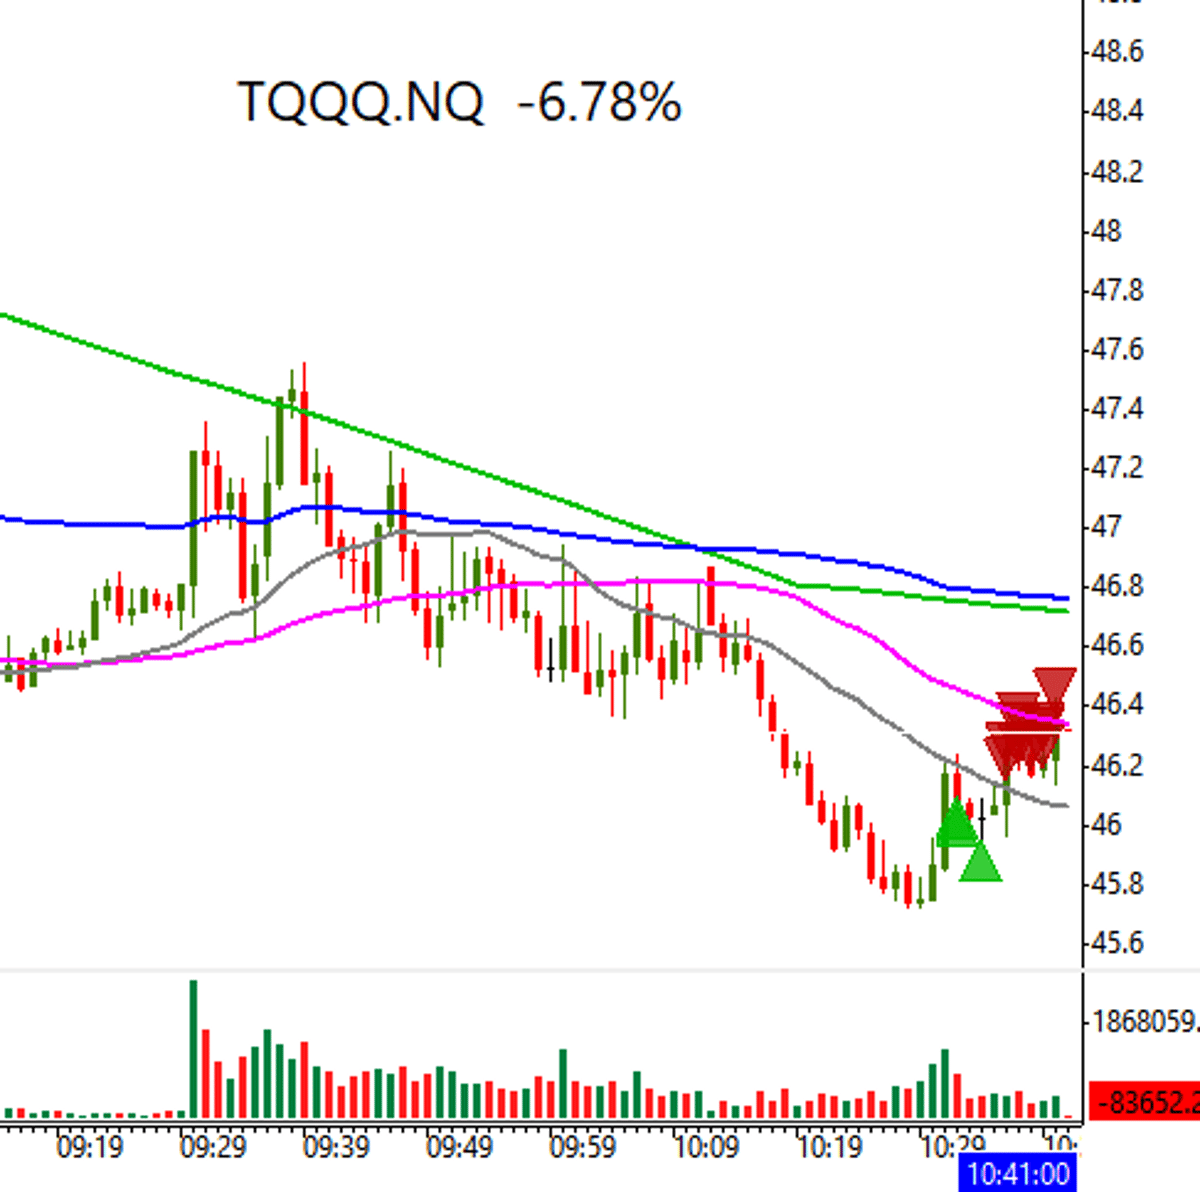
bottom snipe like here with a bottom pick on the NASDAQ here using $TQQQ 🎯🎯 $QQQ $SPY https://t.co/jAxoEQg65i
Bond Volatility winners $TW $MKTX also always a good market hedge / indicator of trouble coming
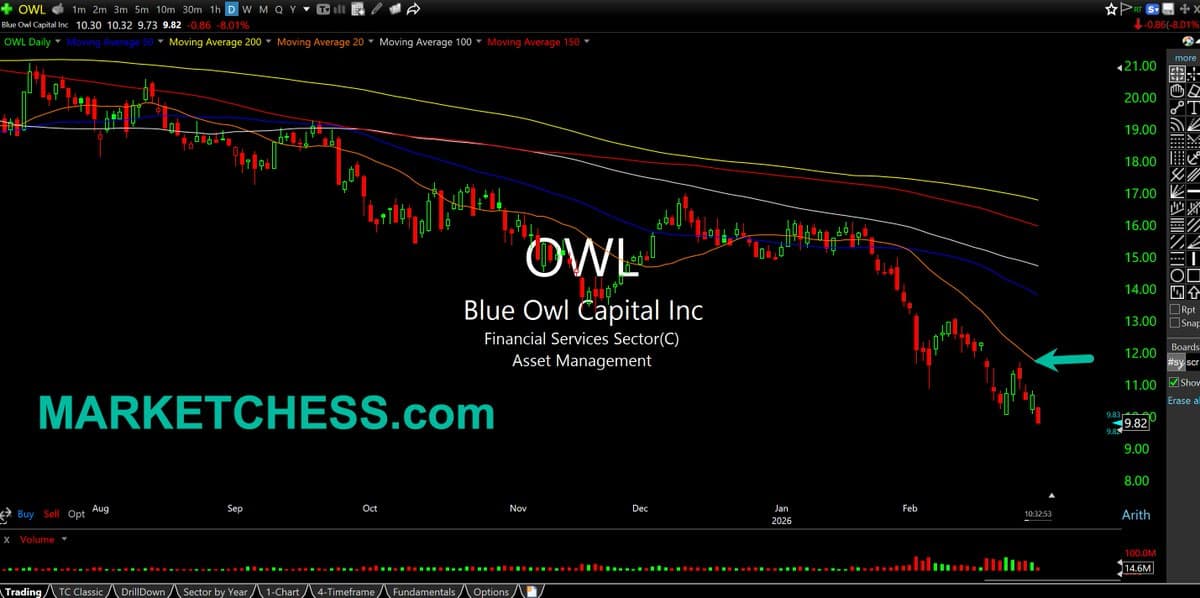
$OWL Daily. Clear downtrend. Weak bounces. Major issues lurking. Private credit starting to act like some problem financials in 2007/08. https://t.co/suwdNfuKKO
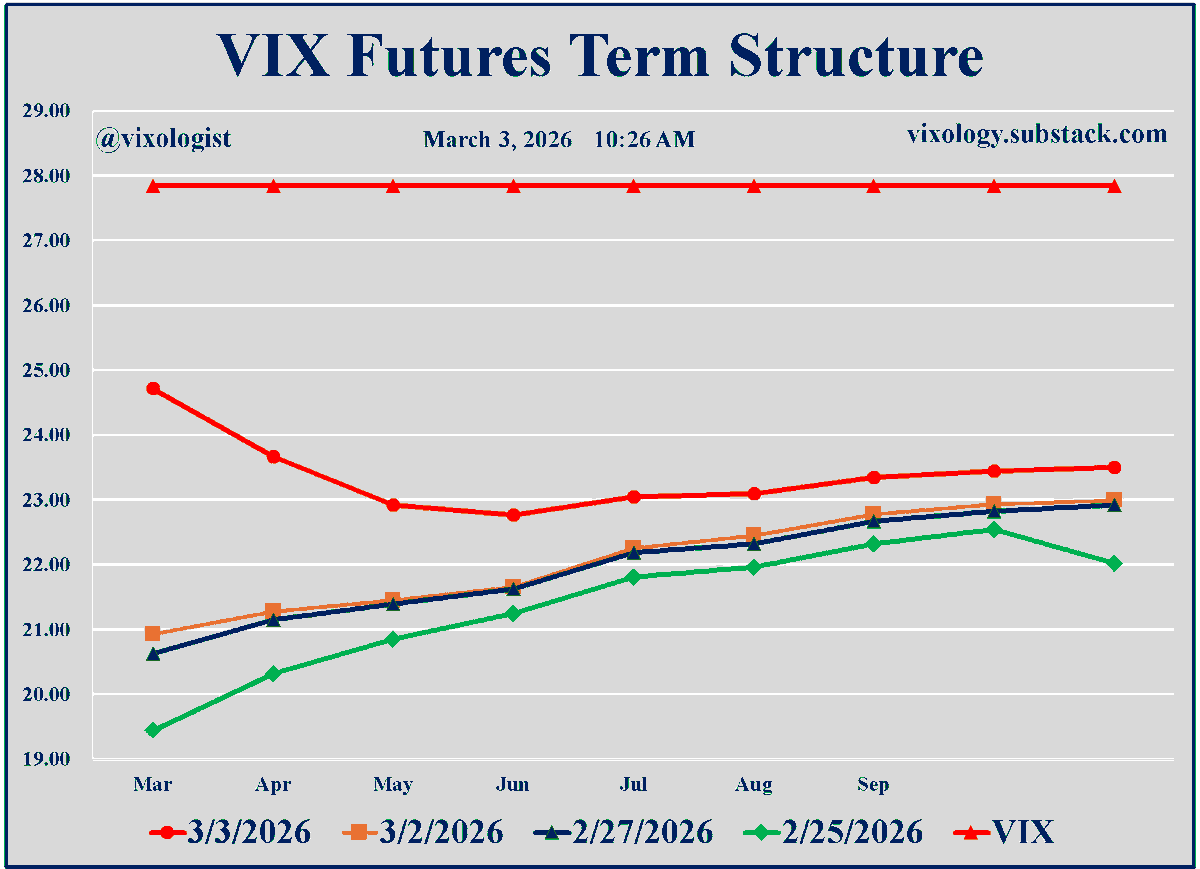
Vol gods very angry this morning. That means that $SVIX is being smashed to a level that gets it on the watch list. But it could be the first of a cluster (see March/April of last year), so be careful...

The SPX is now down ~2.5%. As the red annotations show, the 10-year yield is 5 bps lower to 4.06%. Bonds are being bought as crash insurance. This probably means stocks have to crash to keep bonds from trading back to 4.11%. https://t.co/Ks8NfeSfzT
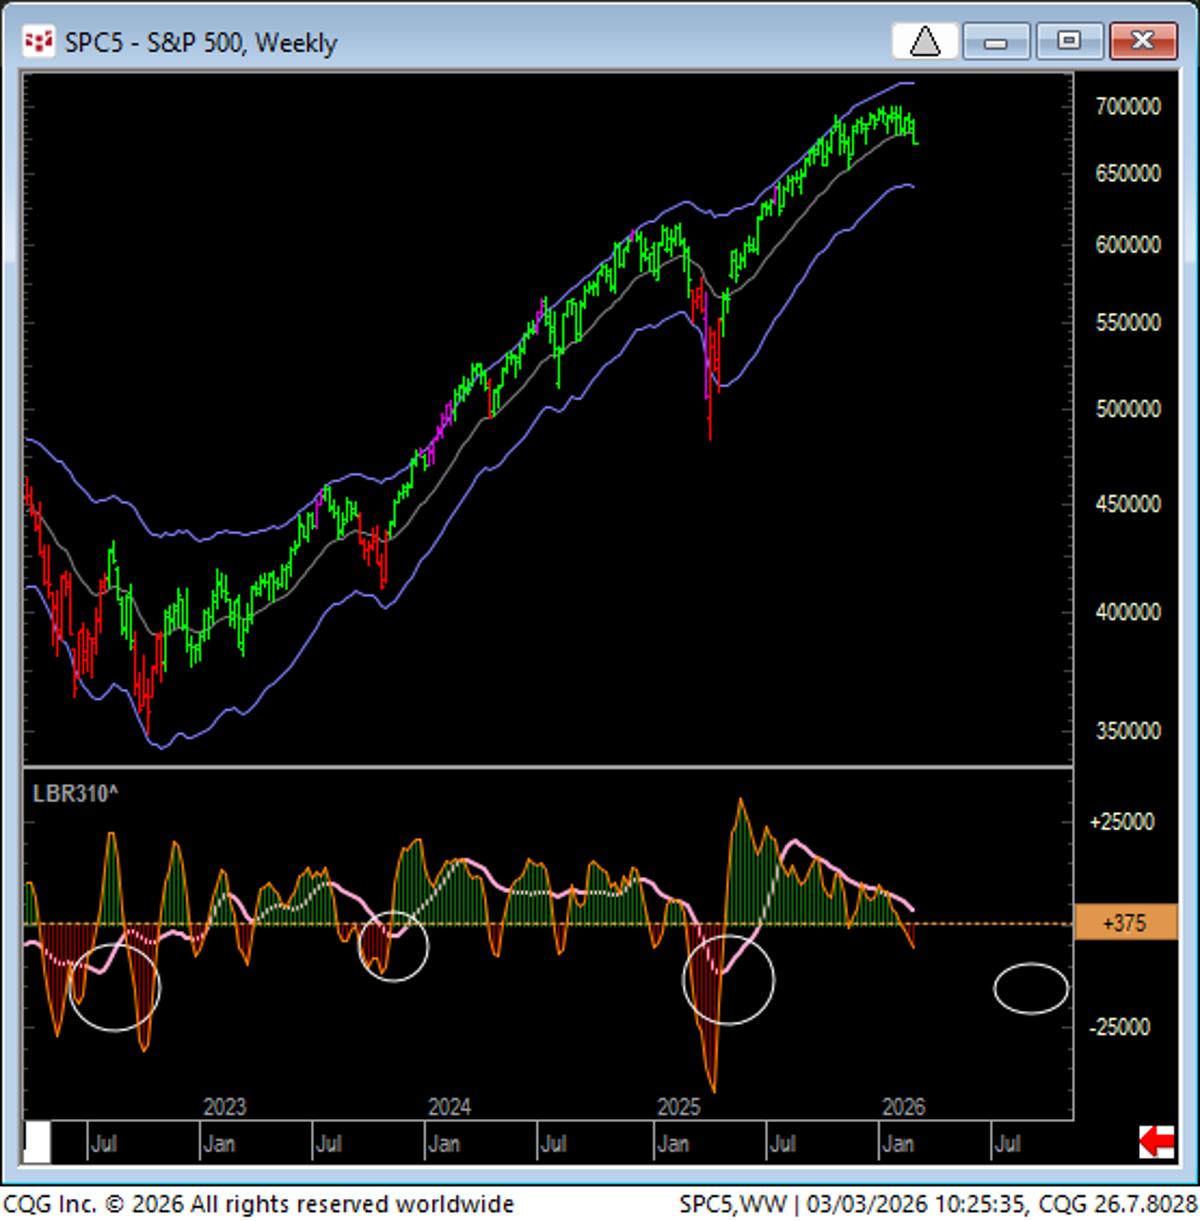
posted this chart awhile ago showing cycle work (need to see the weekly "slow line" get buried below the zero line). https://t.co/5u8fVYjmle
The structural makings for market downtrend have been long in the making...near record number of Hindenburg Sell signals (sometimes a dubious indicator) but speaks to the deteriorating market breadth. The surprising thing was how long the RS leaders kept...

Really hard to press shorts: one piece of good news erases days of gains in hours. And when it’s all said and done, the stock will rally 10% and still be in a downtrend. Nothing changed. Just pain

The rock solid complacent trends like $GLD, $EEM, and $ACWX all getting flushed today as the dollar rips another day https://t.co/f6LhWCRZLV
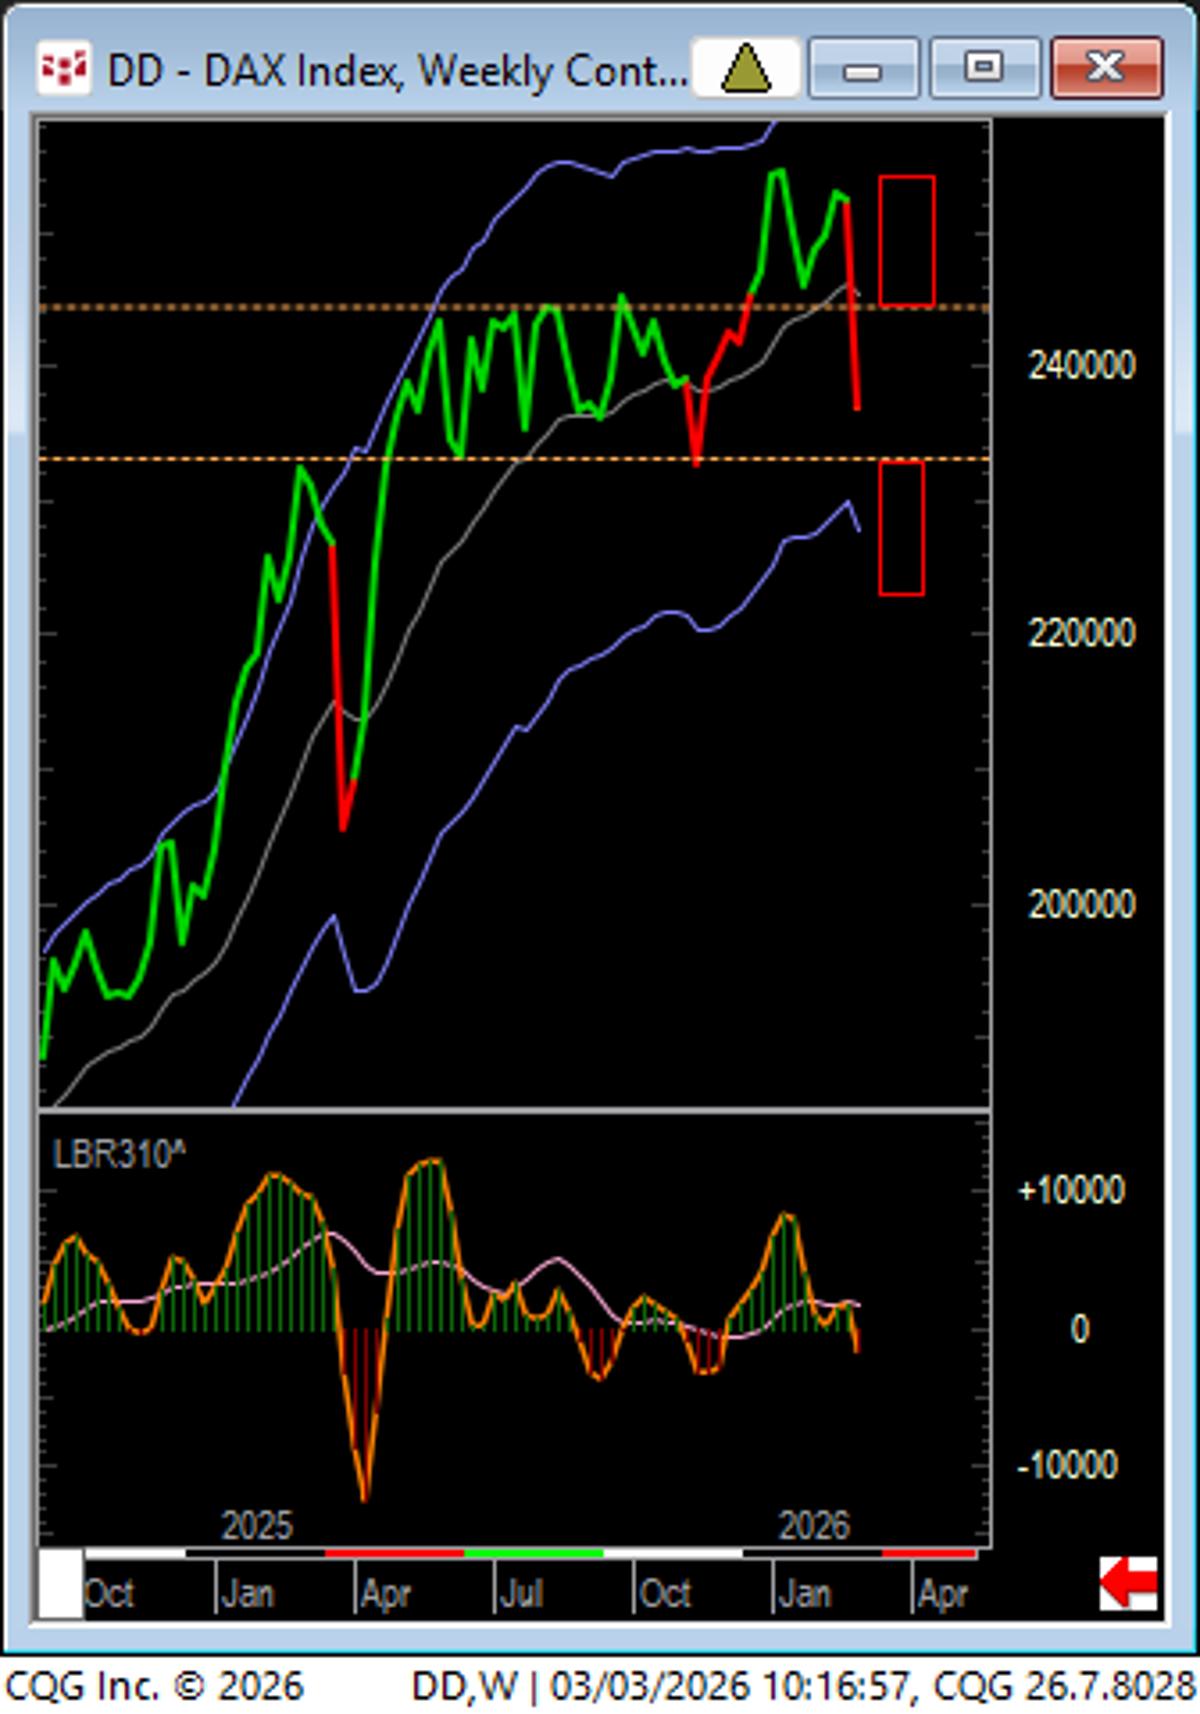
DAX - going to be fugly it this comes out the downside. (measured move projection possibility) https://t.co/OYKBGz8xYS
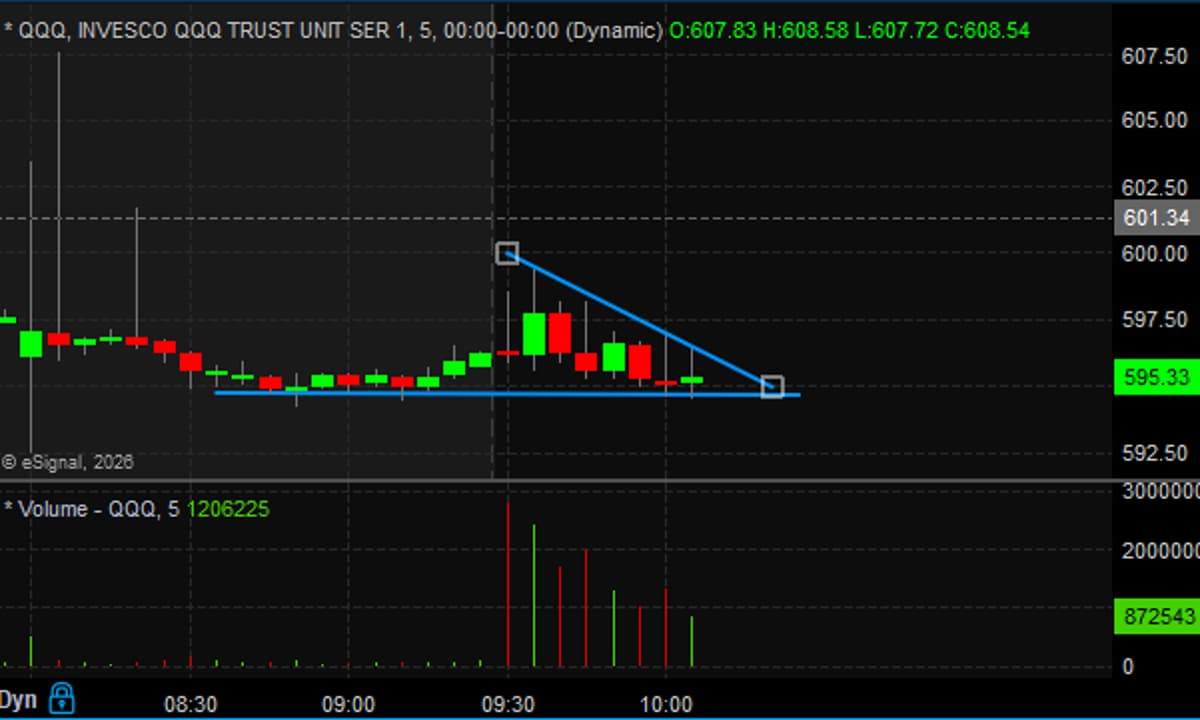
after failure to reclaim 600 $QQQ in a downtrend. held pre-market support first time... https://t.co/aA27OsTKQw
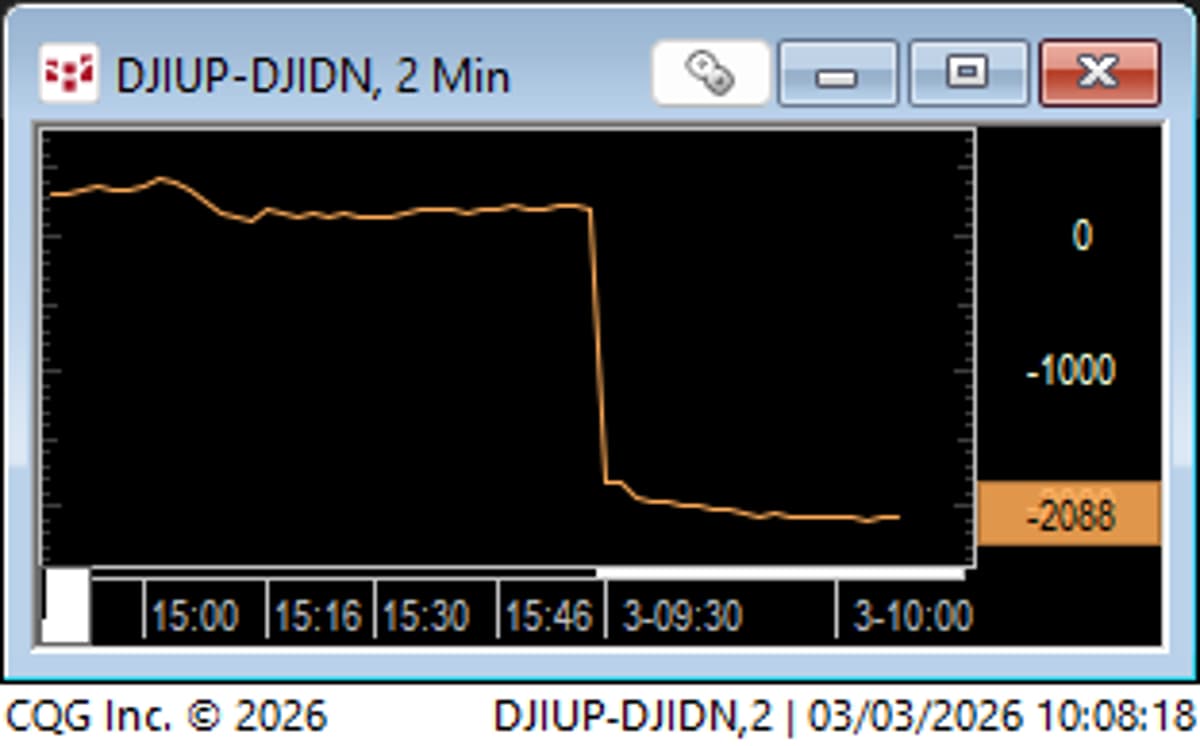
Its been a long time since we saw market breadth readings worse than -2000 https://t.co/vWEmtQAlyw
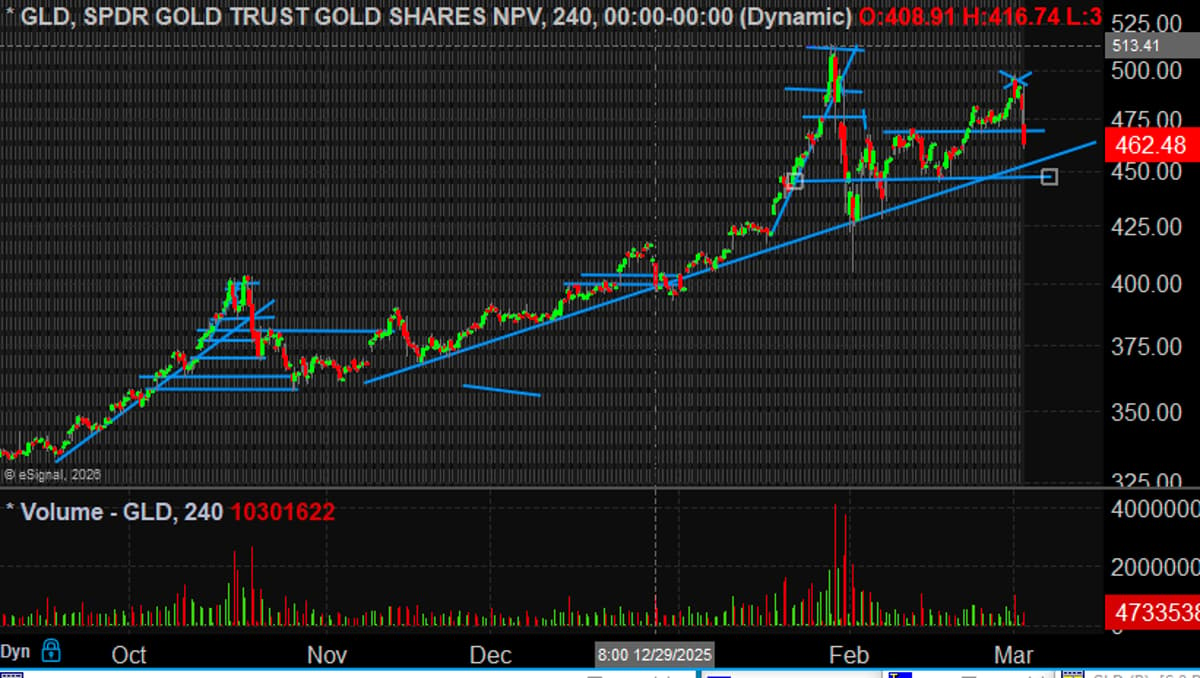
the top is probably in for $GLD. lower high ystdy into 500. rats running for the exits today... @PeterSchiff https://t.co/ZxaxY0aB5F

that's a mighty big surge of utilities $XLU vs. S&P 500 $SPX in the past 4-weeks (middle panel) - it's a bearish condition for the #betarotation model and if you haven't read their analysis @charliebilello @leadlagreport - i'd say you...