Know What's Happening in Stock Trading
Know What's Happening in Stock Trading

Moving Average Crossover Strategy Shows 6.9% Annual Return in Backtest
The moving average crossover approach generates mechanical buy or sell signals when a fast and a slow average intersect. Common pairings include 9/21 EMA for short‑term trades, 20/50 SMA for swing trades, and the classic 50/200 SMA Golden Cross for long‑term trends. Backtests of the Golden Cross from 1960 to present delivered a 6.9% annual return.

UAE equities fell sharply when markets reopened after a two‑day shutdown caused by the US‑Israeli attacks on Iran. The Dubai Financial Market General Index slid up to 4.9%, led by drops in Emirates NBD and Emaar Properties. Abu Dhabi’s FTSE ADX fell 3.4% by early afternoon. The decline reflects heightened regional geopolitical risk and investor caution.

Why Gold ( XAUUSD ) is heading down despite rising geopolitical escalations ? In short, this is a liquidity event. For detailed context , with potential trade idea on GOLD & SPX , watch the video below (8 minutes video...
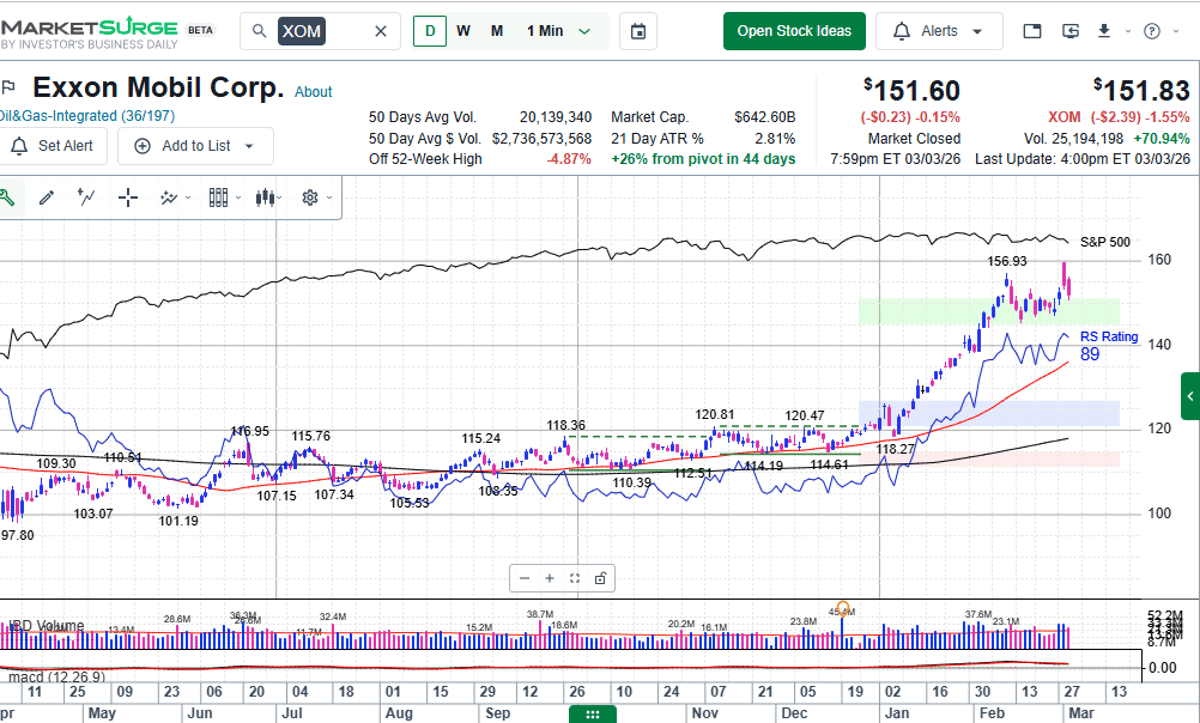
While Crude remains more than 10% higher than last Friday's close in two trading sessions, stocks like Exxon $XOM are at lower levels from last Fri close after its steep runup. @IBDinvestors @marketsurge Similar to Gold stocks starting to...

The Taiwan dollar fell to 31.782 per U.S. dollar, its weakest level since May, after foreign investors sold NT$230.2 billion of Taiwanese stocks this week – the largest weekly outflow since at least 2000. The sell‑off was triggered by heightened geopolitical...
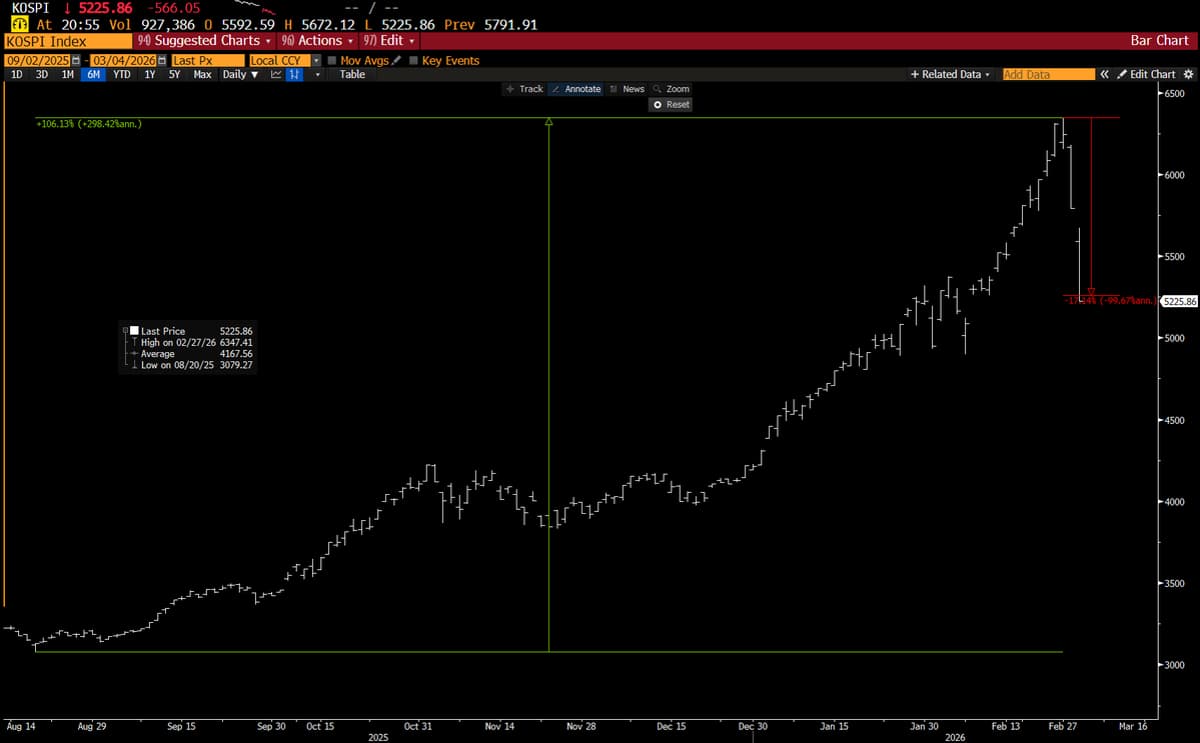
*CIRCUIT BREAKER TRIGGERED AFTER S. KOREA'S KOSPI PLUNGES 8% *KOREA'S KOSPI EXTENDS DROP TO 10% AFTER TRADING RESUMES The chart shows that the South Korean KOSPI stock index has doubled since last August (green) and has already corrected 17% from Friday's high...
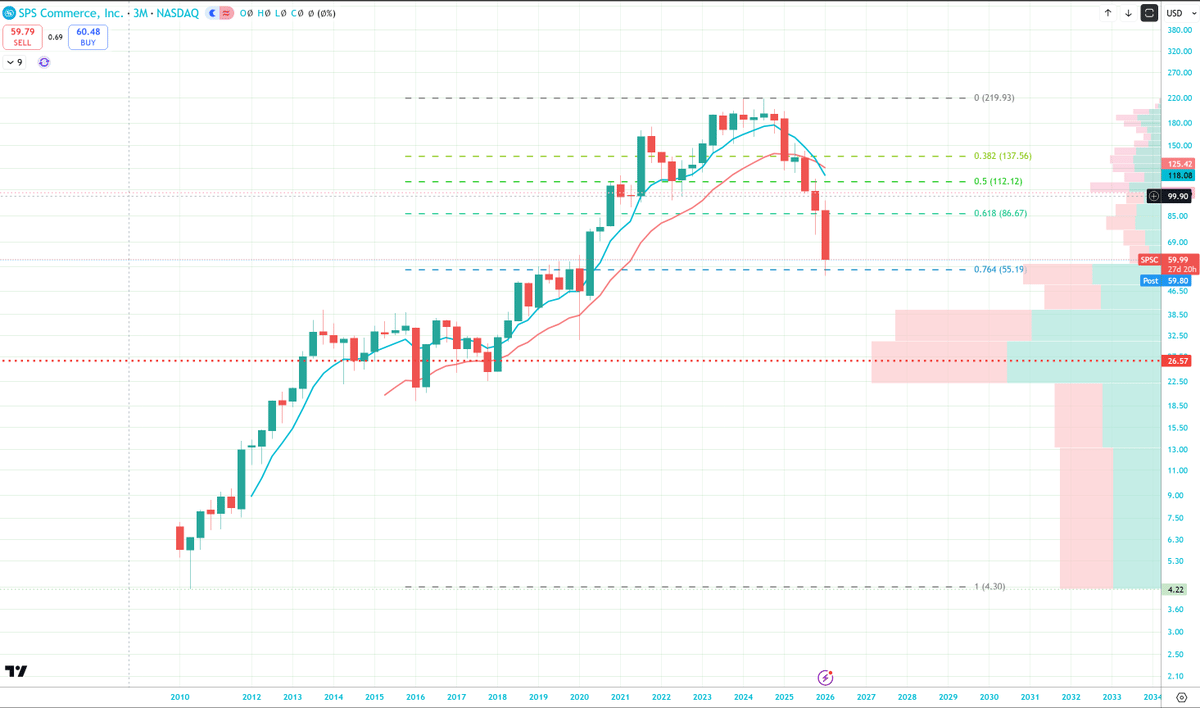
I'll do this one public...always liked this Co. and is wildly cheap at these levels... Unusual Call Spread in High Quality Software Player at Record Cheap Valuation with Limited AI Disruption Risk SPS Commerce $SPSC with an interesting trade of 3/3 as...

Software equities outperformed semiconductors sharply, driving the IGV‑SOX performance spread to a 10‑year high of 14.70% on a six‑day rolling basis. This marks the largest spread since the index’s inception, with only six days in the past decade exceeding a...
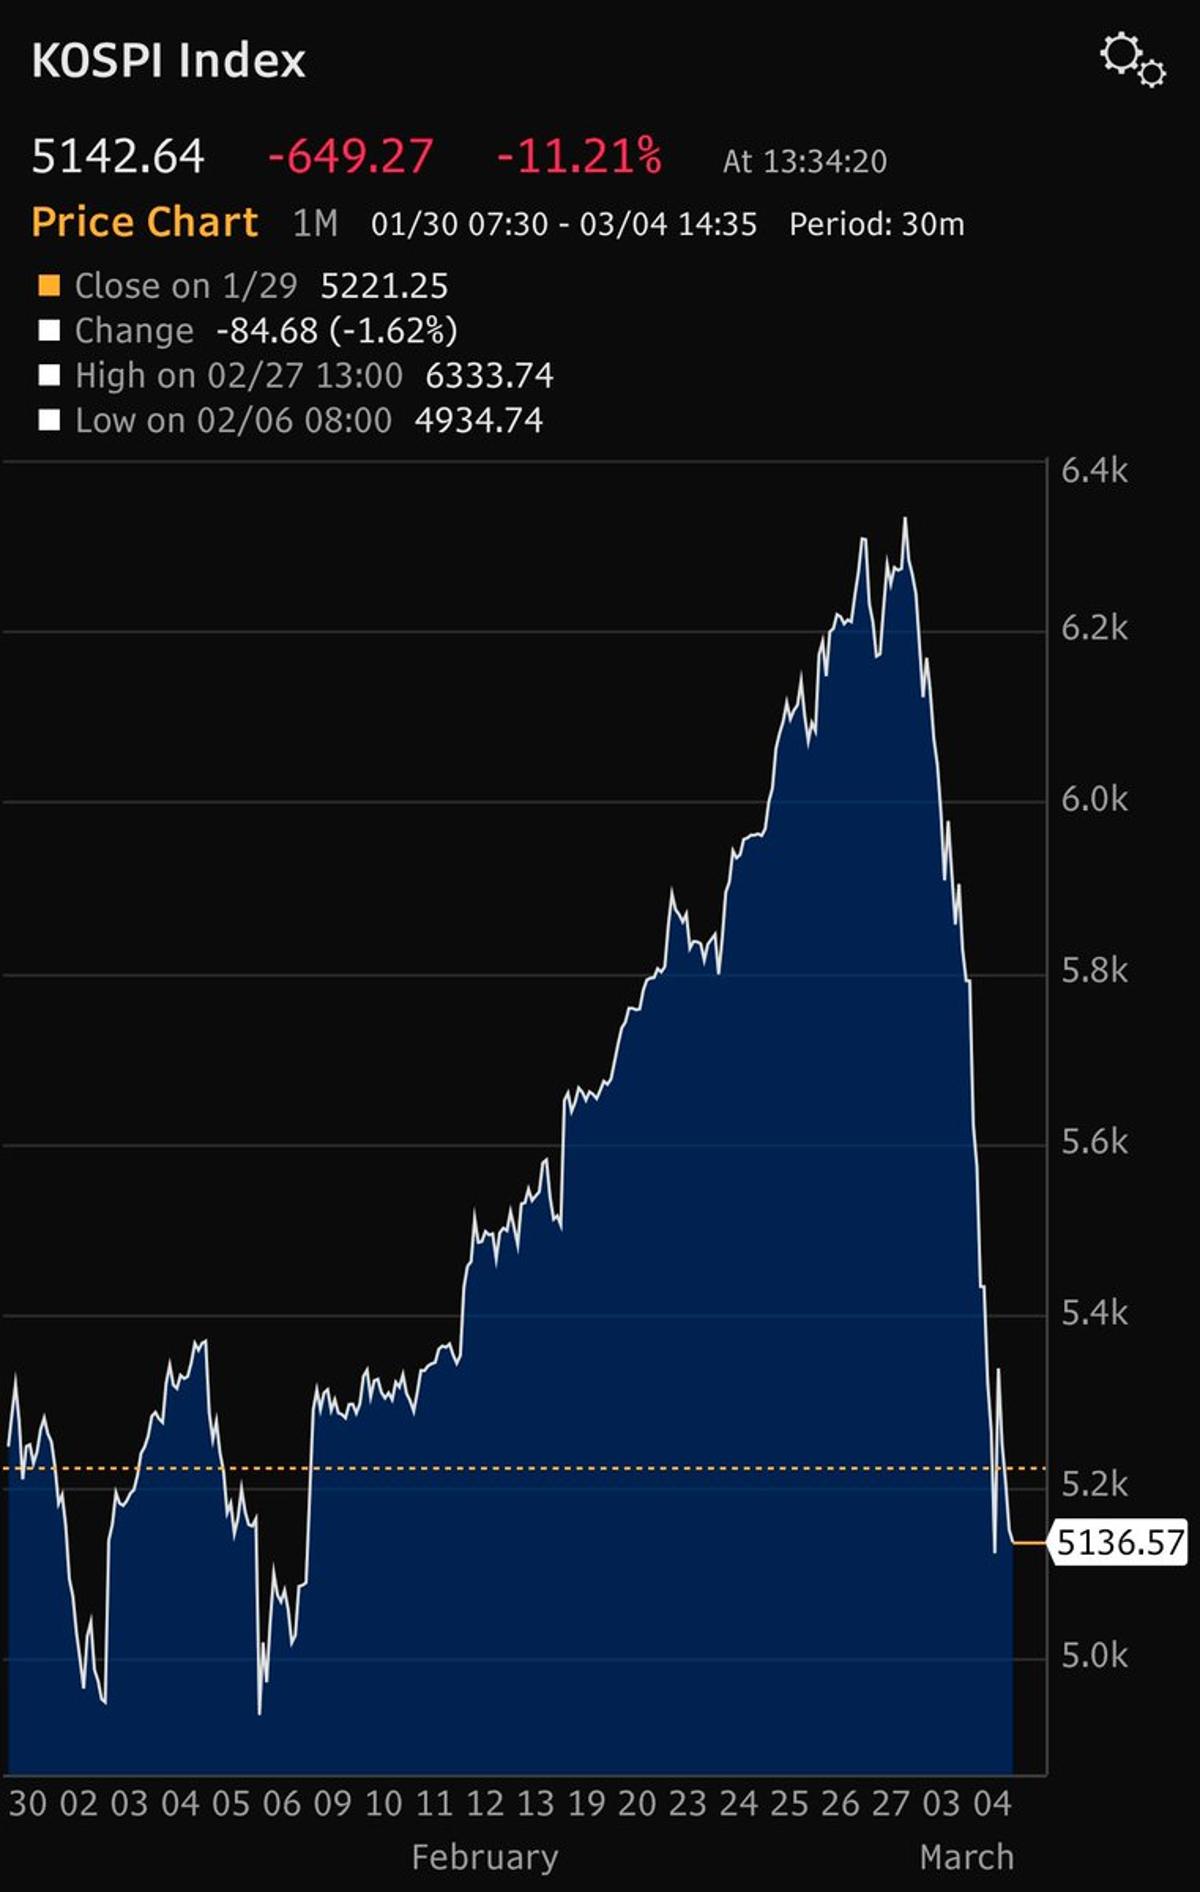
Korean stocks may well see the quickest transition from bull to technical bear market on record. Three-day losses nearing 20% now. Elevator up, cliff jump down https://t.co/g8dAOgm798
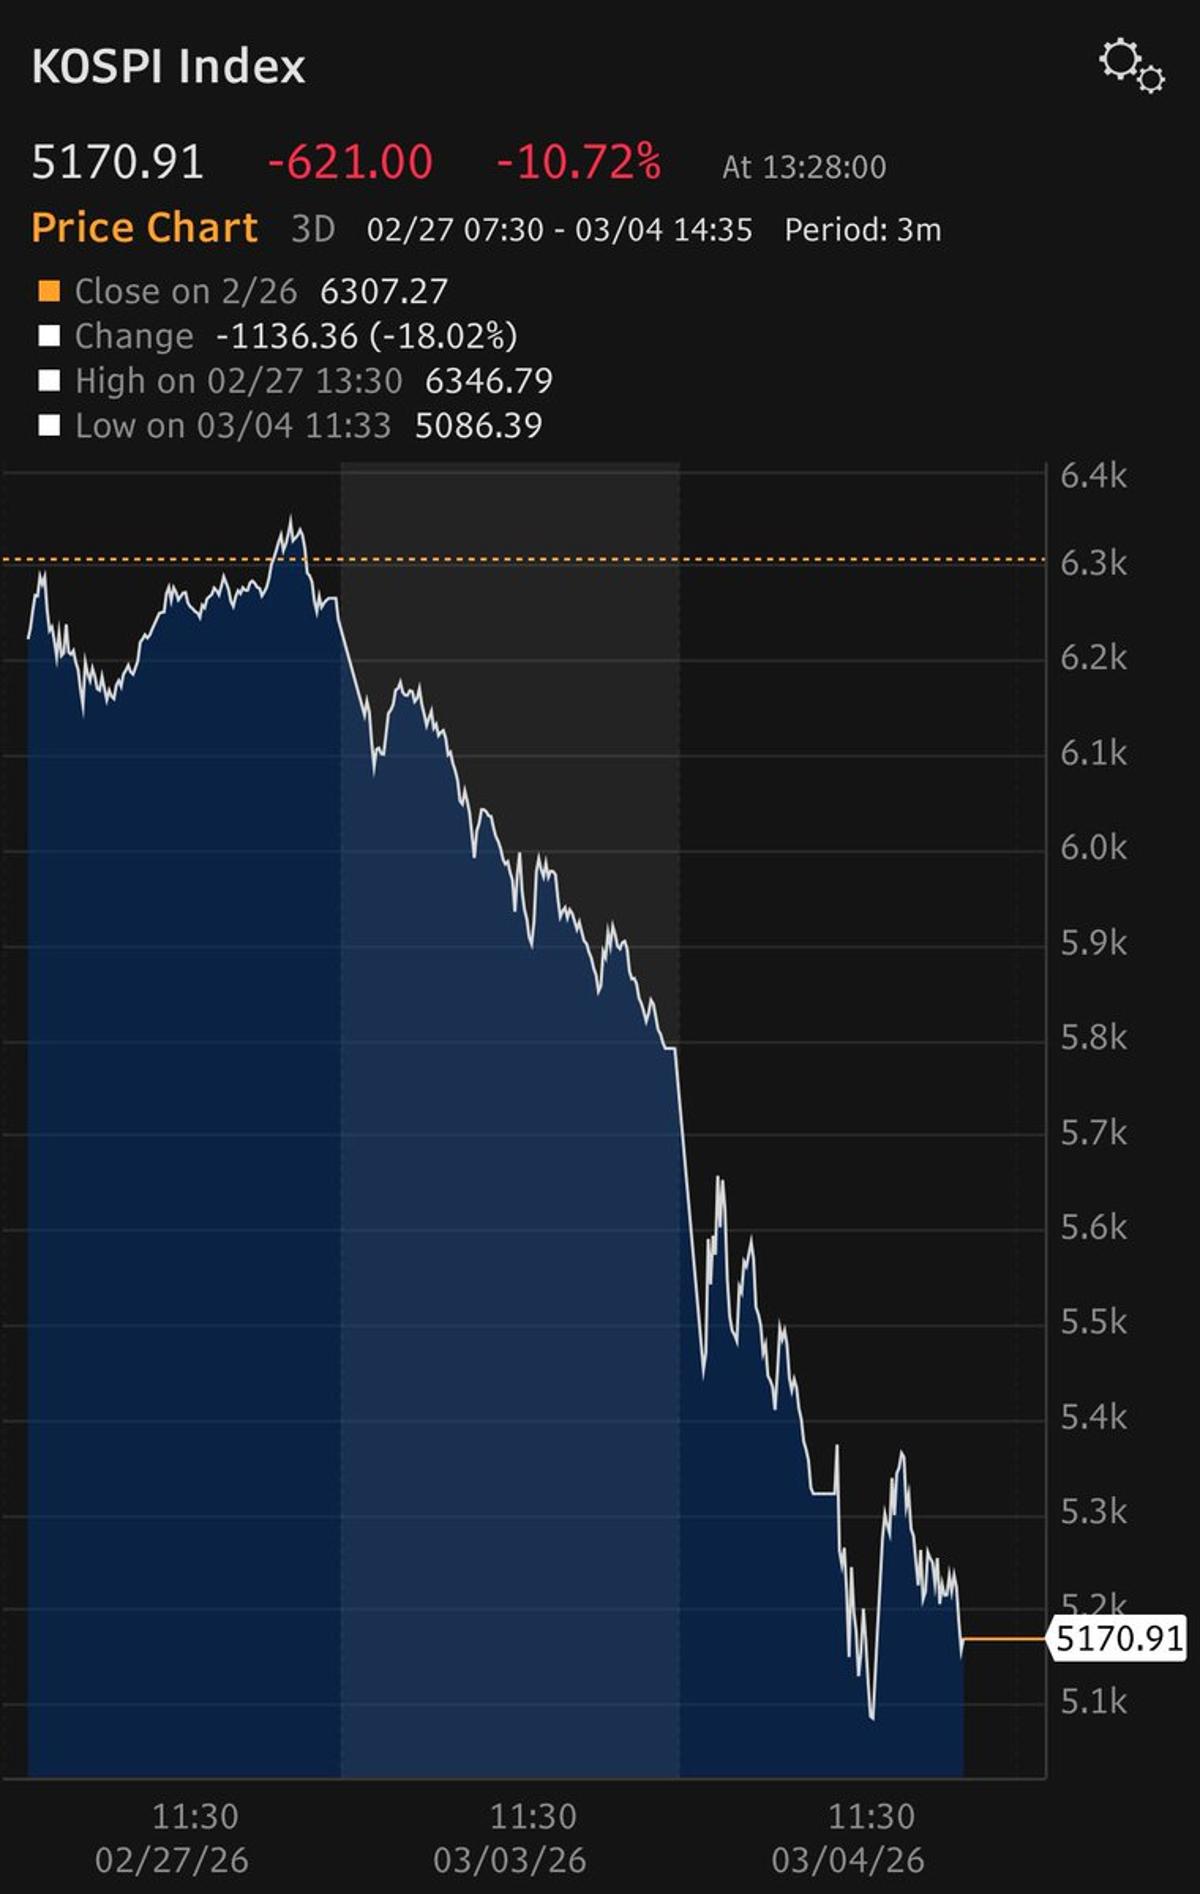
Korea’s KOSPI index could enter a bear market after just 3 days.. index is down 18% now from last Thursday’s close 😱 https://t.co/mh7dDzAwFg

Leveraged and inverse ETFs posted strong weekly gains, with Defiance’s IONX leading at 36.79% after IonQ’s earnings surge. Gold‑related leveraged products such as GDXU, AGQ, and NUGT posted 20%‑plus returns driven by rising precious‑metal prices amid Middle‑East tensions. Regional and...
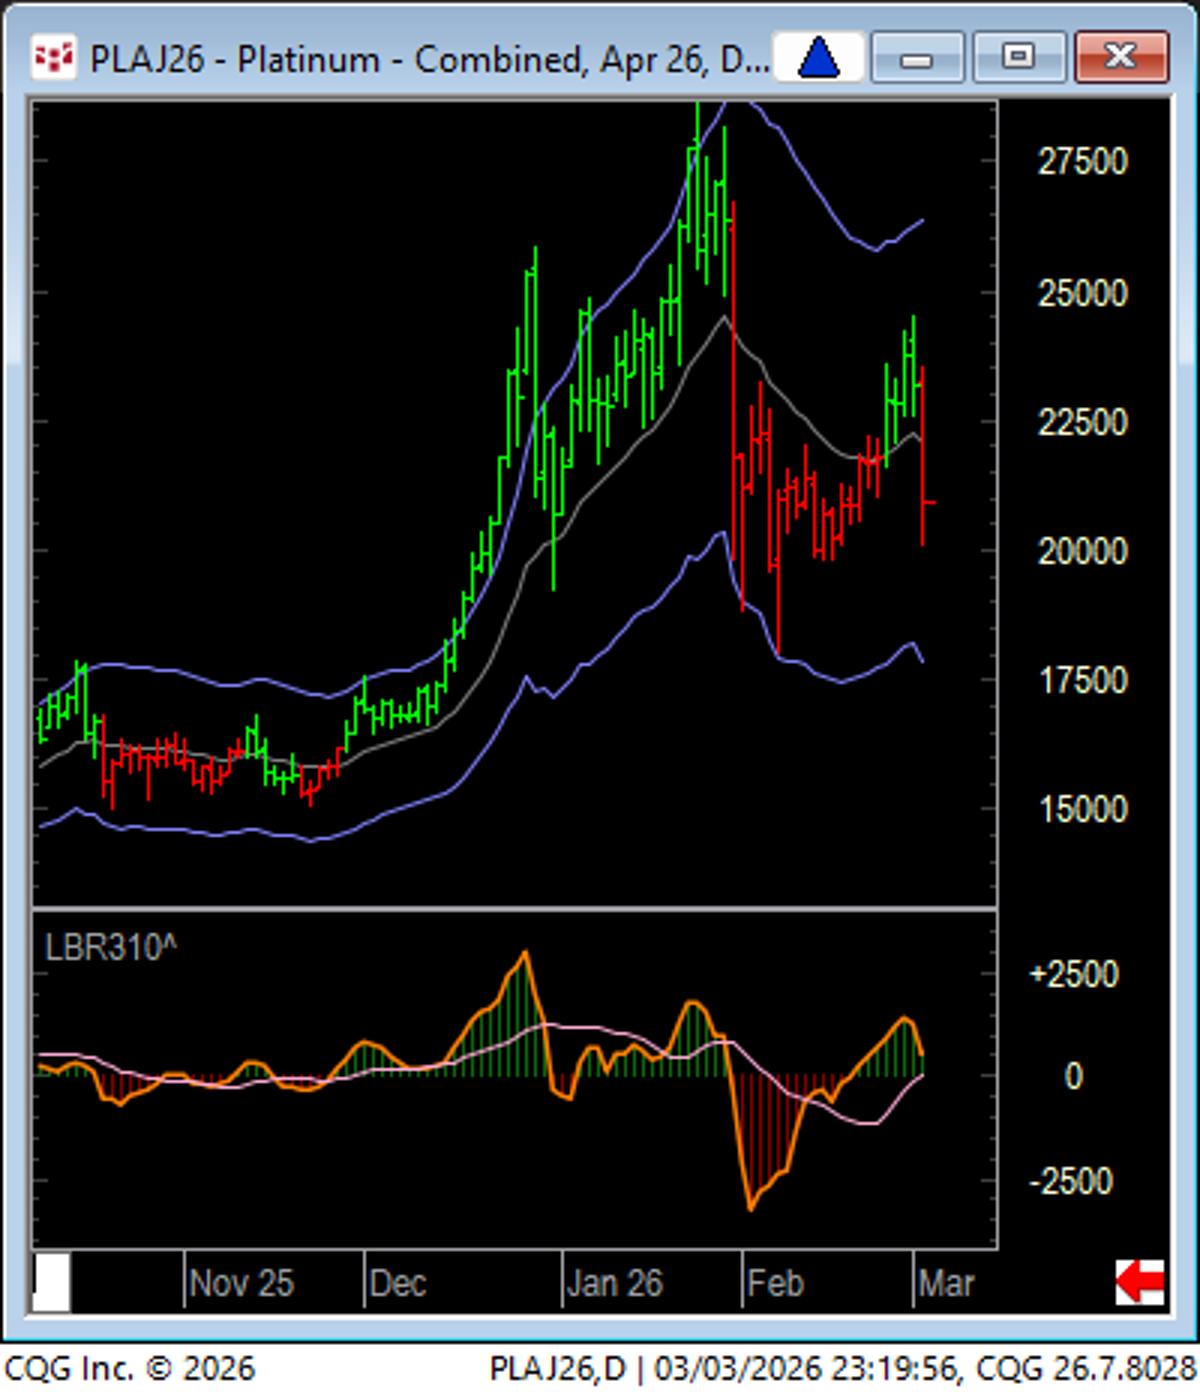
Platinum daily H and S looks too perfect...weeklies look like prolonged trading range in the cards. https://t.co/1aX3R3ZKmT
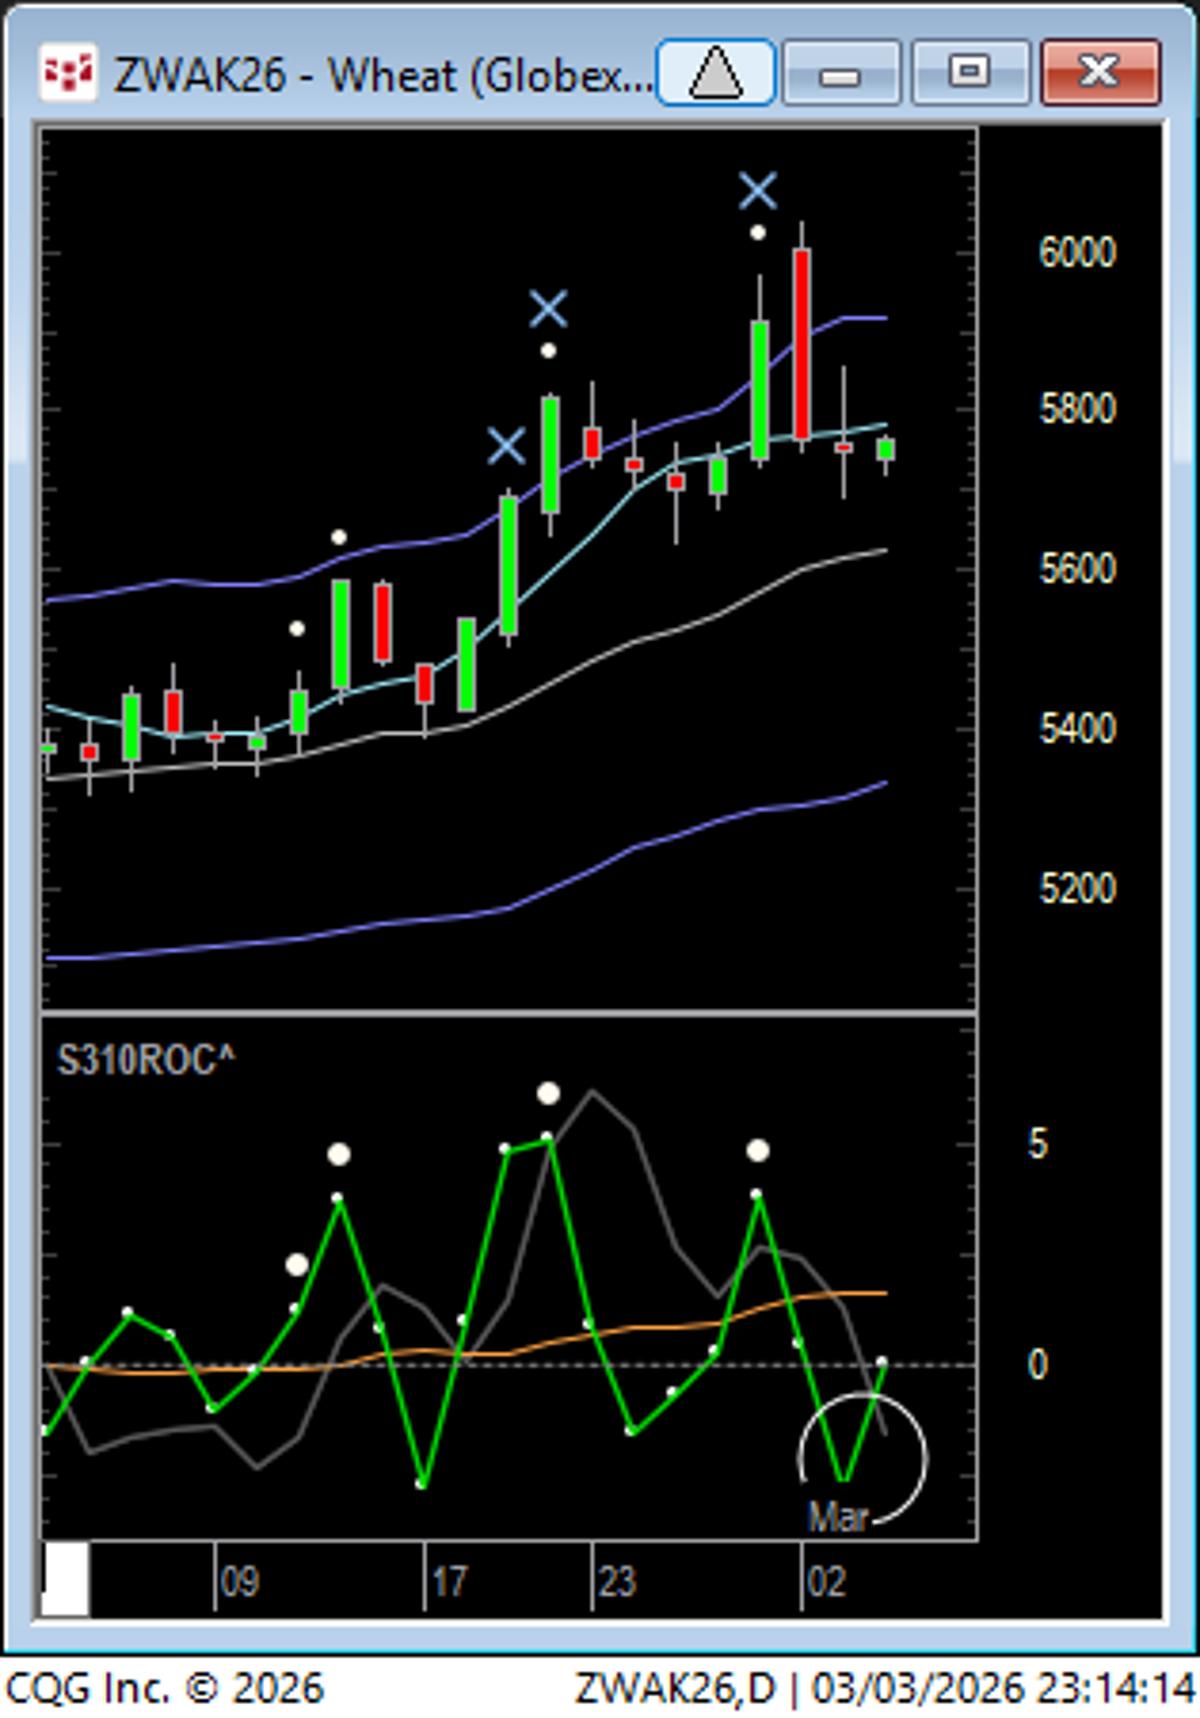
W - 35 cent 2-day range...ROC on Buy day but also did a V at top...default mode = consolidate with upside bias still. https://t.co/nKAbeaGzQn

Today was a 78% downside day. Has no significance. DVOL/(UVOL+DVOL); Lowry’s definition. Data per https://t.co/iX5L1DJIjD. See https://t.co/7TpOm9eA5A for explanation.
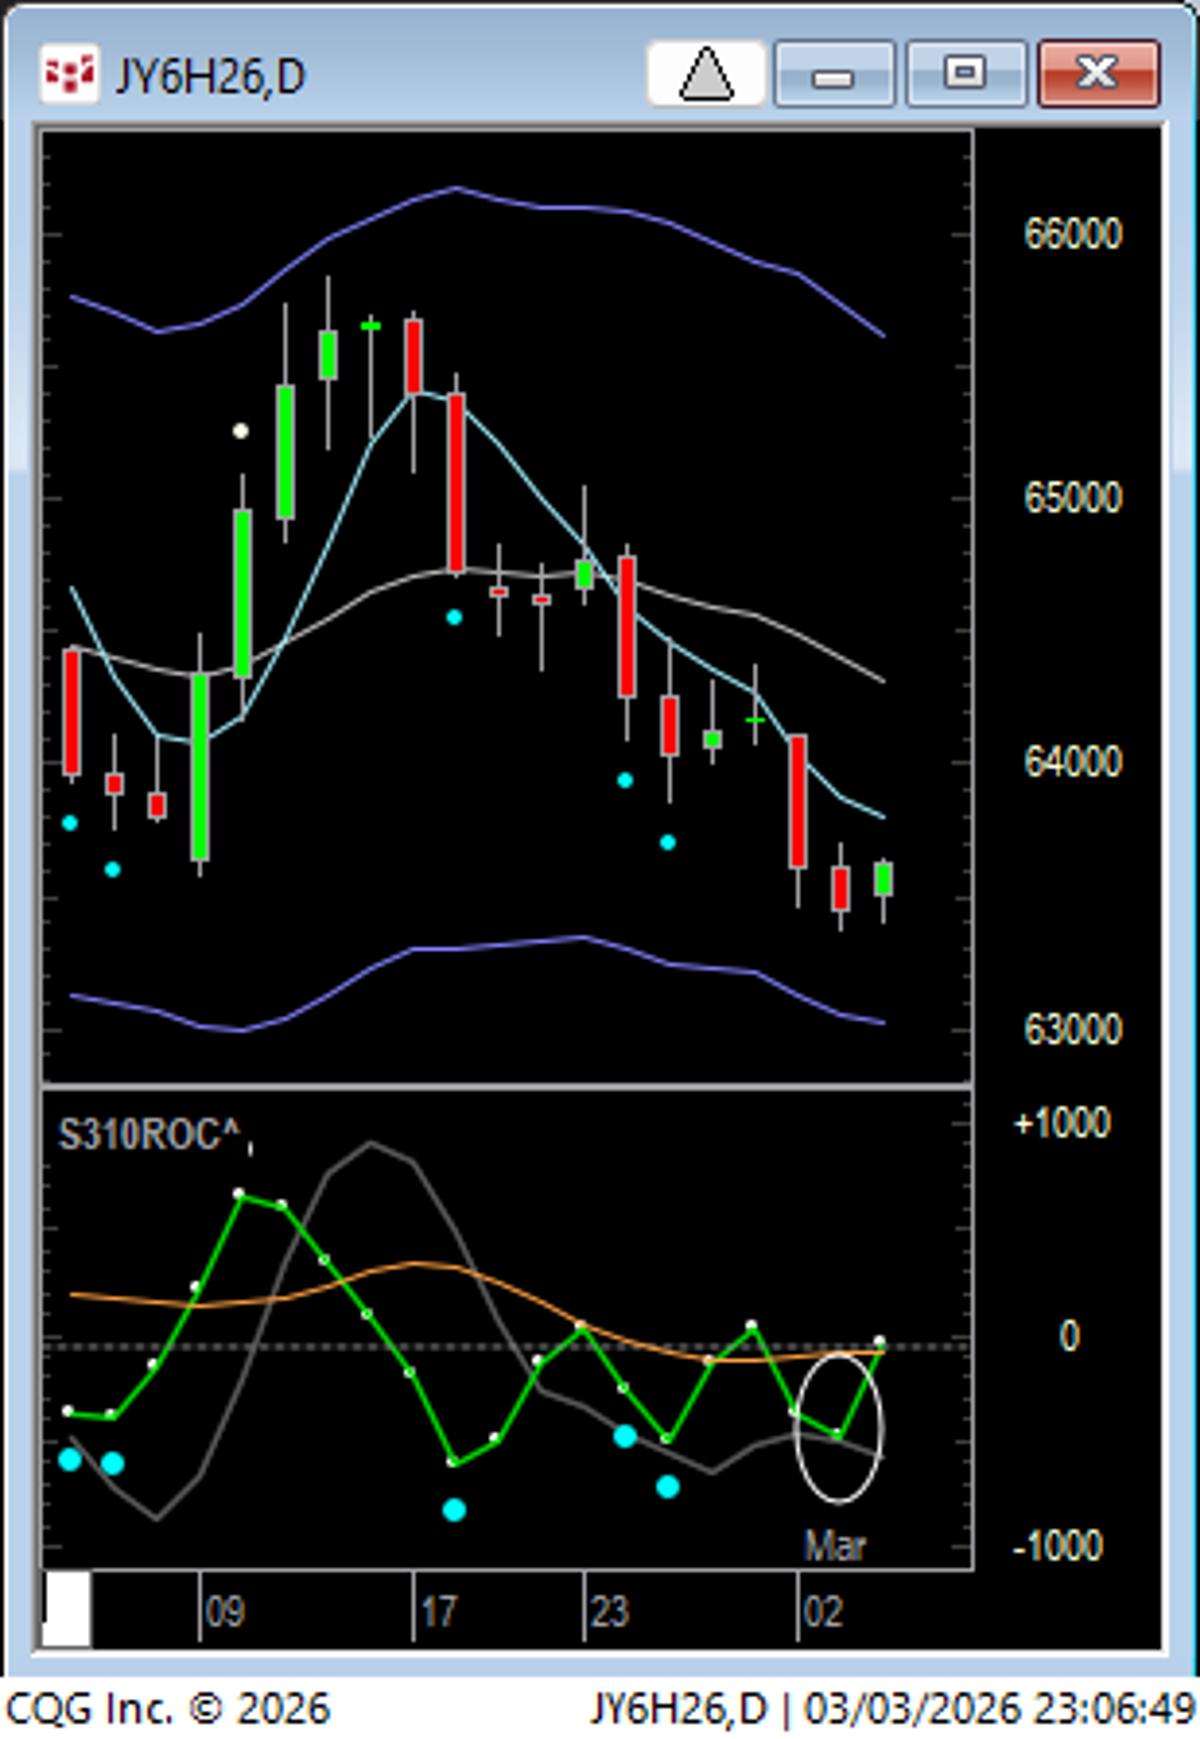
YEN - 12 days down on extended run - a close above the 5 SMA can set up a short sale. https://t.co/V3KhPE1bpS
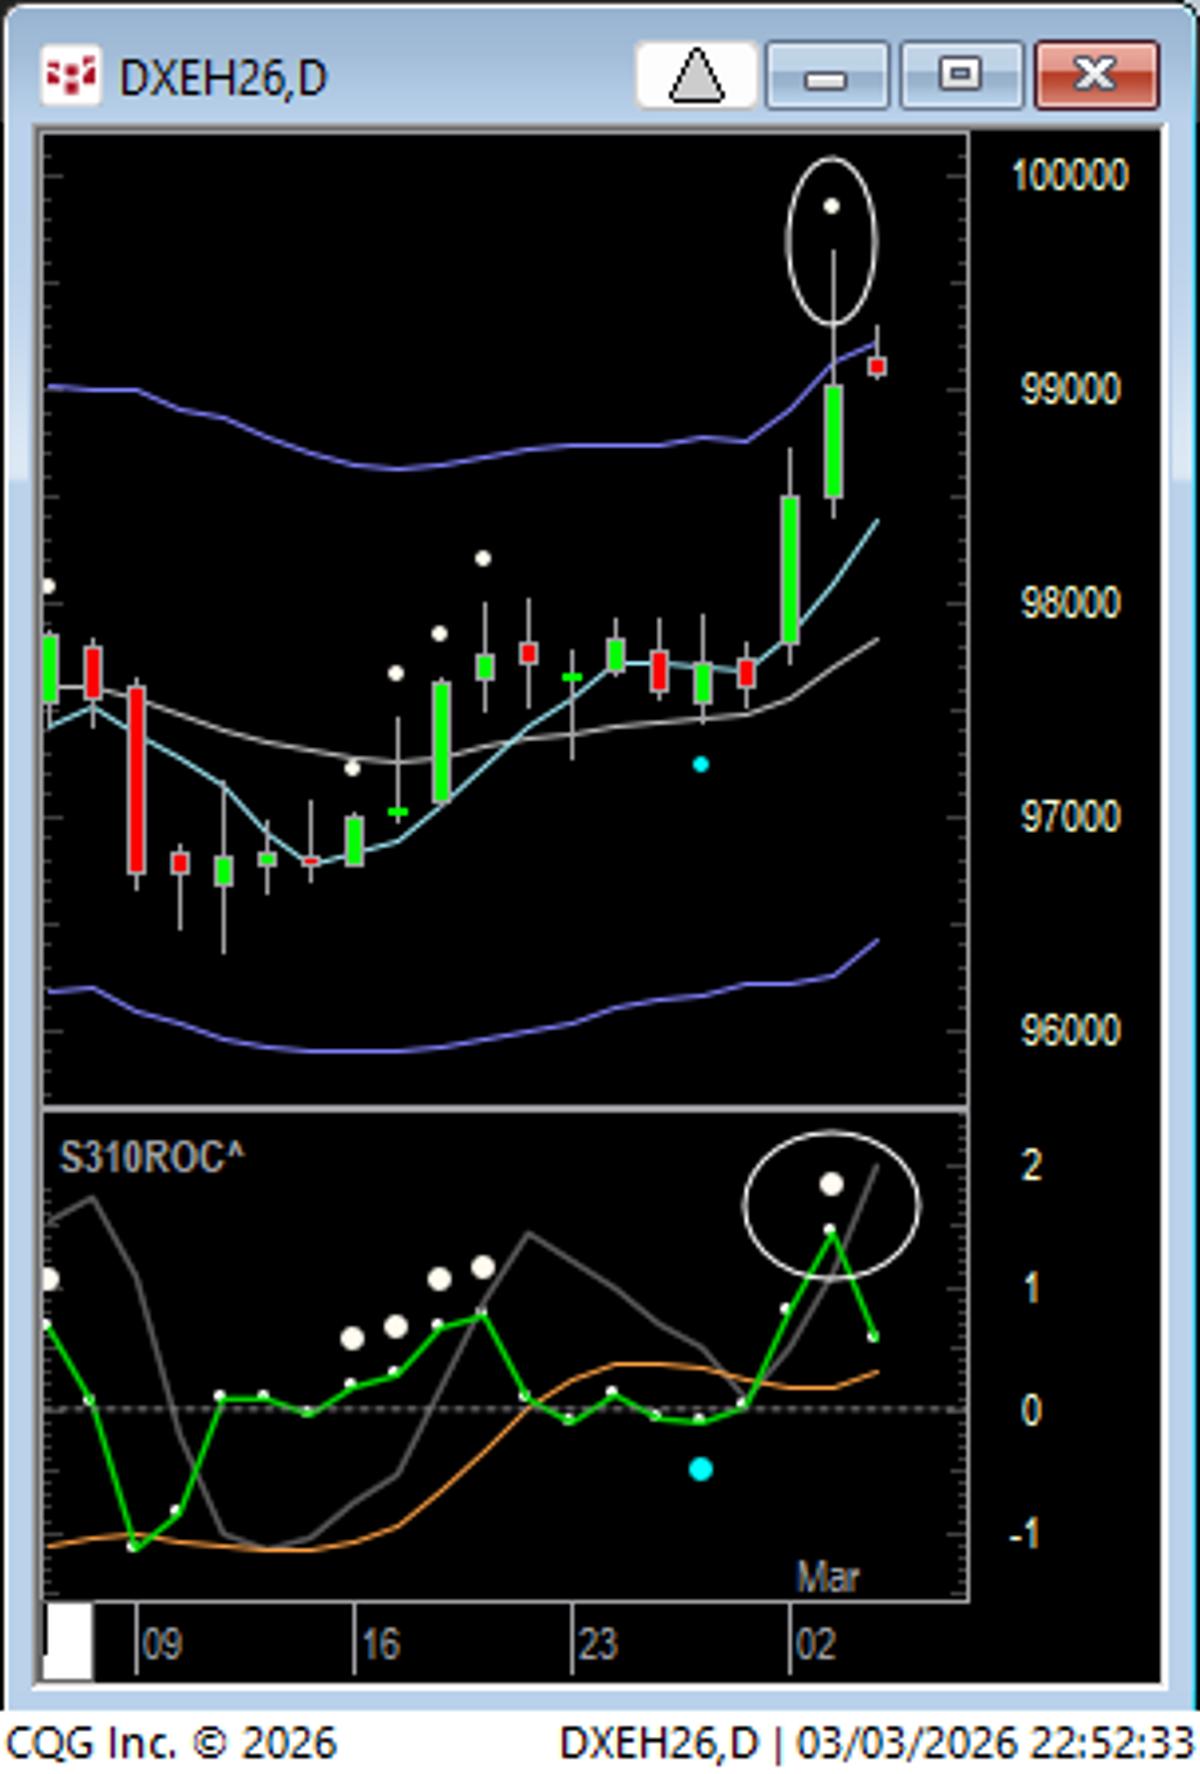
$ had quite the buying climax range expansion outside KC (Keltner Channel) which I posted in the morning. It already sold down into Asia opening. Wed. it may fill out the tail. https://t.co/SASbX9Ehf1
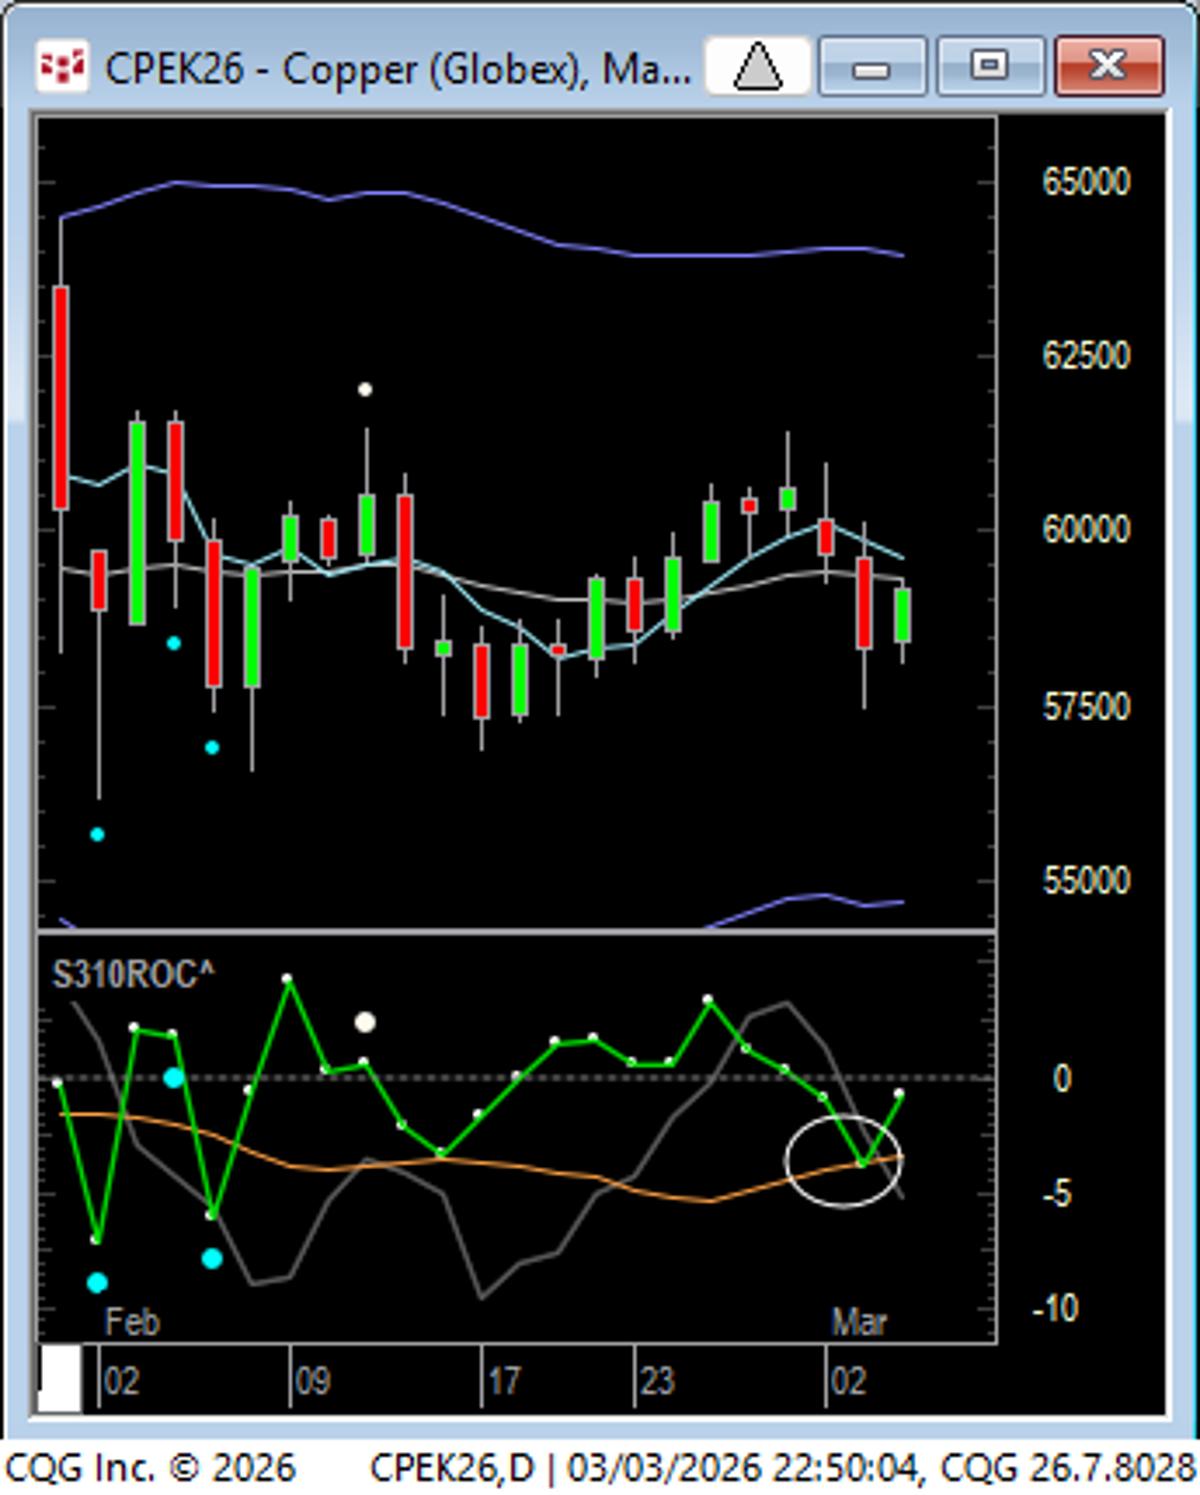
Copper: Buy Day on ROC... this market tends to have best play in evening when Asia opens. https://t.co/FzKo8M3xSH
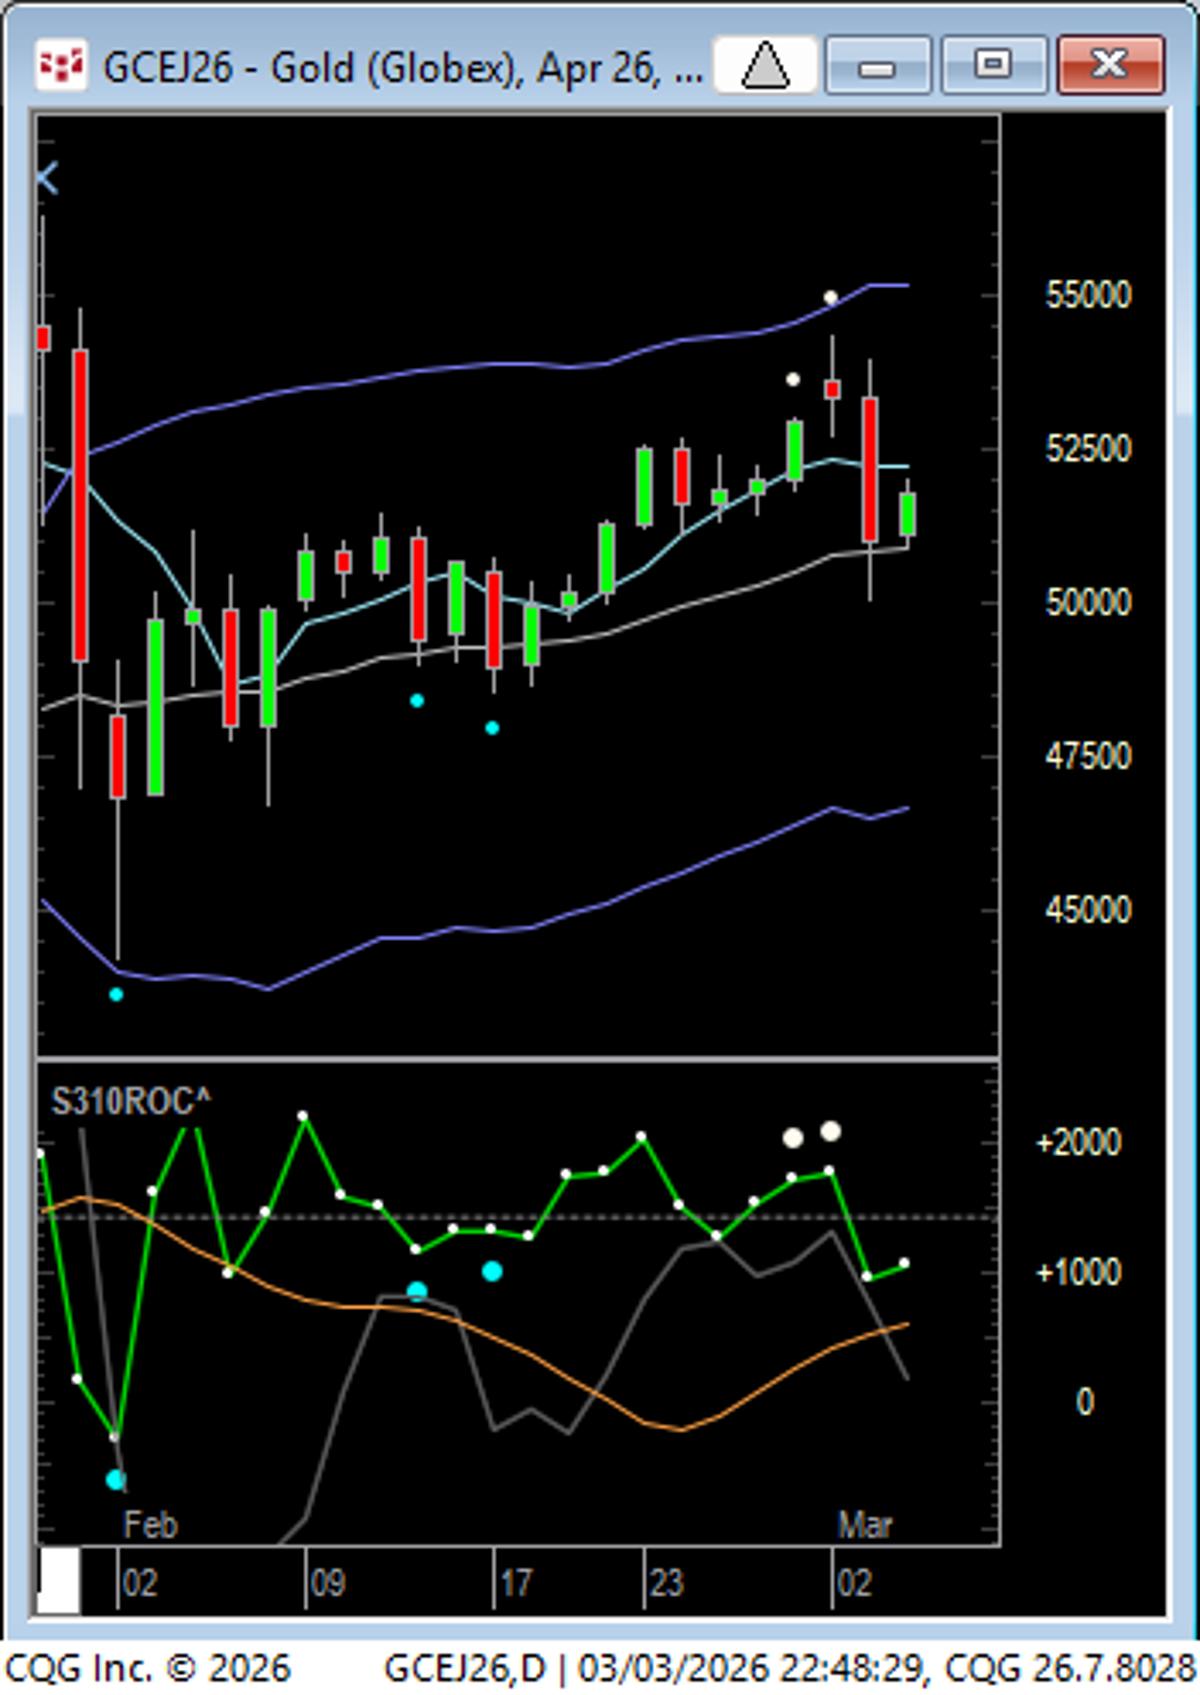
GC - Pinball Buy on close (green bar on right is start of evening session so shows initial up. ) https://t.co/aIGtwW0Ce0

US saved its markets for the day but Asia could not However India will not follow Asia - we fell before them we can even recover without them. Watch your own charts which you trade for signals https://t.co/gP7ThLndw2
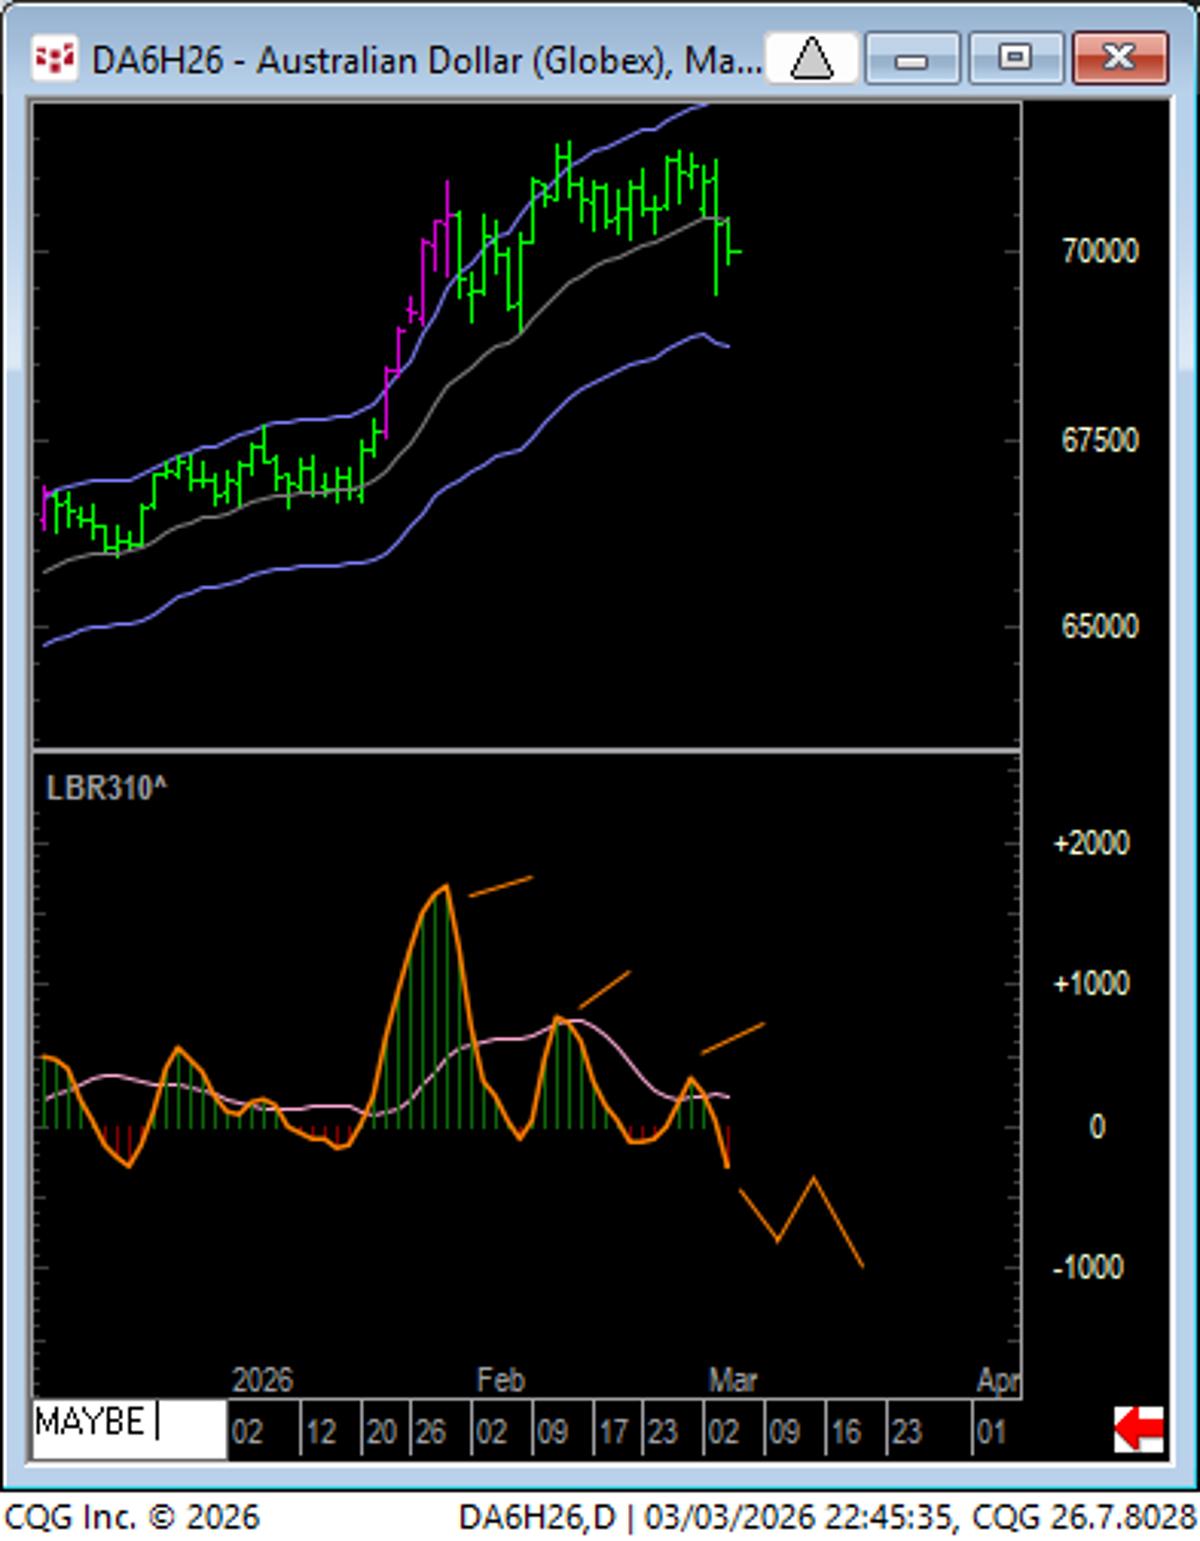
AD - 3 pushes on the daily...often see A B C rhythm on osc following three pushes https://t.co/arBkUJ9Uo2
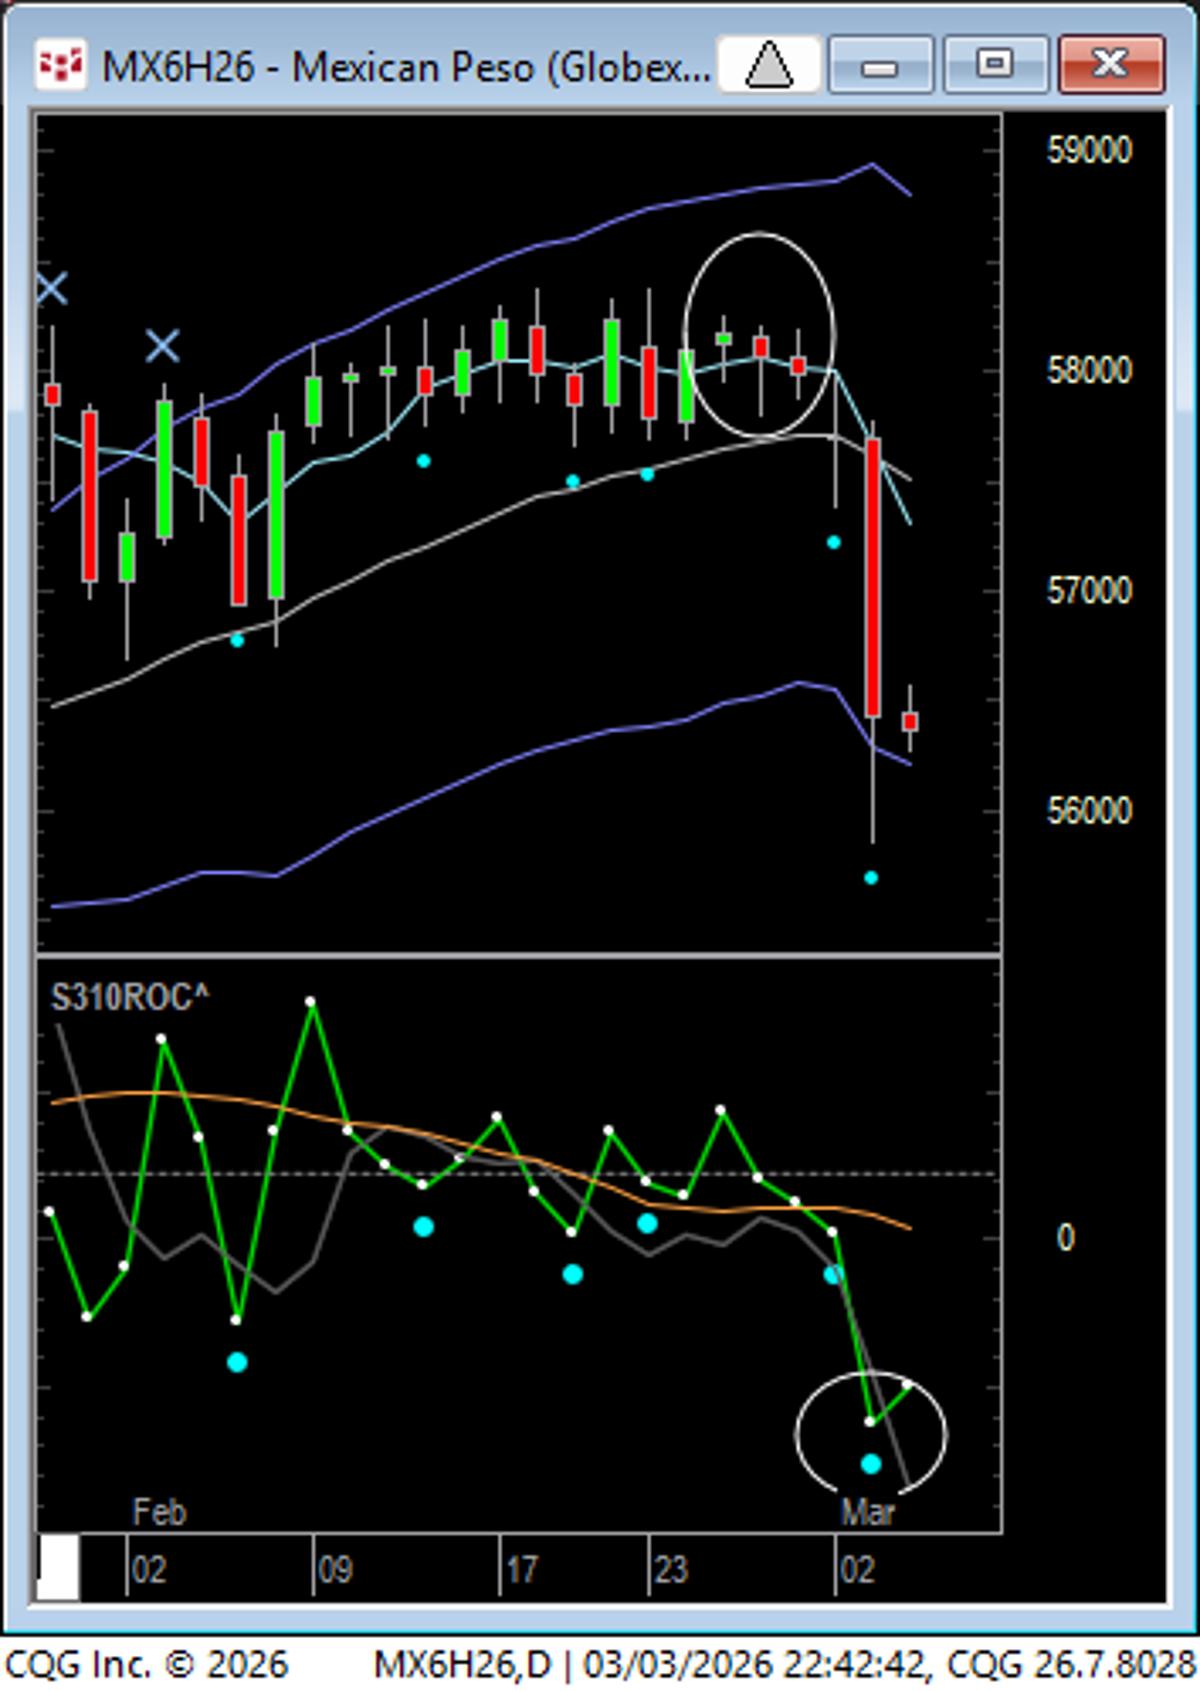
Peso - new momo lows on 2 per ROC after downside BO on Monday from 3 bar triangle. https://t.co/9h48YOGDYL

*CIRCUIT BREAKER TRIGGERED AFTER S. KOREA'S KOSDAQ PLUNGES 8% Where did you think all those crypto flows ended up https://t.co/JzbQThyUAl
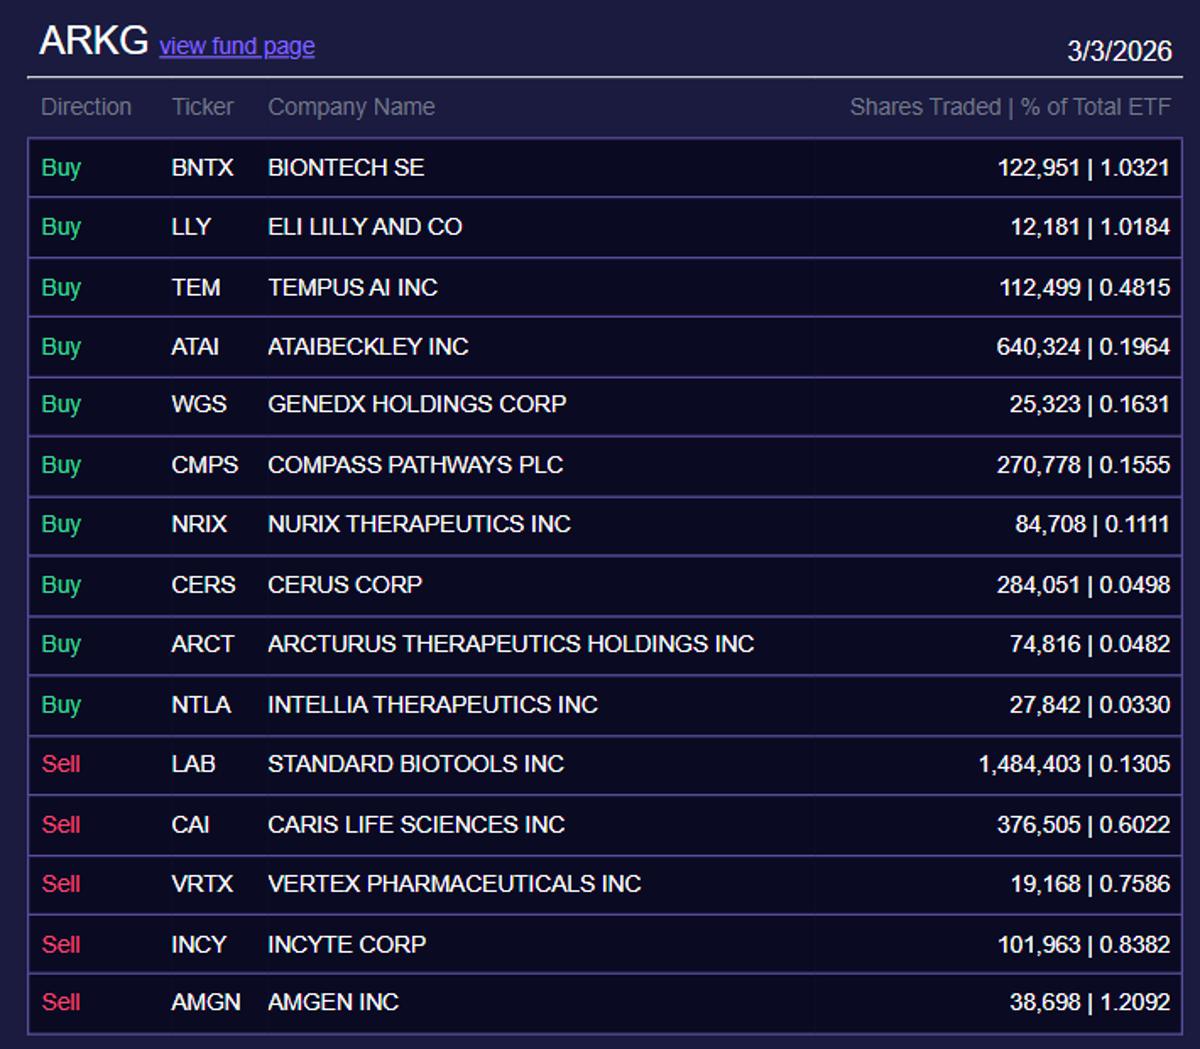
So @ARKInvest did a larger amount of trading today in their ETFs than i typically notice. Particularly large moves in $ARKG but also a lot of trading in $ARKK. $ARKG added over 1% in $BNTX and $LLY while selling...
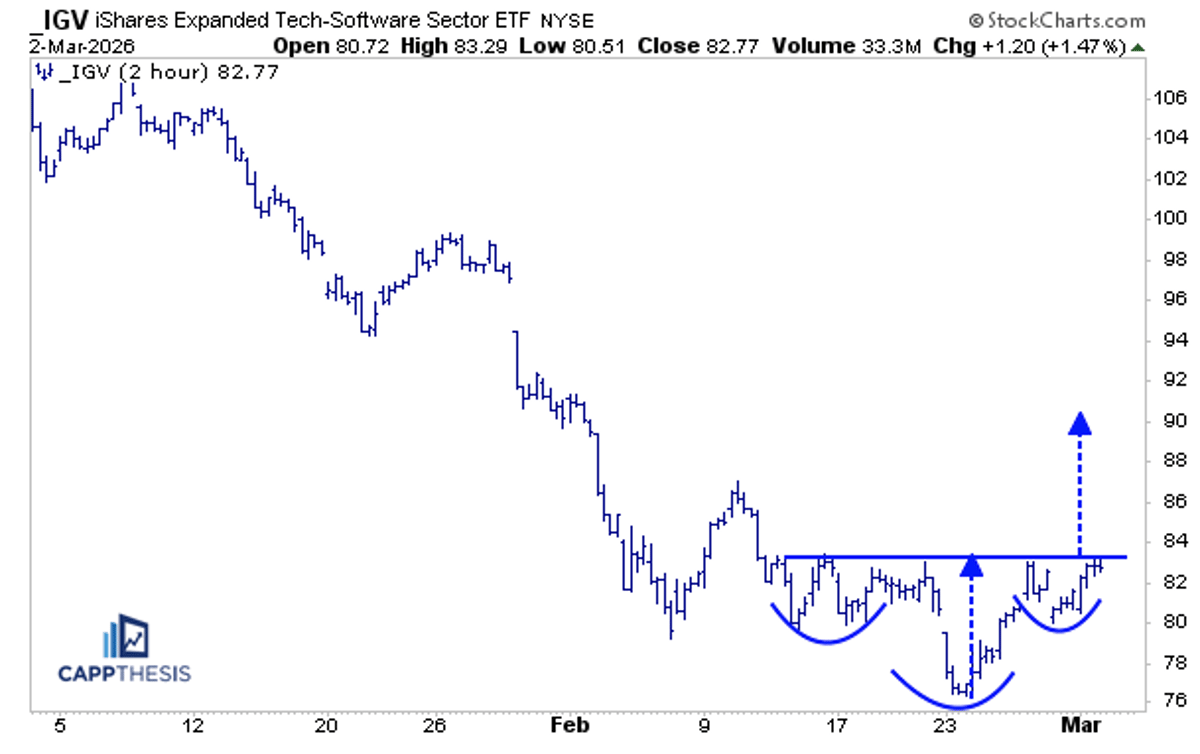
Software up more than 1% today. @FrankCappelleri shared this potentially bullish pattern this morning. So far, so good. https://t.co/qlwNHx7eF2
Odd stat of the day: the $SPX has closed ABOVE its intra-day midpoint in 11/12 days. It's down a net 50 bps over that time span.
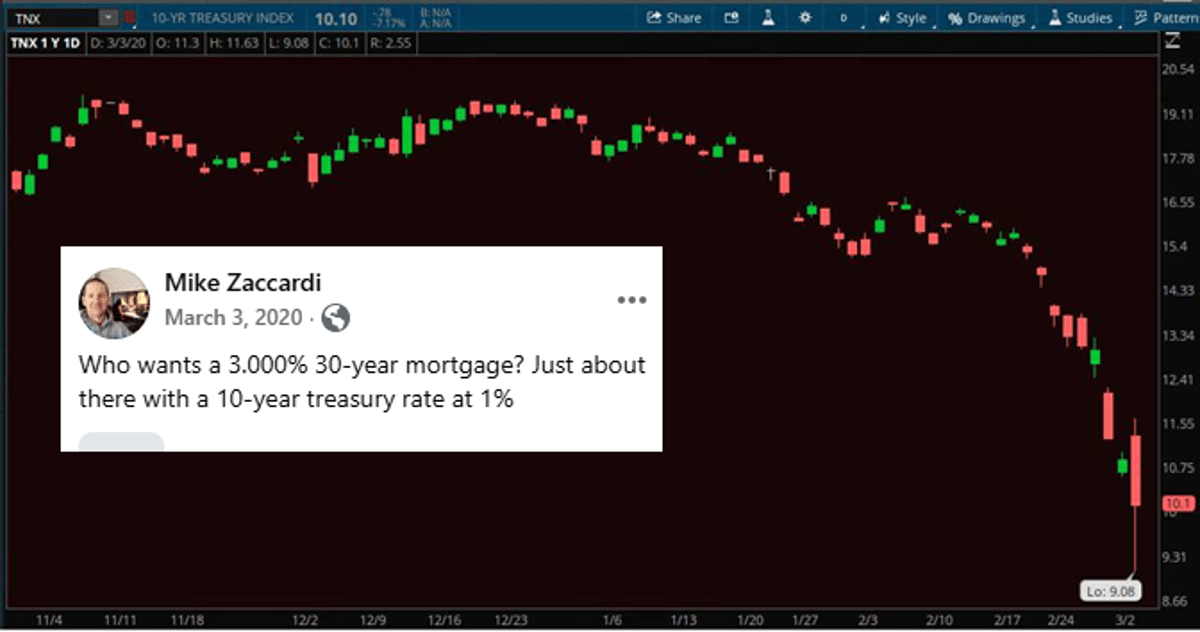
#OTD 2020... back when I had a real job and only TOS ... 10yr breaks 1% for the first time https://t.co/CyW5CAAfCa
The "Fog of War" hit the tape today. 🌫️ $SPX salvaged support at 6800 after a brutal open, but the $VIX spiking to 28 is a major red flag. I’m also honoring the late legend John Murphy and applying...
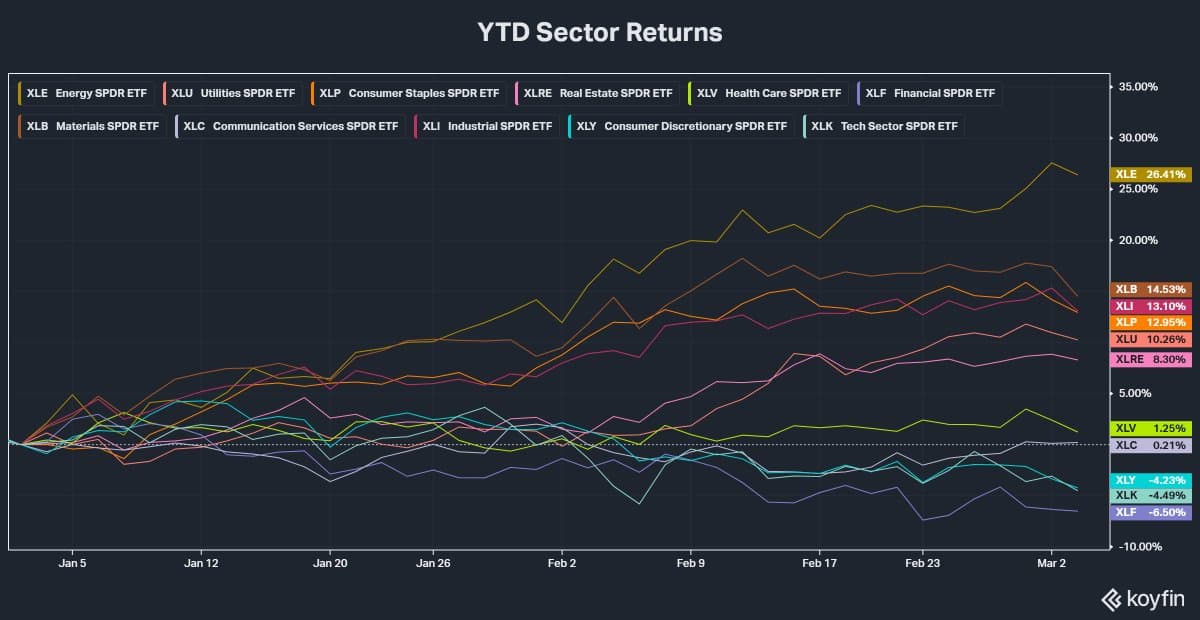
$SPY - The part that's tough for me is the defensive tilt that's taken place this year in the S&P 500. It's easier to "ignore" these days as "event driven" etc. when that isn't the case but with $XLK, $XLF,...
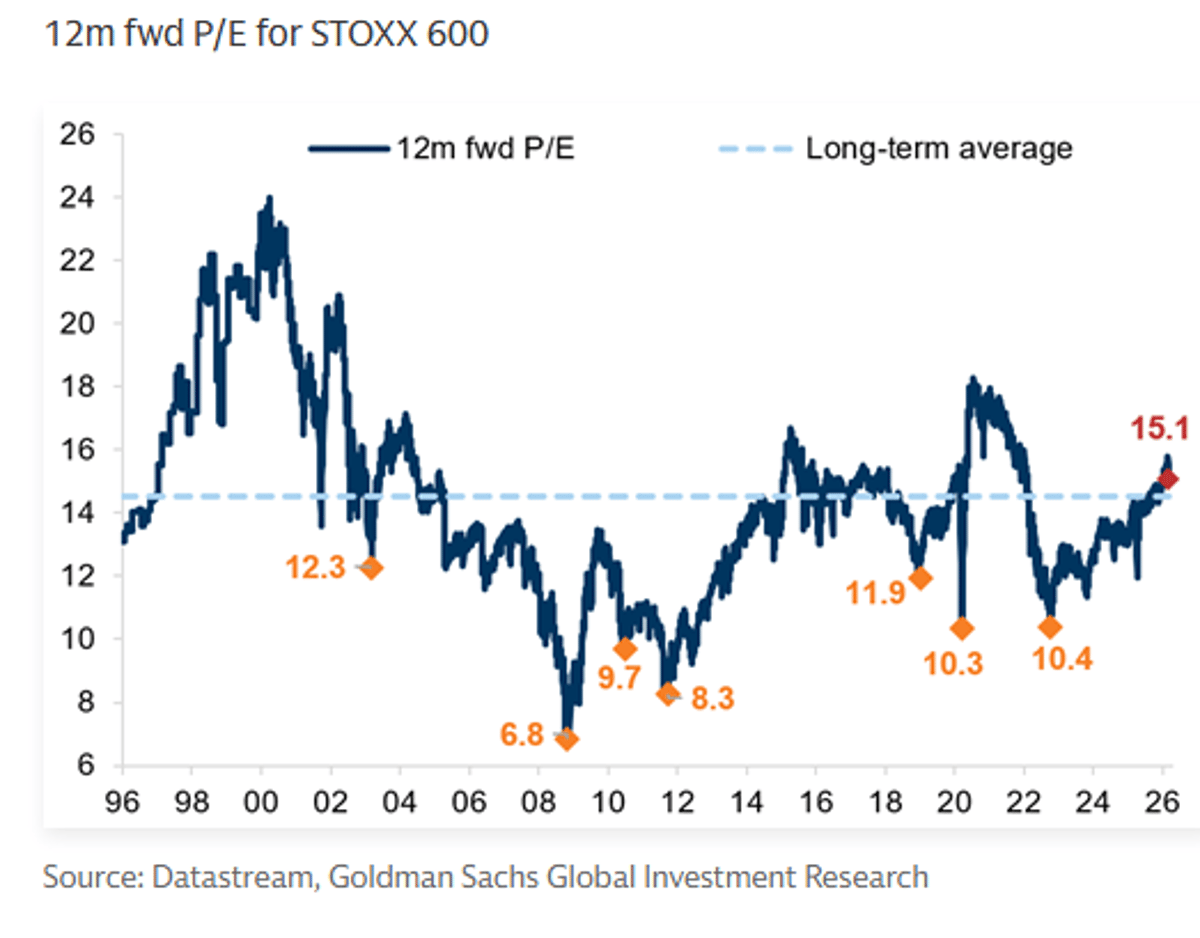
GS Europe: Europe has re-rated in recent years Sectors with high US exposure and a low beta to the market should be mostly immune to recent shocks https://t.co/g2Fd3kpcA5
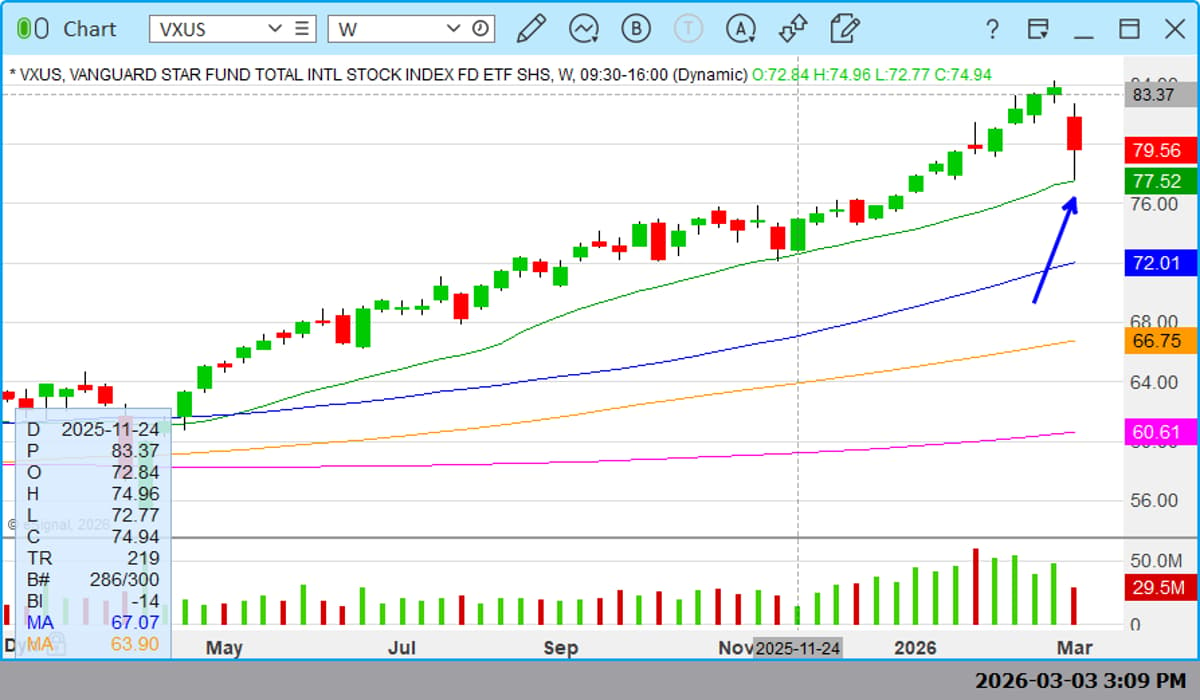
$VXUS international ETF clean hold on 20sma weekly, again, clean line in sand for your radar and natural stop for swings under that line. https://t.co/RWEeeRI0sD
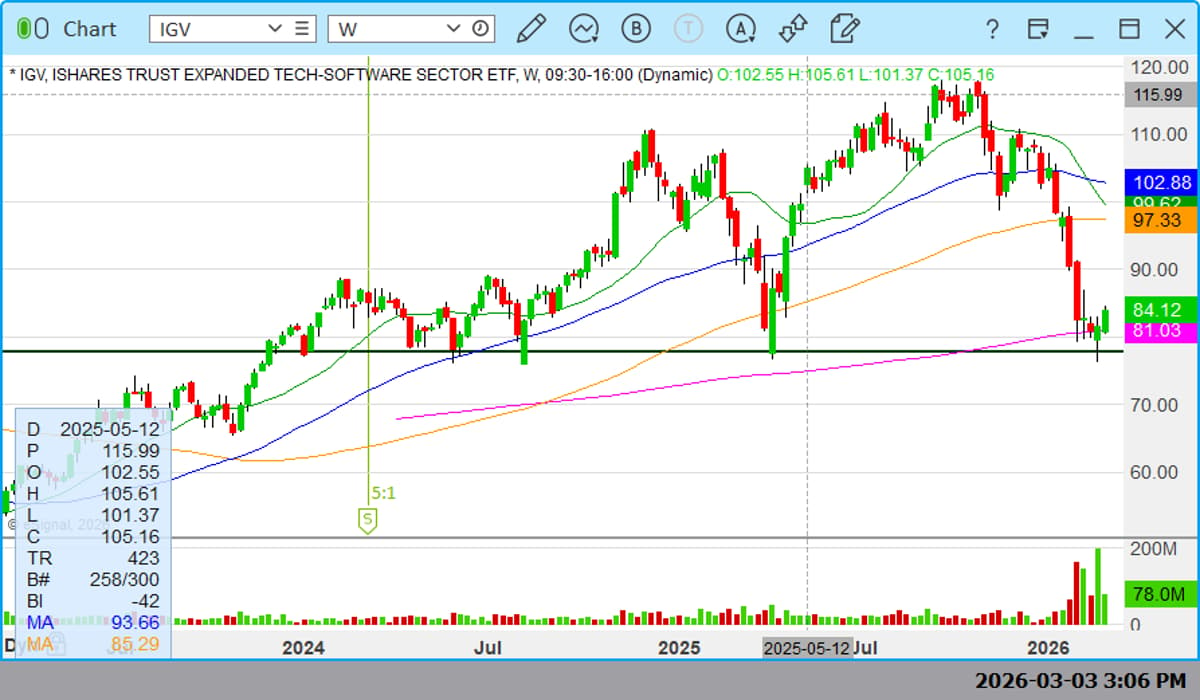
Software sold off first, so stands to reason it would try to bottom first. Solid action around the 200sma-- very clear line in sand for medium term swings. $IGV https://t.co/zcHdivFd3y
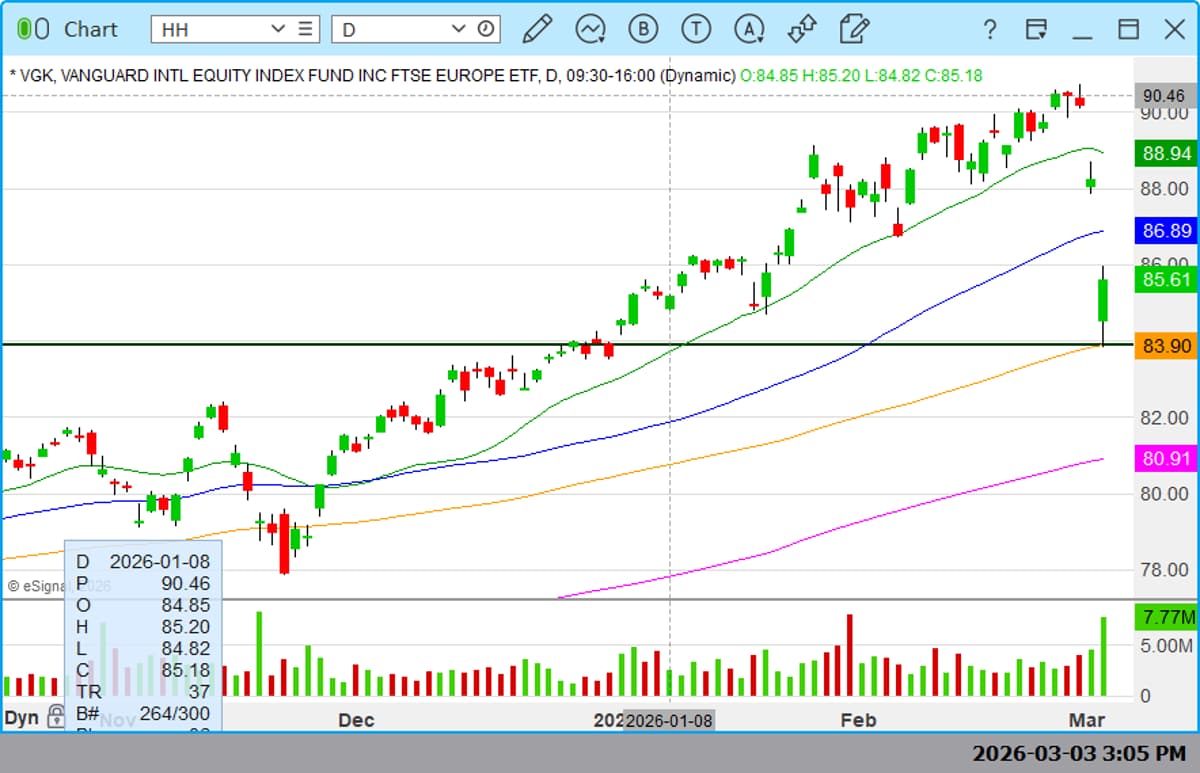
Interesting spot $VGK (Europe) -- solid reversal on clean support. 84 line in sand. https://t.co/YeH5D1pF0E
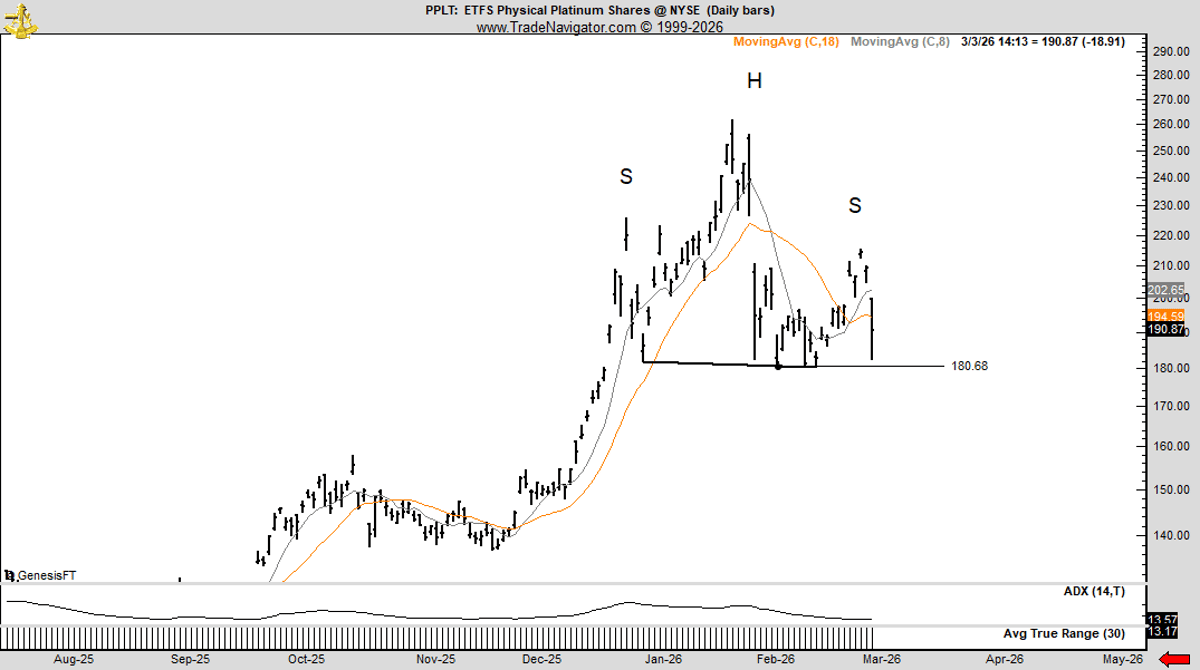
Charts can always morph, but it looks to me that the Platinum party is about to be interrupted by a head and shoulders pattern. I am not allowing replies on this because I have no interest in reading what you...

Rooting for the immediate v shaped recovery in KOSPI/Nikkei but, in my experience, violent deleveraging events are seldom limited to a single session. Held off on any aggressive dip buying today.
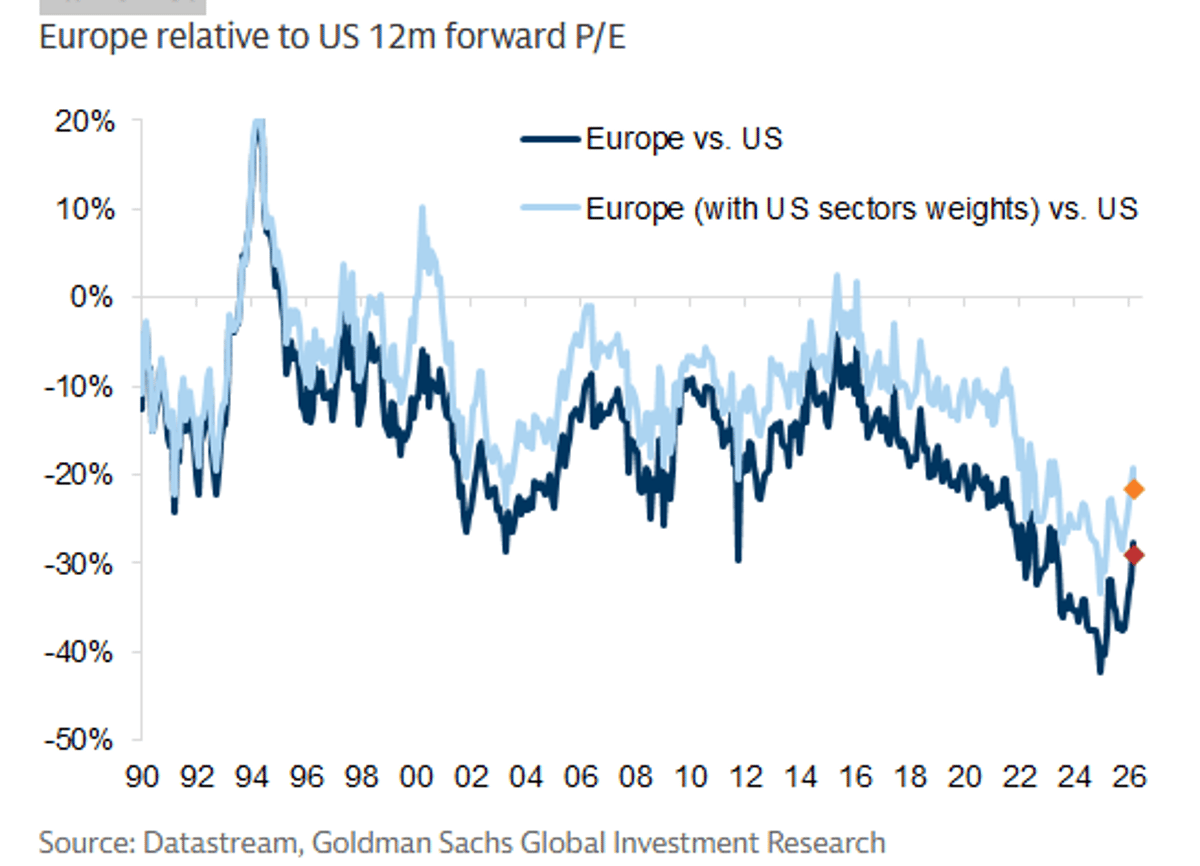
GS: While Europe remains on a discount to the US, this discount has narrowed https://t.co/MWh0XnVJBZ
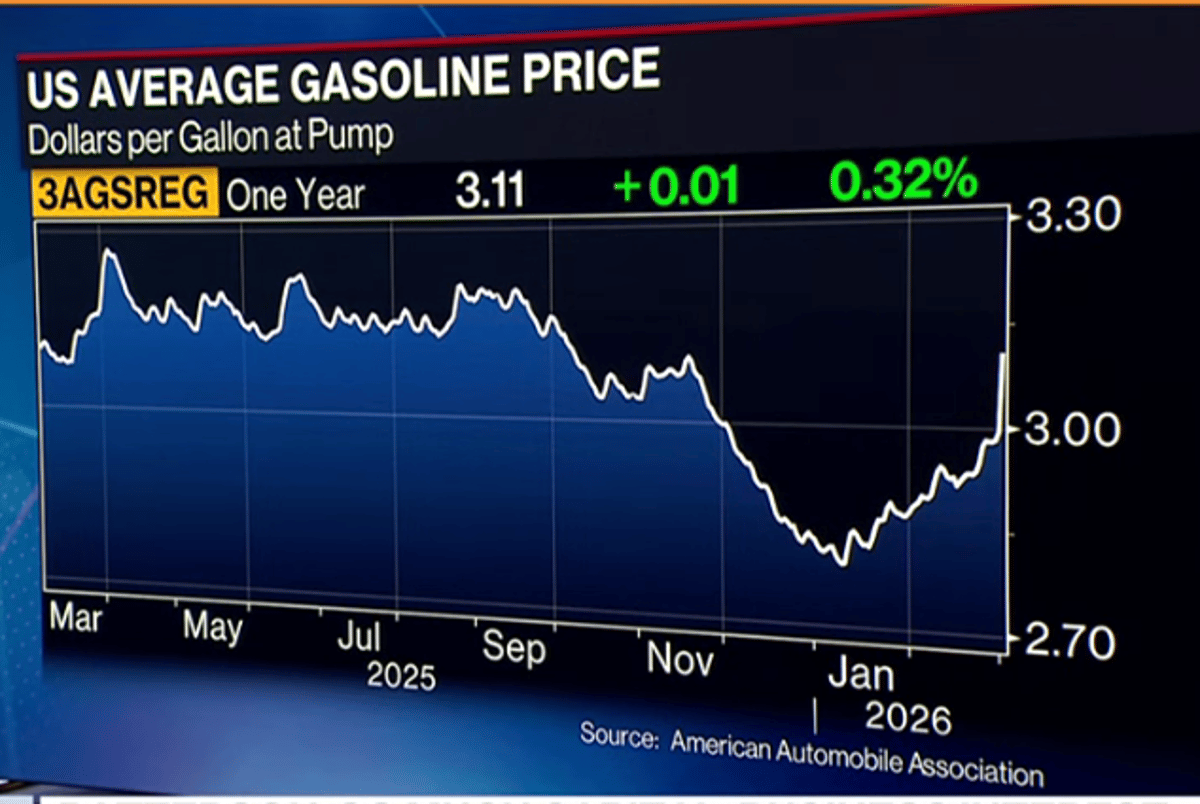
Gasoline prices... remember the March-April RBOB contract roll was +25 cents on its own https://t.co/WAOPFvCQdz

$CRCL (per request) I honestly can't decide if this is a dead cat bounce in a downtrend or the start of a new bull trend. Wish I had a better read. https://t.co/PD7HPiHYFV

#FTSE250 big Down Candle. RSI 44 bit off Neutral. Could be lining up 13/21 day EMA Bear Cross. Closed below Bottom Bollinger Band which is unstable.

$DG (per request) This chart is a great example of good analysis and bad execution. I sold way too early. Up 50% from that support. Noted. Lesson learned. https://t.co/3gkMNvaqn7

$FCX (per request) Beautiful chart. Clean price action. Measured upside target is closer to $80 https://t.co/w3xHEH085E
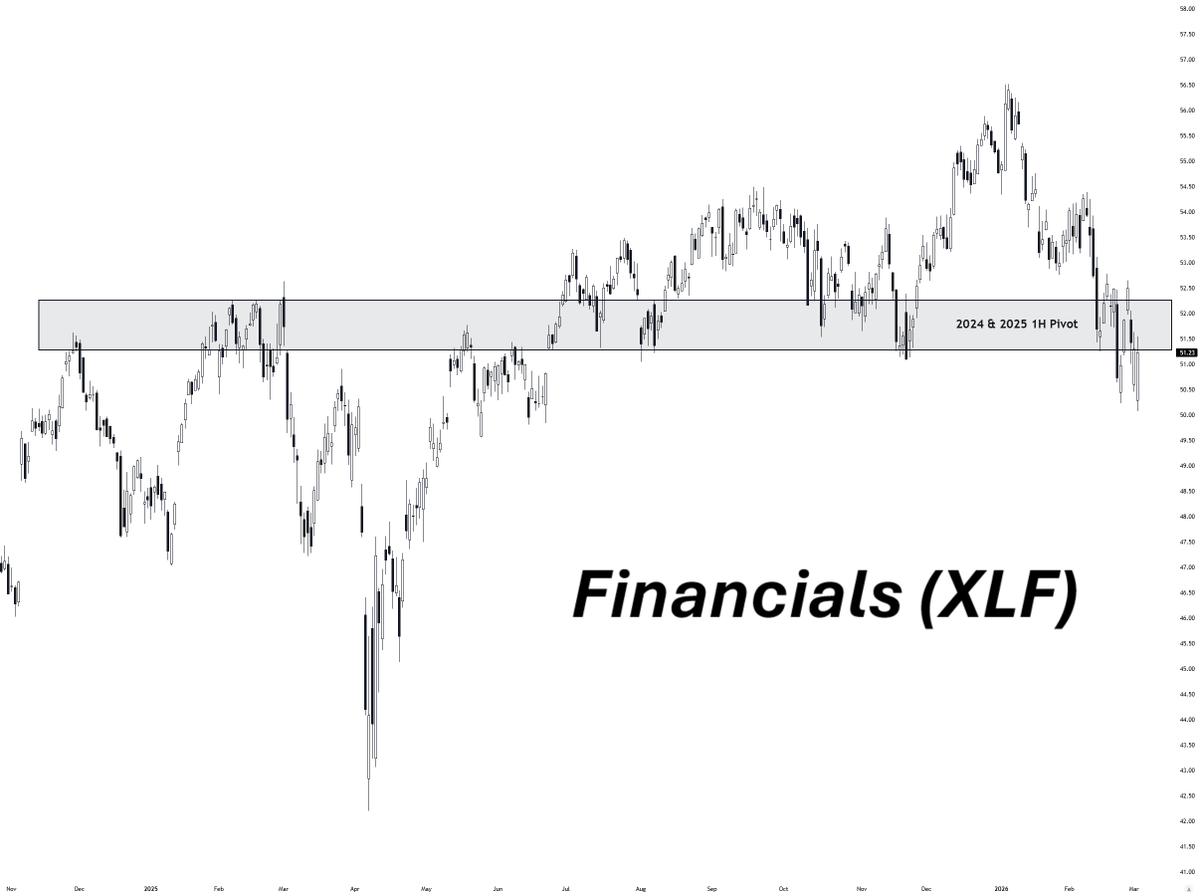
Financials rally back to the underbelly of the 2024 and 2025 1H pivot. So far it’s acting like a magnet... $XLF https://t.co/jXBzQnKMxZ

$HYPE (per request) Followed through on the mini spring I posted earlier. But now just struggling with that pesky 99smma resistance. not a good sign if it can't break https://t.co/pa5x3GyItL

BofA: We forecast a below-consensus Feb NFP print of 35k (private: 45k). The u-rate should remain at 4.3% Fed response: wait and watch stance under Powell https://t.co/qQ28IUZLsk

$OKLO (per request) Doesn't look great but doesn't look terrible locally. Mostly just hanging in the middle of nowhere. Has an untapped support below. I'd be more interested in buying the yellow line reclaim if it does something like this. https://t.co/1Wtg9vINKt

$PSX (per request) Looks like a nice base breakout and should see continuation. Levels noted in chart. One more resistance needed to take out for more price discovery. https://t.co/YmKPMsfiHV

$NVO (per request) Has lost all monthly and weekly support and just broke down from a harsh range. Looks like a continuation pattern to the downside unfortunately. Needs to reclaim this range as a starter for any bullish scenario. https://t.co/G49aFKlG3c
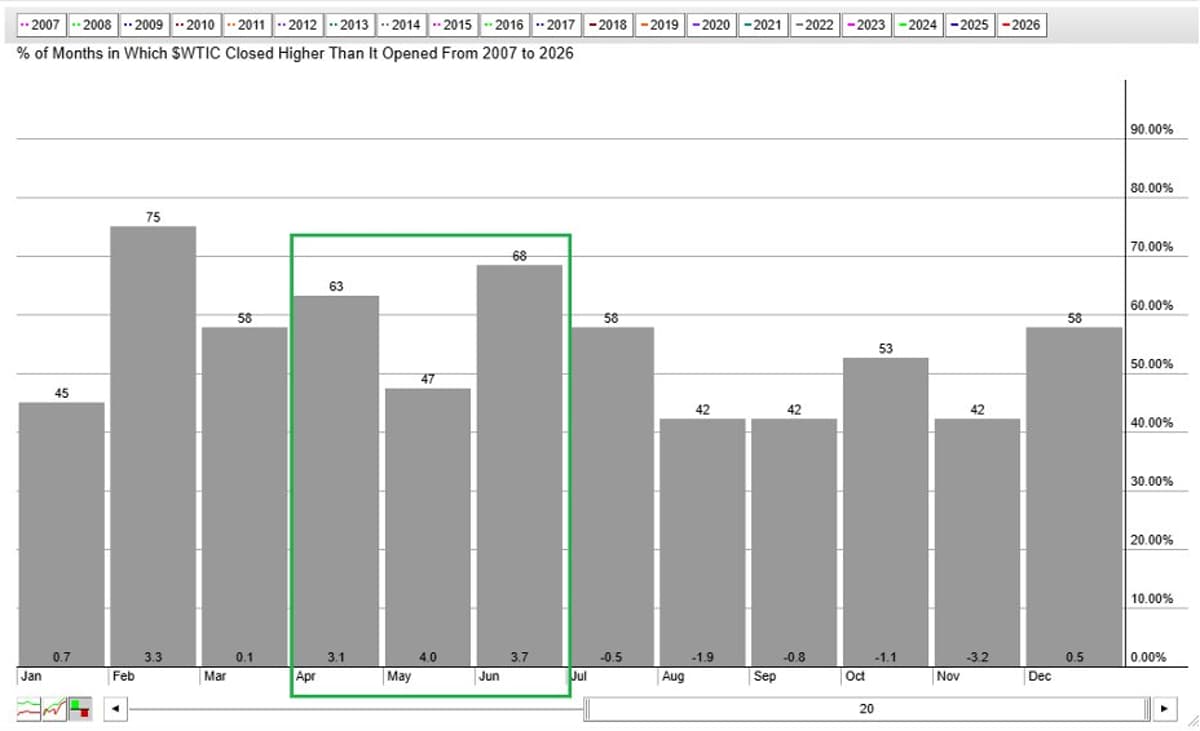
We are nearing oil's most bullish time of year. $CL_F $USO $WTIC More from me on @stockcharts: https://t.co/2c4CuouCWe https://t.co/o1k2jBw7MM
there are 32 large-cap stocks hitting the 52-week new highs list today... there are 14 large-cap stocks hitting the 52-week new lows list... #FinanciallyINsync #HighLowShow #marketUpdate #investing
there are 23 stocks in the $QQQ that are +4%+ from their intraday lows... https://t.co/SGN4Kt6jhn
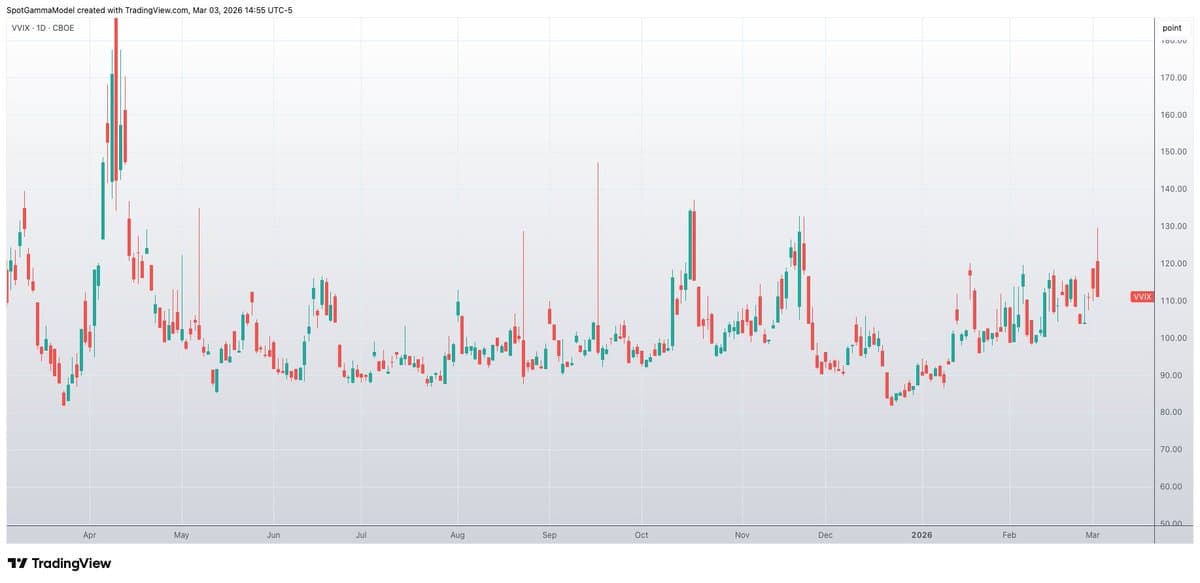
VVIX >125 this AM correlates with pretty positive forward returns >=5 days out https://t.co/FCX5fvZMOi https://t.co/Tn8krhl4YQ

$BAC showing signs of reversing. I have some in my investment/spec/gamble account. None in trade account.