Know What's Happening in Stock Trading
Know What's Happening in Stock Trading

Moving Average Crossover Strategy Shows 6.9% Annual Return in Backtest
The moving average crossover approach generates mechanical buy or sell signals when a fast and a slow average intersect. Common pairings include 9/21 EMA for short‑term trades, 20/50 SMA for swing trades, and the classic 50/200 SMA Golden Cross for long‑term trends. Backtests of the Golden Cross from 1960 to present delivered a 6.9% annual return.

The Indicator of the Day highlights the NASDAQ Eakle Advance‑Decline Index, a breadth metric that compares the number of advancing versus declining stocks on the Nasdaq exchange. Recent chart data shows the index climbing even as the Nasdaq Composite has flattened, suggesting underlying strength despite broader market stagnation. The divergence underscores the index’s role as an early‑warning signal for market direction. Investors monitor the Eakle ADI to assess the health of Nasdaq’s internal momentum beyond price movements.

“We see no reason to actively add equity exposure at this time as risk/reward will improve from either price action or a path to de-escaltion forming:” Citi’s Kaiser. The oil VIX reached its highest level other than during COVID since...
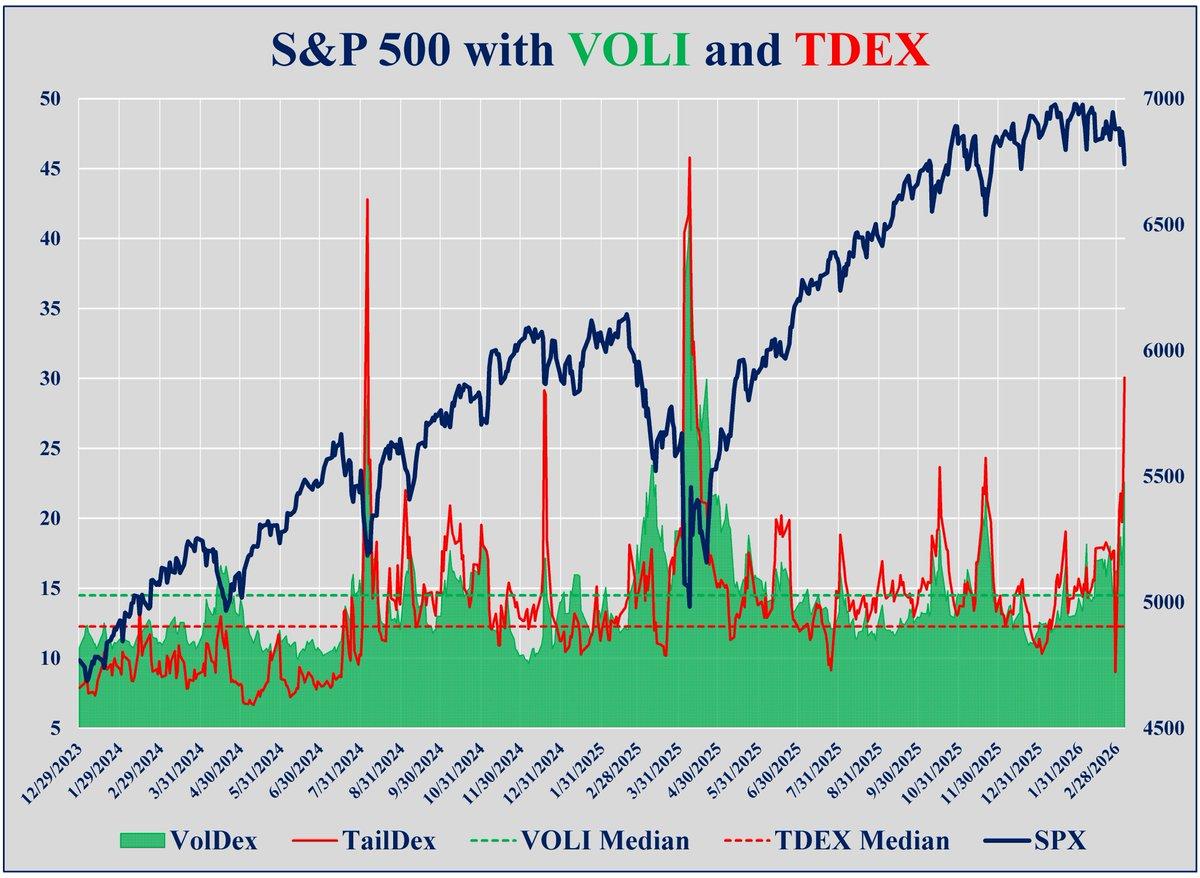
OK. Pending apocalypse or local bottom? @Nations_Indexes TailDex ($TDEX aka crash put) hit 30 on Friday with $VOLI (ATM vol) at 22.58. TDEX level is 97th percentile and spread above VOLI also 97th percentile. You don't need to look far...

USDCAD encountered firm resistance around the 1.3750 mark, prompting a pullback that resulted in its second consecutive weekly decline. The price weakness coincided with escalating strikes across the Middle East, which have amplified global risk aversion. An Elliott Wave assessment...

The Weekly Compass is Live In a week defined by high volatility, our systematic approach delivered results: 8 of 9 high-probability setups reached their targets 🎯. Access the new weekly plan and a neutral volatility assessment. https://open.substack.com/pub/smartreversals/p/tension-at-the-gate

$TSLA - Found support at the yearly pivot for the 2nd time in the last 5 weeks. A weekly close below 387 will confirm that it made a major top in December, but I don't expect it to happen next...

Microsoft rallied 4.1% amid AI optimism, while Apple fell 2.5% and Alphabet dropped 4.25% as macro and legal pressures weighed on the Magnificent 7. The S&P 500 slipped 1.98% and the Nasdaq 100 fell 1.24% for the week, with the VIX spiking 27.5%...

With vol high/skew high but OTM calls also high and with equities in a minor drawdown those with undiversified max long U.S. equity portfolios are whipping around "options" trade ideas as the solution. Looking for ways to hedge. ...
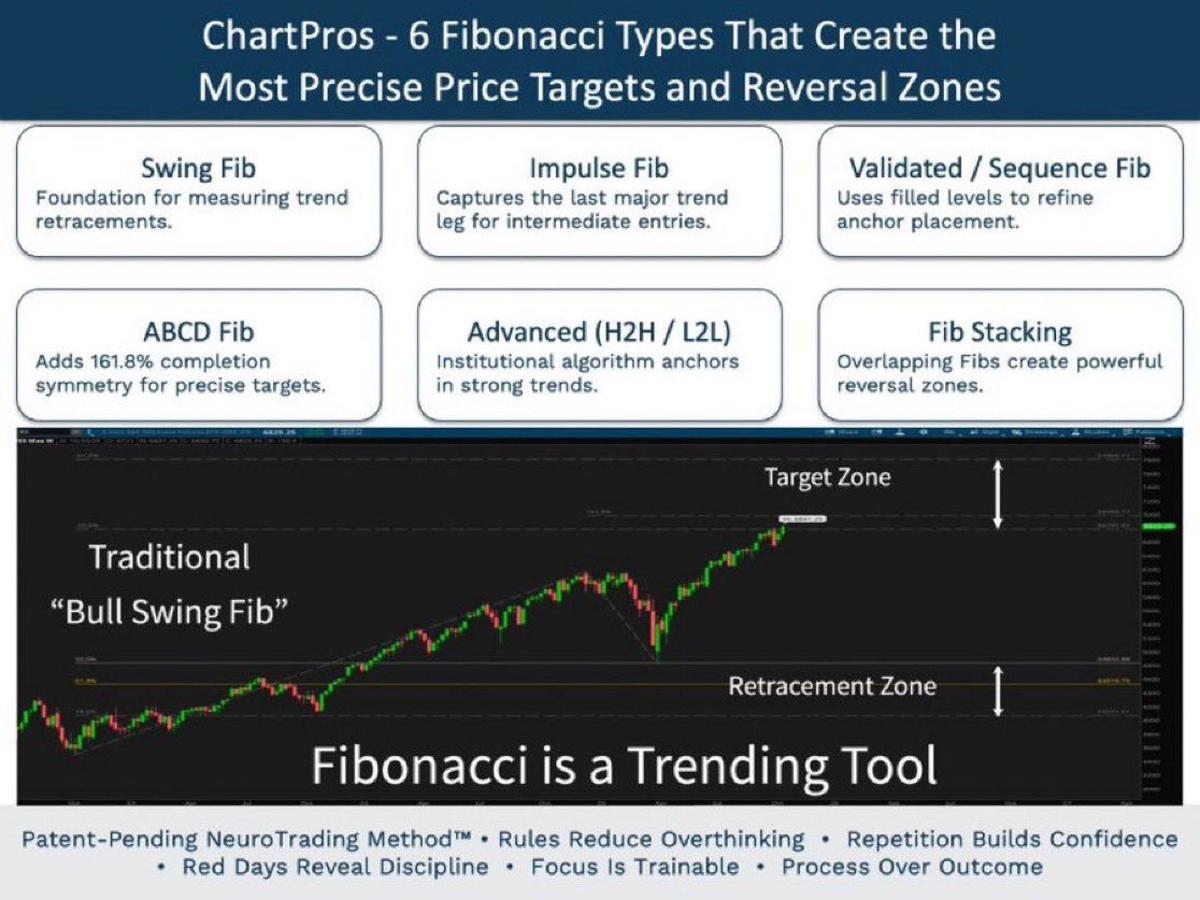
Here’s a link below to a FREE Fibonacci Trading Strategy Guide (ebook): 📈📉 Learn the 6 Fibonacci Pattern Types that Create the Most Precise Price Levels, Targets, and Reversal Zones for traders. Click here: ⬇️ https://t.co/62UAf4L9jv Discover the 5 types that aren't...

ARK Innovation ETF (ARKK) is flashing a tactical "sell" as its 50‑day moving average fell below the 200‑day line. The fund’s 47% annualized volatility and an 81% peak drawdown make any allocation above 10% highly speculative. Additionally, the discretionary "trim...

MeCURE just released their FY 2025 results and looks good on the surface. But please do your due diligence. Meristem projects a 49+% upsurge - N91 from current price. Will you be buying MeCURE this week?

Liquidity Grab is one of the most powerful moves in the market. Price sweeps liquidity above the highs, traps breakout traders, and then reverses with momentum. Smart traders don’t chase the move. They wait for the liquidity to be taken and...

The Sunday Stalk List | Ep. 39 Punches were landed this week, and not by the bulls.. https://t.co/JwYFveywfv

While positioning clients long VIX & Oil, we had another great play past two weeks: My call for Hardware Into Software Rotation 😉 Have a look 👀🤩😻 https://t.co/zKBn1g7m1F

🚨 BITCOIN CME GAP Current price: $67,000 CME open: $68,400 As it stands, Bitcoin will open a sizeable gap tonight https://t.co/rOL85QHEJw

Dragonfly Capital - 5 Trade Ideas for Monday: APA, Fidelity National, Fastly, Intercontinental Exchange and Ring $APA $FIS $FSLY $ICE $RNG https://t.co/bmIVUw2USa https://t.co/eLsvqsBbW9

Weekly Market Report: Between a Rock and a Hard Place. Everything you need to know or stop paying attention to. Link in reply below. 👇 $SPY $TLT $DBC $GLD https://t.co/QdGU8J0KdM

Premium Users - Top Trade Ideas for the Week of March 9, 2026: The Best, on the blog and here https://t.co/9TMJXjTA2I
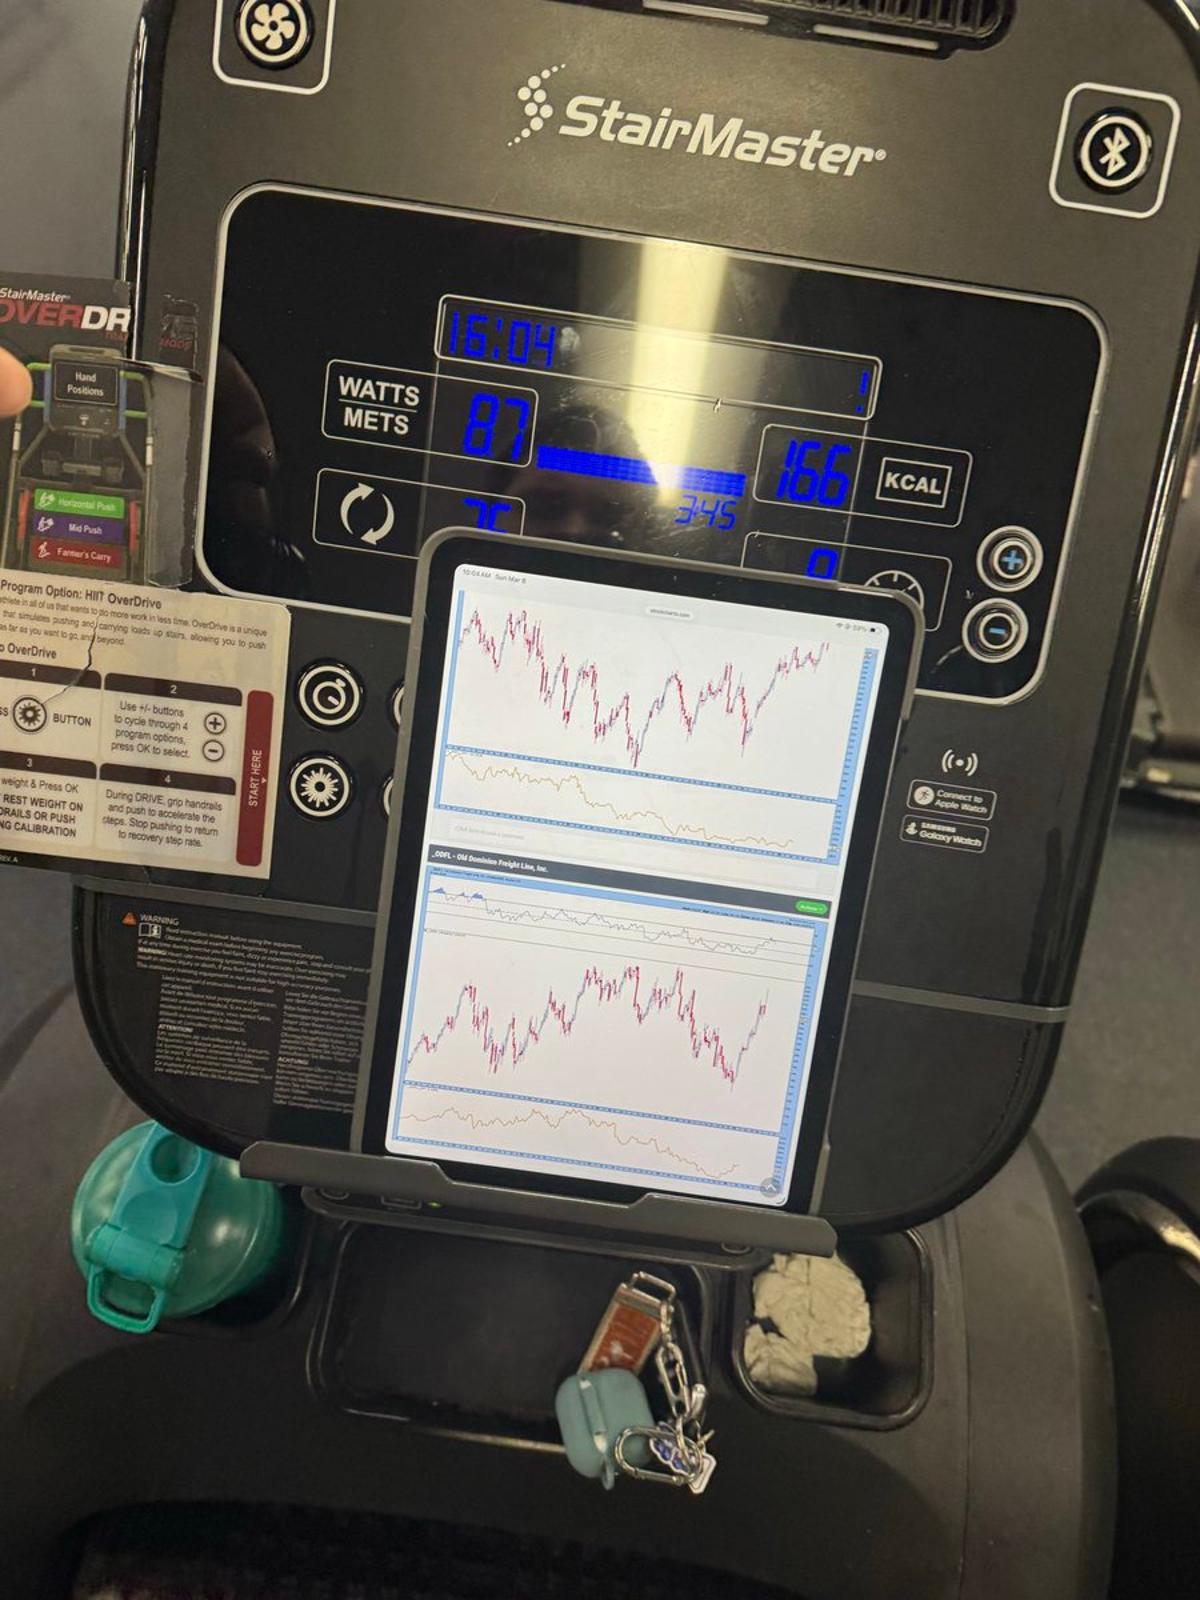
Stair Stepper and Ripping Through The S&P 500. Overwhelming majority of charts are messy. https://t.co/981sGtJSOu

The week ended the same way it started — defense. $SPY 680 held all week until Friday. Breadth, regime, posture — all red. Drones are showing some signs of life. New post is up 👇 (reply) https://t.co/F63KJoybso

Will Bitcoin Crash Again to New Lows? (the chart pattern is a clue) https://t.co/hdfg3HpG1Q [VIDEO] #bitcoin #btc

#SPX: The McClellan Oscillator has reached levels where price action begins to form a bounce, including the August 2024 Carry Trade selloff and the 2025 Tariff Crash.

If you are a long-short equity fund thinking about ways to adopt an agentic approach, I encourage you to think about building a systematic short book. 1) Good shorts tend to rhyme more than good longs and and so are fertile...

The valuation of $BTC vs. Gold isn't changed. It's still the lowest RSI in history of that particular metric, which is still: - Gold is overvalued in the short term. - #Bitcoin is undervalued in the short term. Given that there's a lower amount...

The markets aren't looking great, yet. #Bitcoin faced the first resistance test and immediately sold off. Now, there's a lot of liquidity beneath us ready to be taken before going back up. In that case, ideal moments to be accumulating positions. Some levels that...

The $VIX: $VXV ratio spiked to 1.07 on Friday. That's the biggest volatility spike since the April 2025 crash low. Last March it had an initial spike to 1.08, dropped to 0.90, then spiked to 1.27 in April, but this...

$MSFT - After almost hitting its 200 week MA last week we had a bullish reversal this week so I don't expect it to hit the 200 week MA anymore in March. An intermediate term low is probably in but...
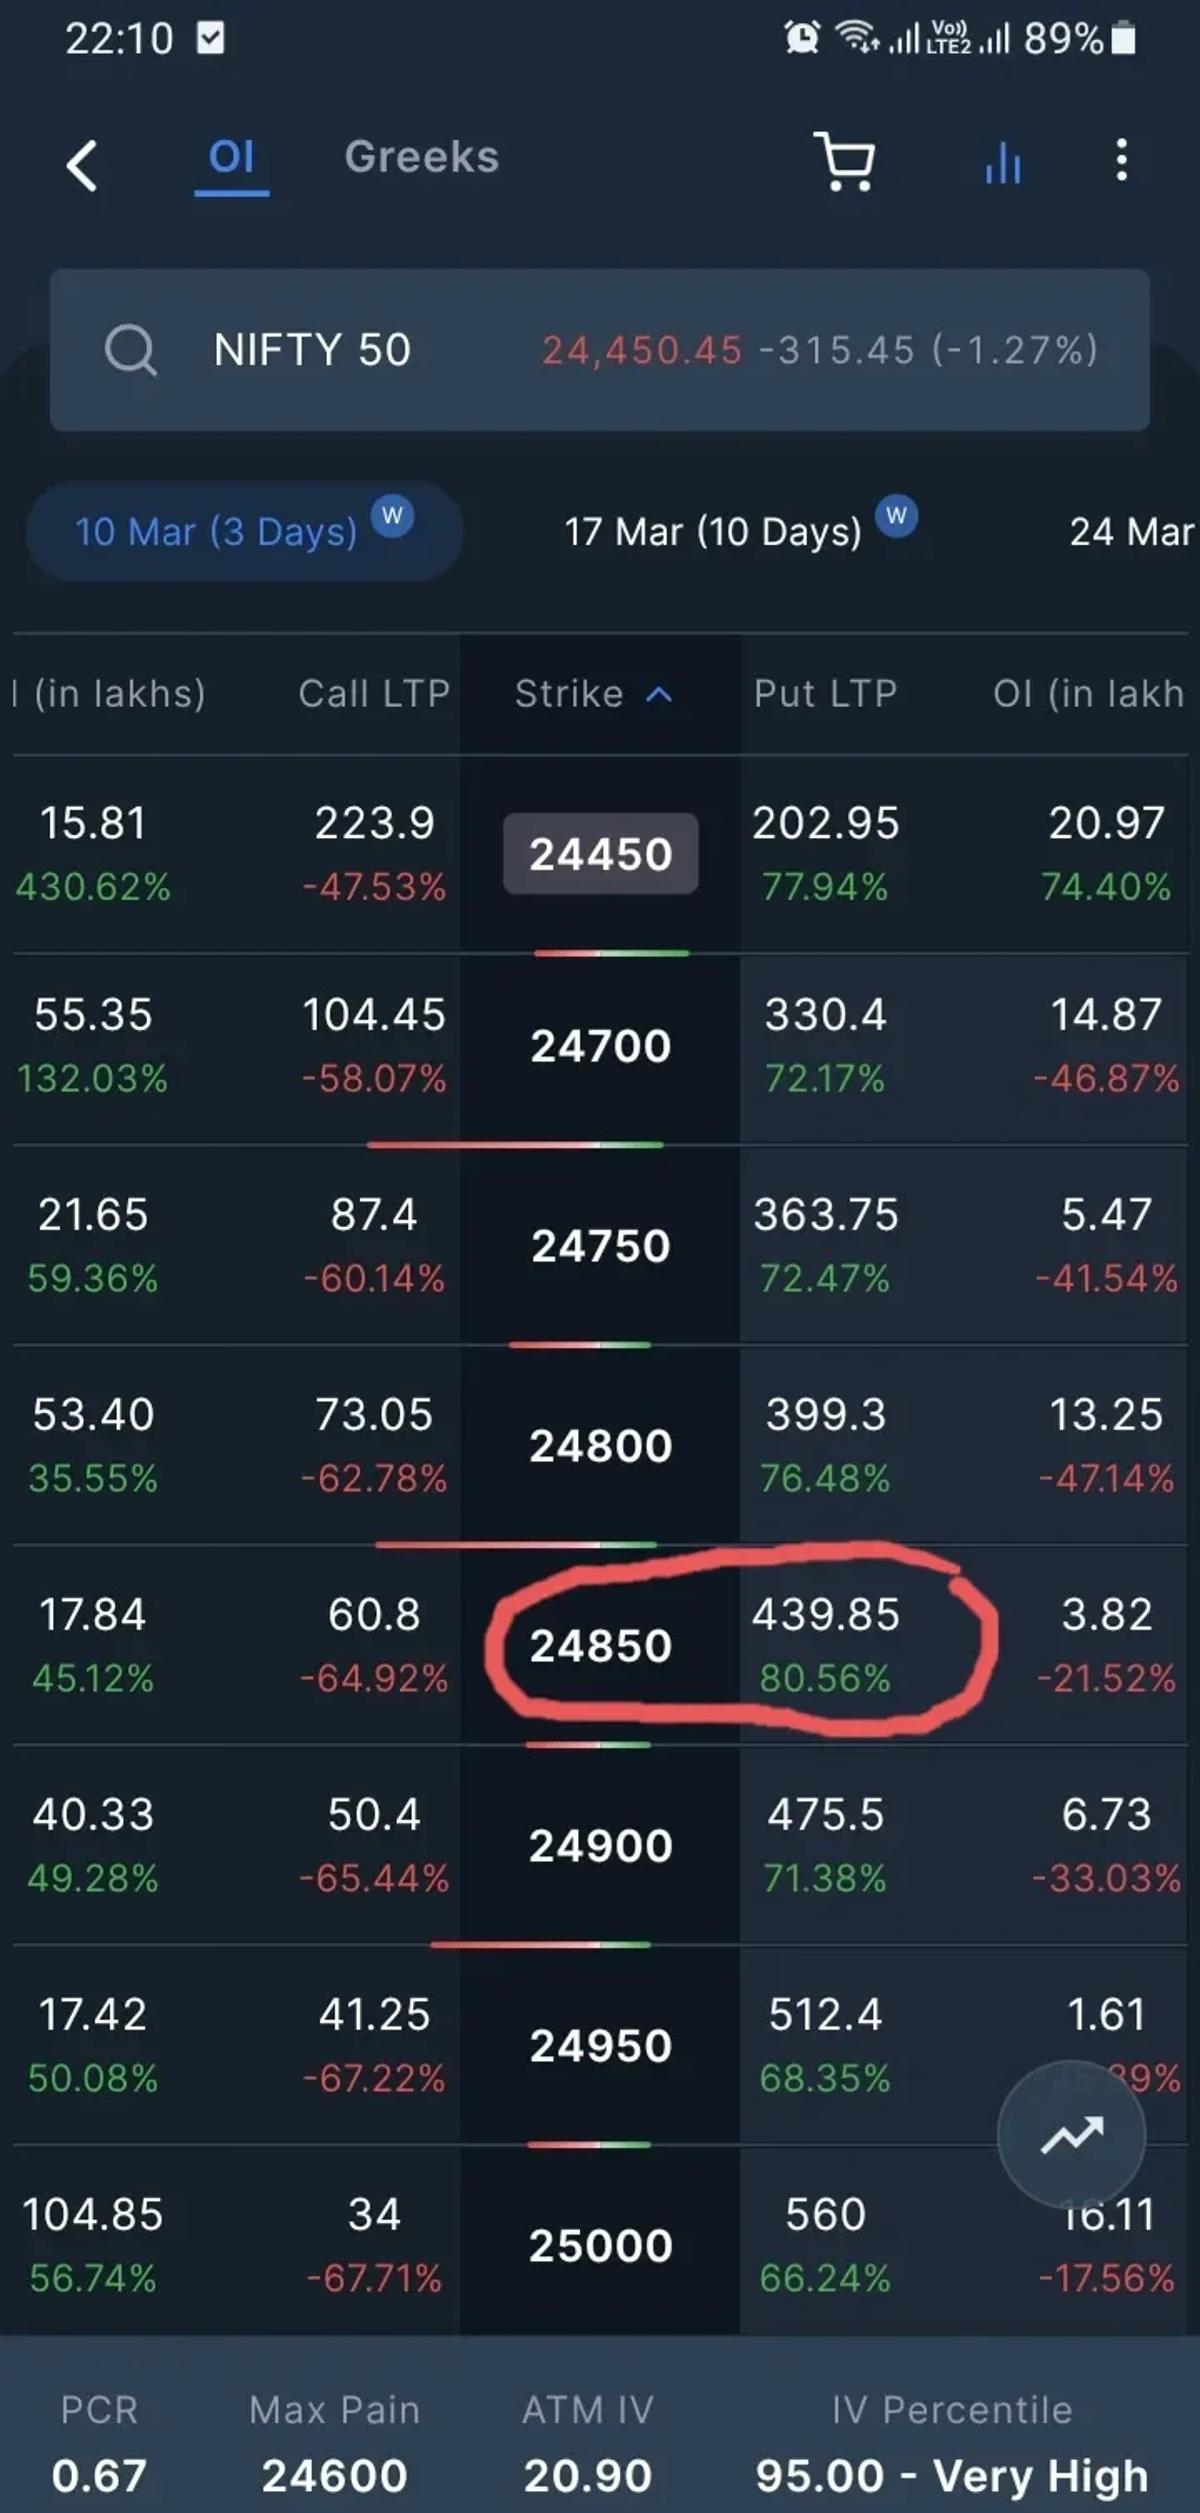
One interesting thing I noticed in Friday’s EOD option chain for Nifty50 (10 Mar expiry)...🤔 >> Look at the marked Option, closing around ₹439.85. Based on basic OTM risk premium / volatility structure, this option’s theoretical fair value appears much higher... >>...
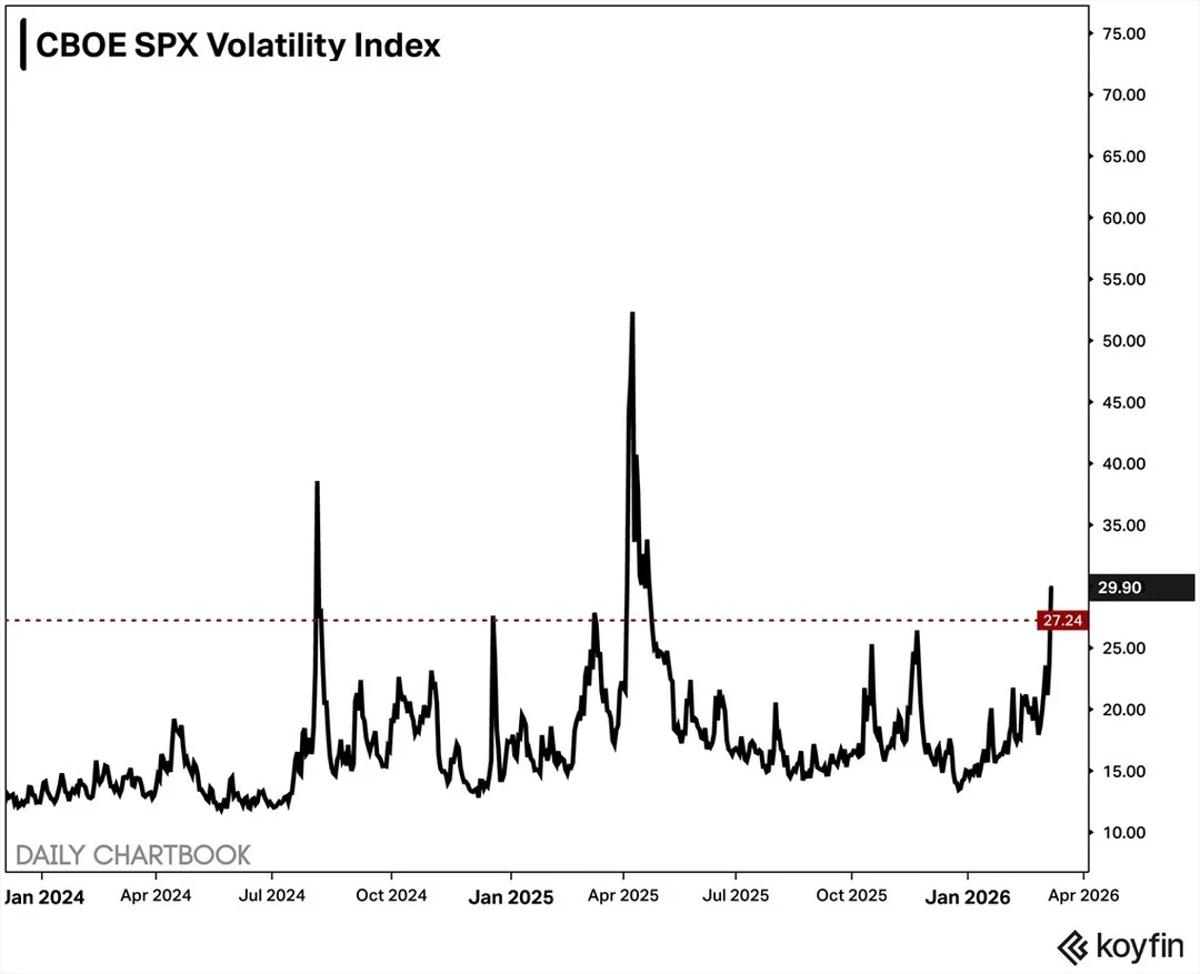
VIX closed at its highest since the Apr'25 tariff (and above the +1 StD level).
Most traders see price stretch and immediately try to fade it. Big mistake. Sometimes that move isn’t exhaustion… it’s price discovery. The Price Wave Deviation Bands help you see the difference between rotation and expansion so you stop fading the wrong moves. Full class now...
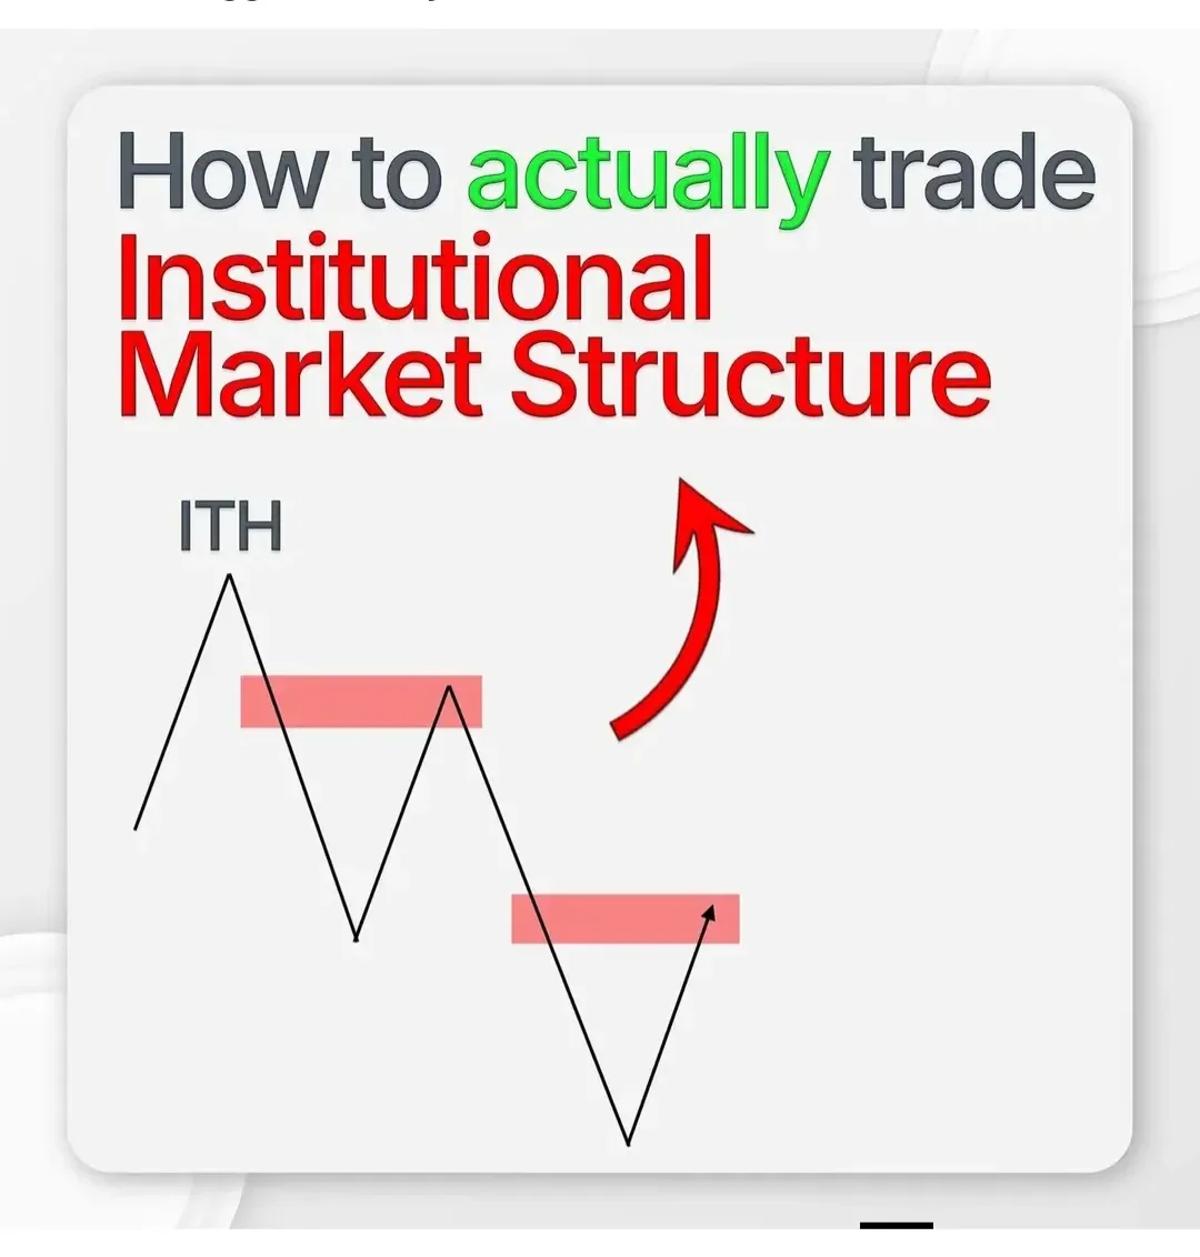
How to actually trade Institutional Market Structure📊 Market Structure ITR 📊 Market structure ITH/IT'LL Confirmations📊 Market structure. Sycle 📊 Institutional 📊 Step 3- Fair value GAP OUT 📊 Market structure. ITH/IT'LL 📊 Market structure. STH, STL 📊 Market structure. STR 📊

My market timing calls on dollar, yields, oil, gold/silver, bitcoin & equities (esp growth to value rotation) can help even the best-of-the-best. 🙏

Since my client warning, VIX has risen 70%. and because I warned two weeks ahead that IRAN RISK IS NOT PRICED IN, clients got to take full advantage of every dollar of the largest weekly gain on record in data going...

The Crude Oil ETF spiked 33% over the last week, the biggest weekly gain in its history. This was a 6-sigma event, which (assuming a normal distribution) is only supposed to occur once every 4,039,906 years. So we shouldn't see another spike...
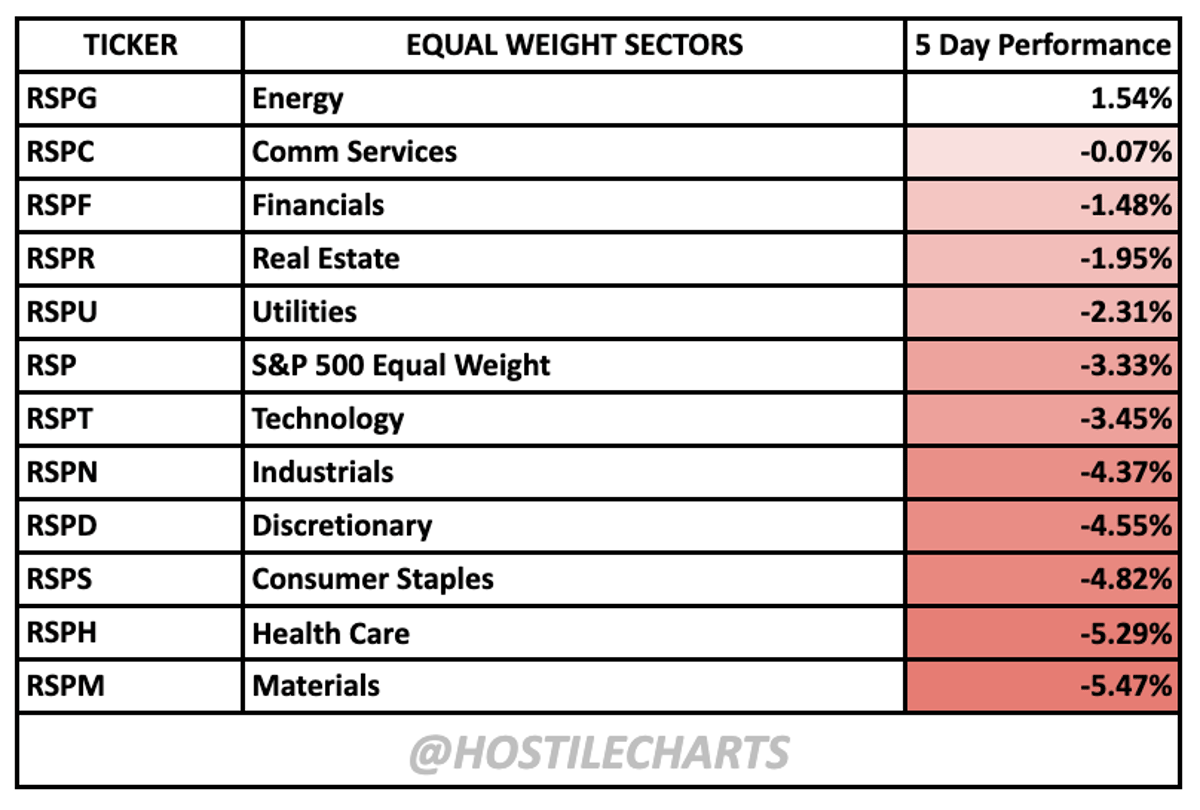
No Place To Hide.... 10 of the 11 Equal Weight $SPY sectors were down this week. 9 of 11 down more than 1%...... https://t.co/tpTJaIDGL3

High yield credit (HYG) down 0.5% on March 6th. When junk bonds sell off alongside equities, it means credit markets are sniffing out real economic stress, not just a volatility event. Watch HYG. It leads. Always. https://t.co/HpbzOsBALw

Only two sectors green on March 6th: Consumer Staples (+0.4%) and Energy (+0.2%). Tech -2.1%. Discretionary -1.8%. Financials -1.3%. When people buy Cheerios and oil but sell everything else, you're not in a growth scare. You're in a survival trade. https://t.co/8RrBLVWIBN
Sentiment extremes often precede reversals - but it's never as easy as it sounds. See IGV from Jan-Feb.

Here is an interview I did recently: The Systematic Trading Blueprint with Steve Burns https://t.co/EX1CEF4BPd
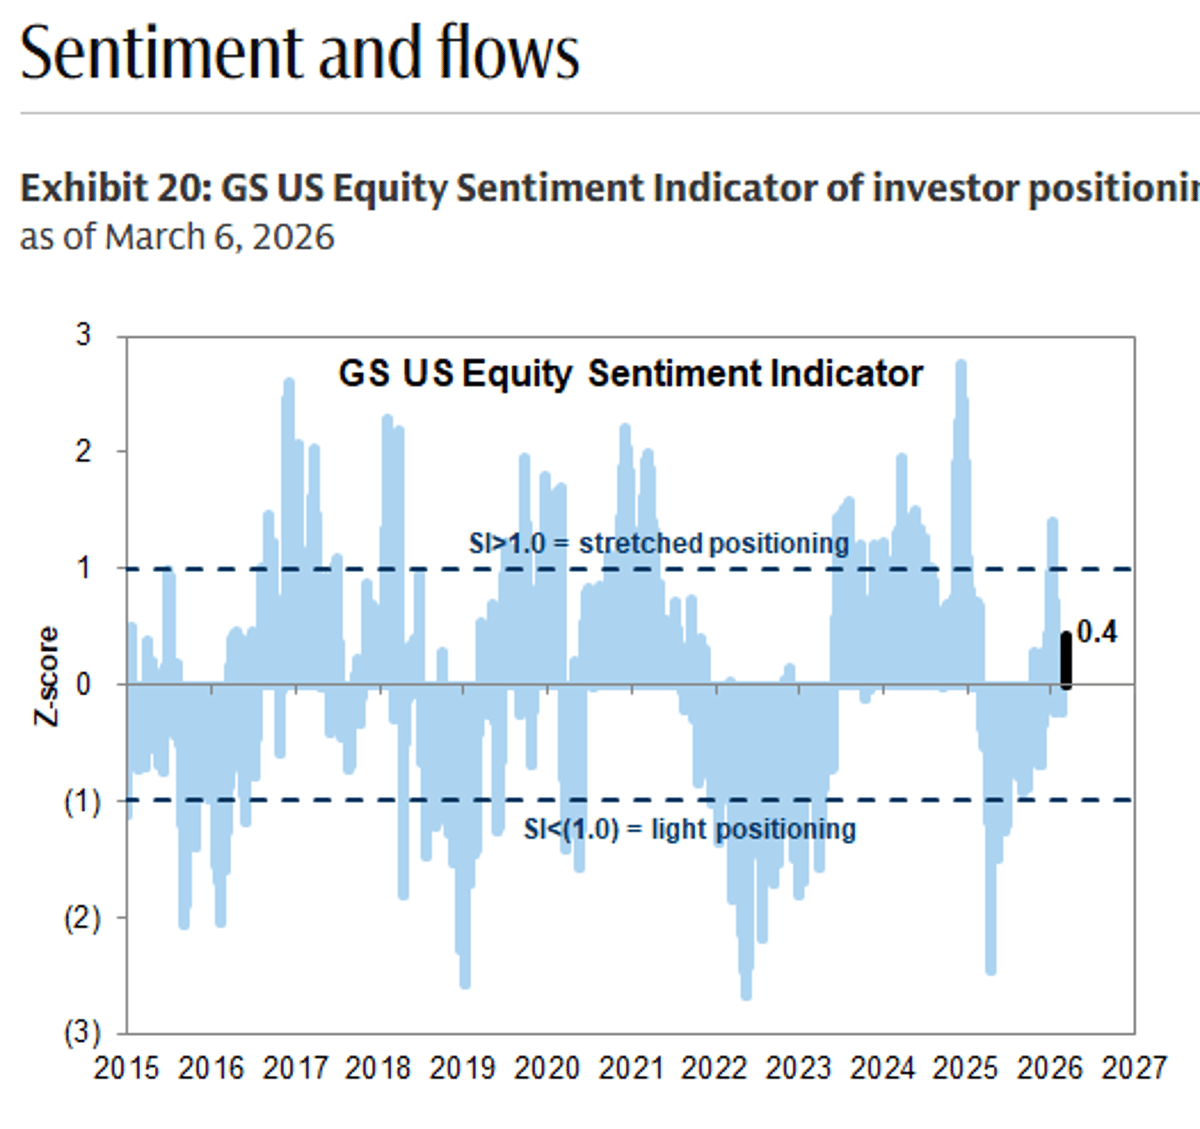
GS equity sentiment still near the flat line.. can't take much signal from that https://t.co/ySSxmcNywv
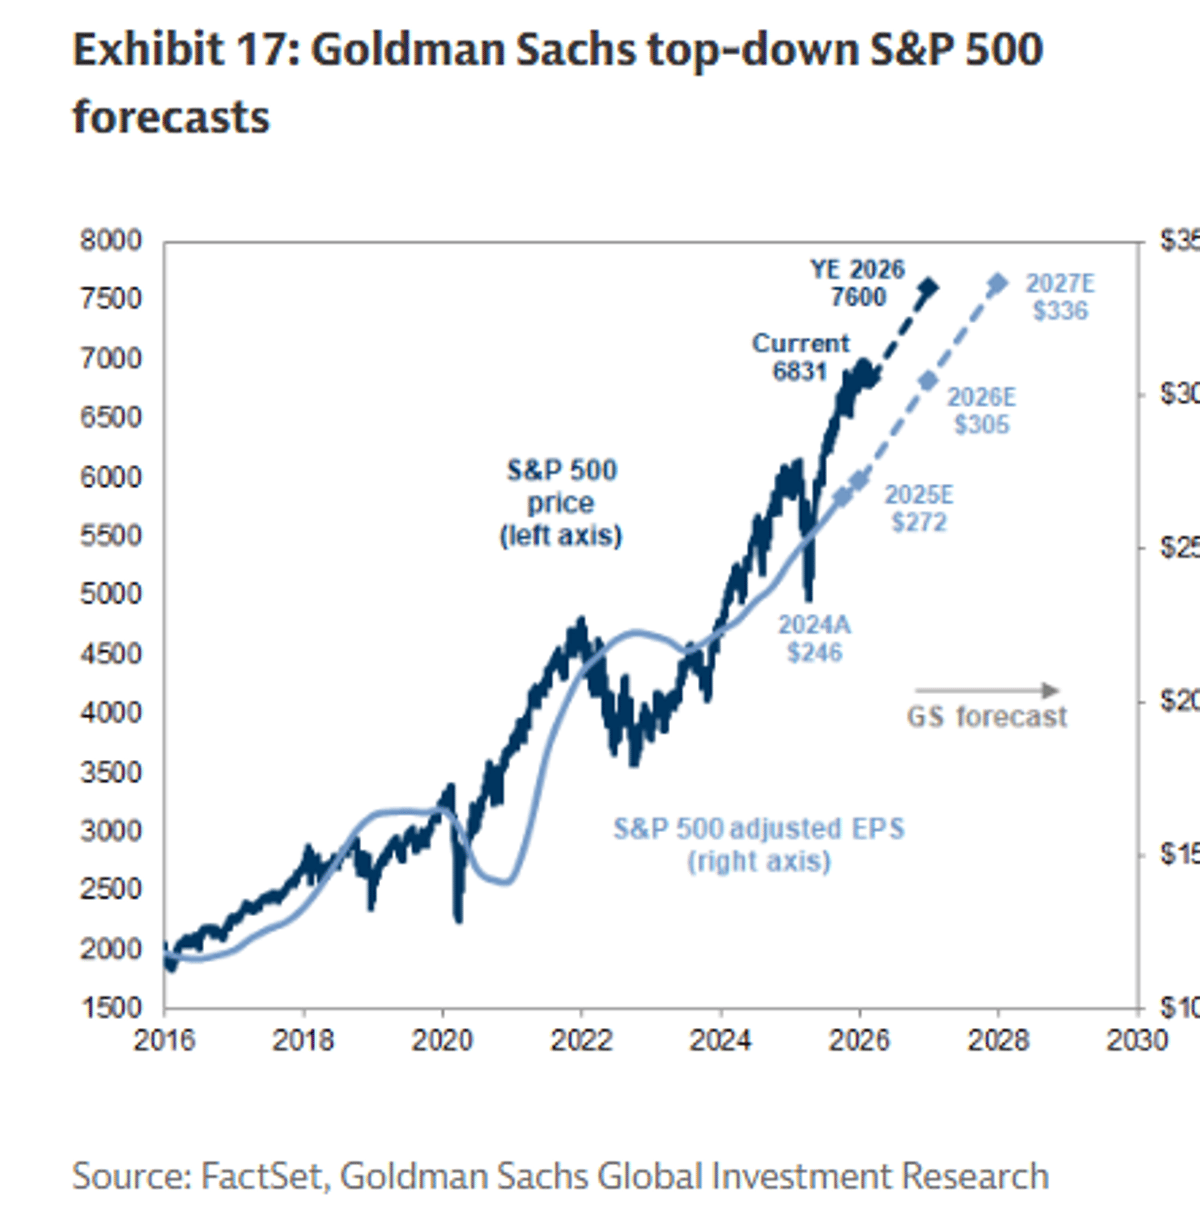
Goldman sticking with a 7600 YE SPX target... I give it 4 weeks before we start seeing estimate cuts across the street https://t.co/DsTzT8zbEO
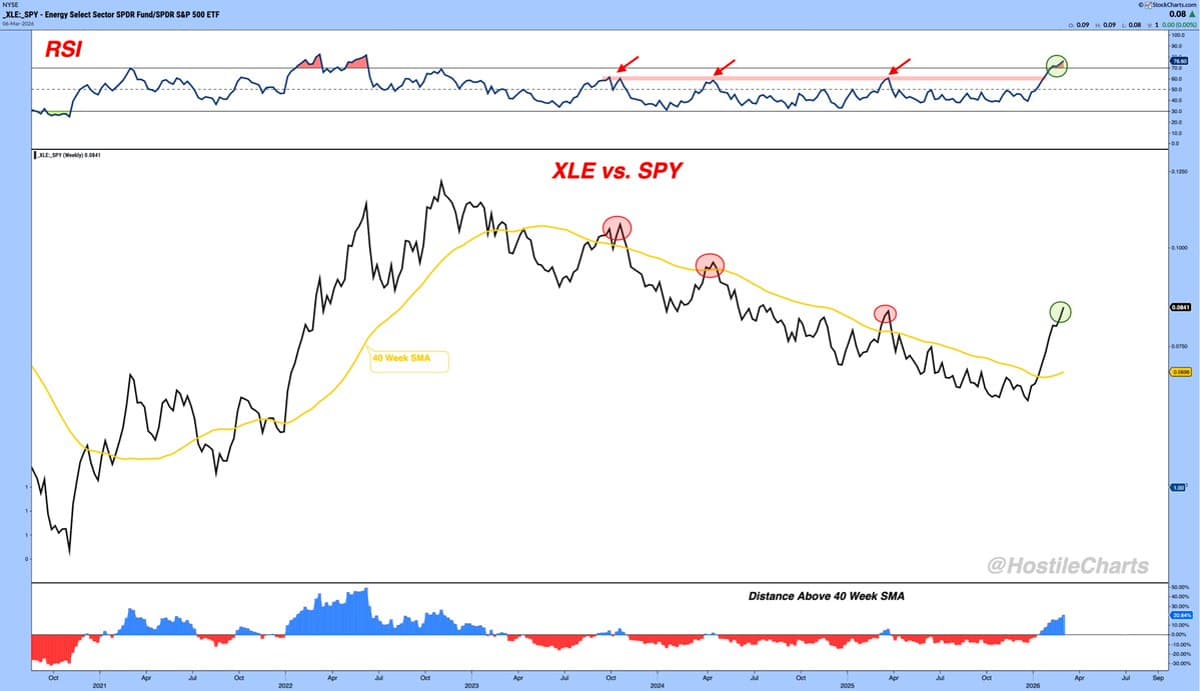
$XLE vs. $SPY - Forward returns for the S&P 500 pretty bumpy when energy is outperforming this much.... https://t.co/Cp4GQFvRq3
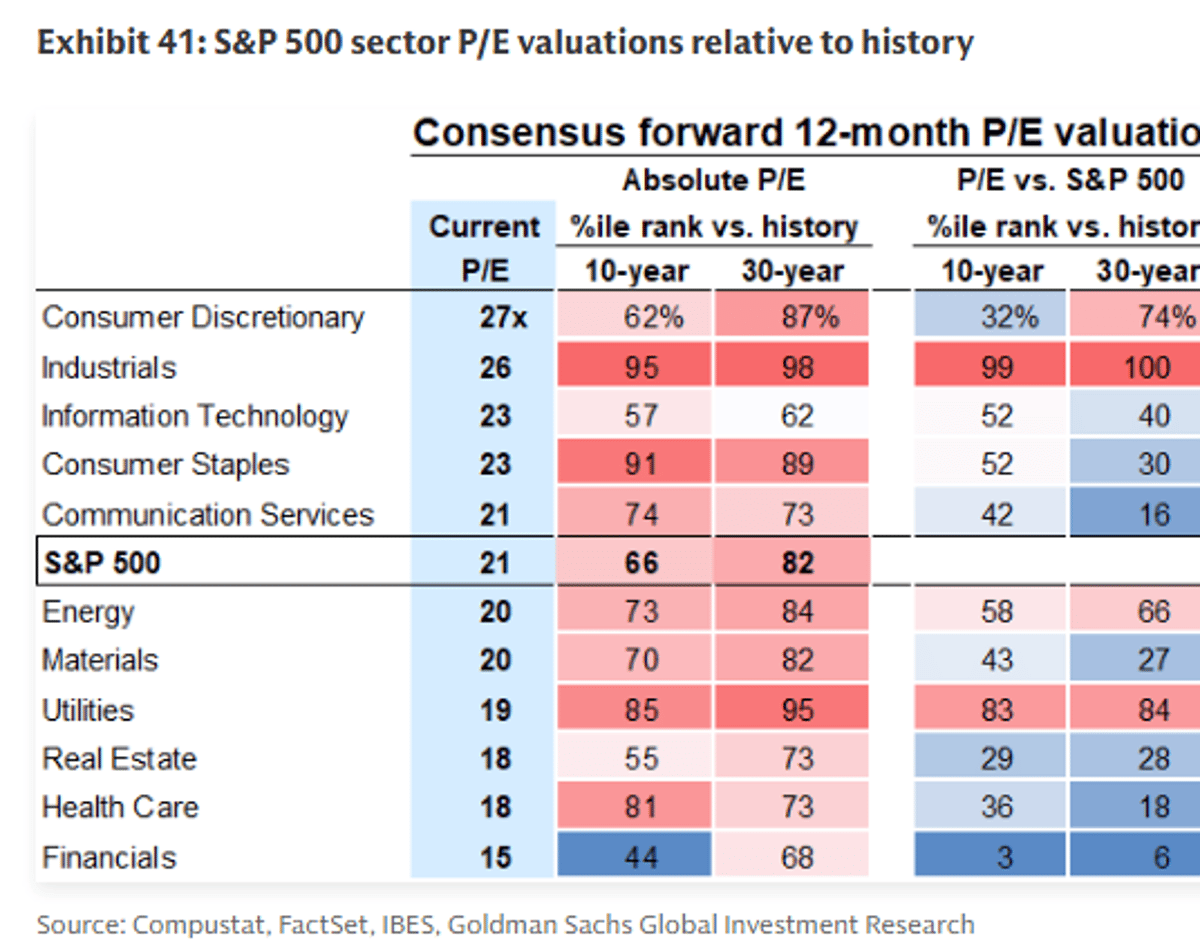
S&P 500 sector valuations... Industrials a nosebleed 26x P/E Staples same as Info Tech https://t.co/p5OdBIqFE8
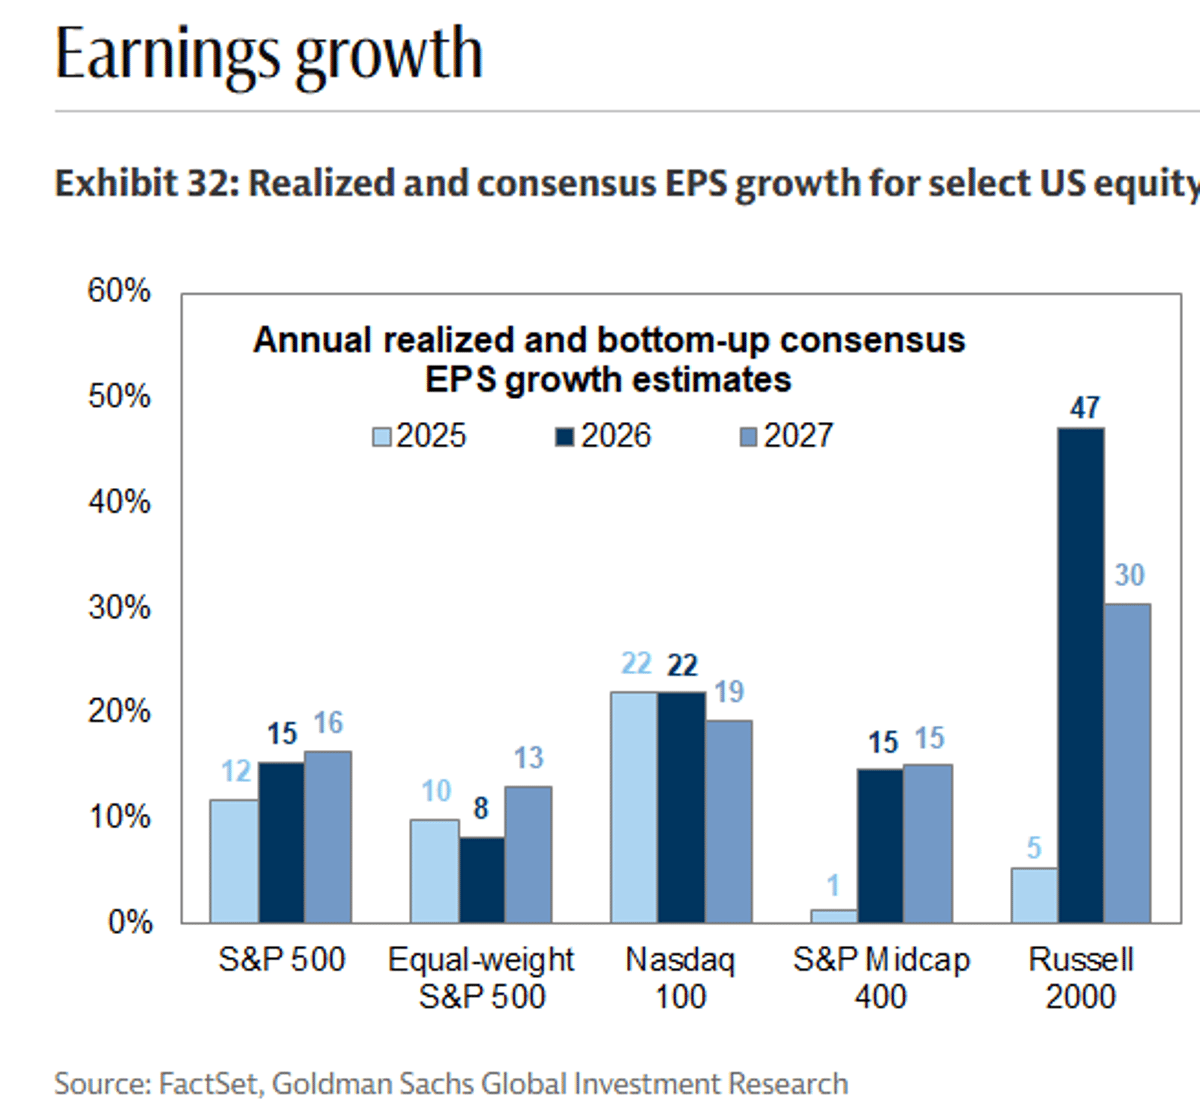
Down, down, down... Russell 2000 CY EPS growth estimate now below 50%.. it was > 60% coming into the year $RTY $IWM GS https://t.co/qDC1XXP7cq
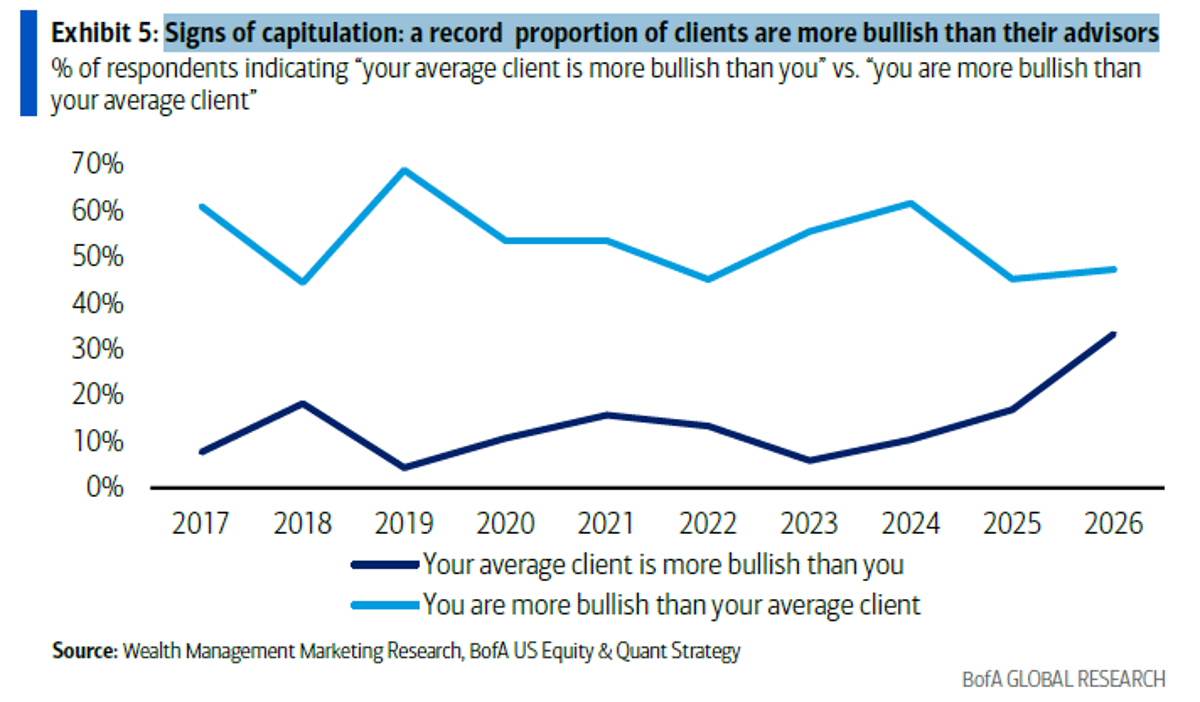
BofA: Signs of capitulation: a record proportion of clients are more bullish than their advisors https://t.co/ZGEXCrToNB
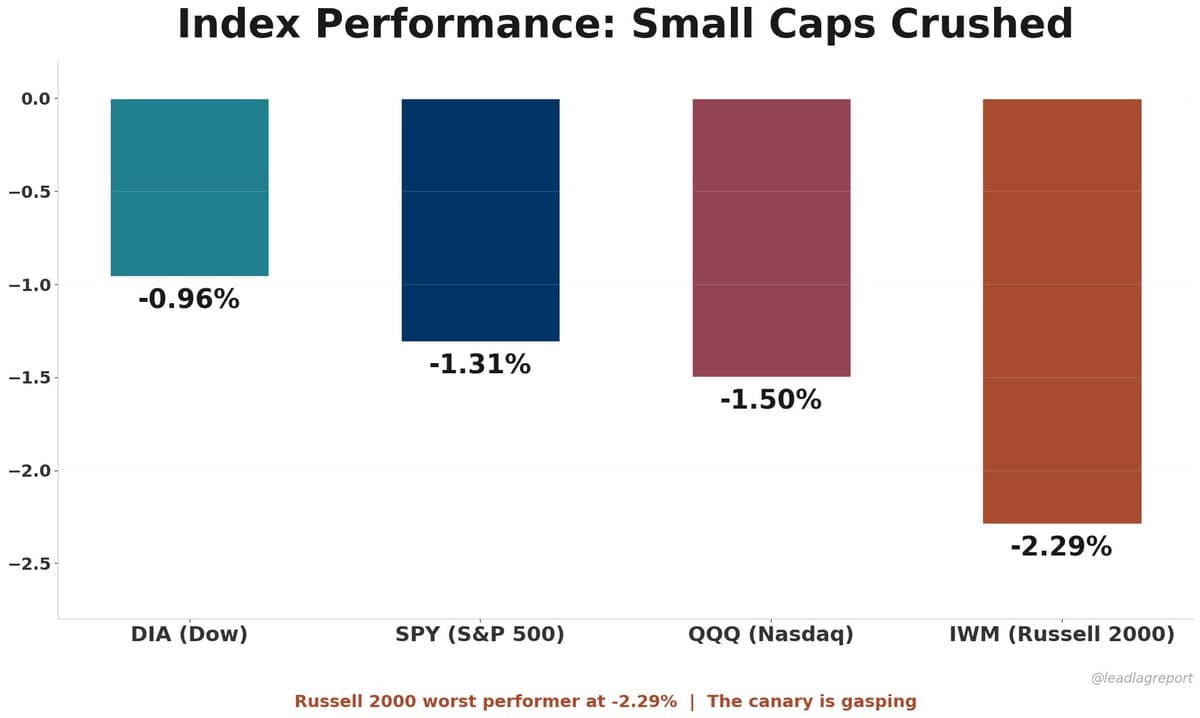
Russell 2000 down 2.3%. Small caps are the canary. They need cheap credit, domestic demand, and labor stability. They have none of those right now. If you're waiting for small cap leadership to confirm a bull market, you'll be waiting a while. https://t.co/mDOKLhcosE
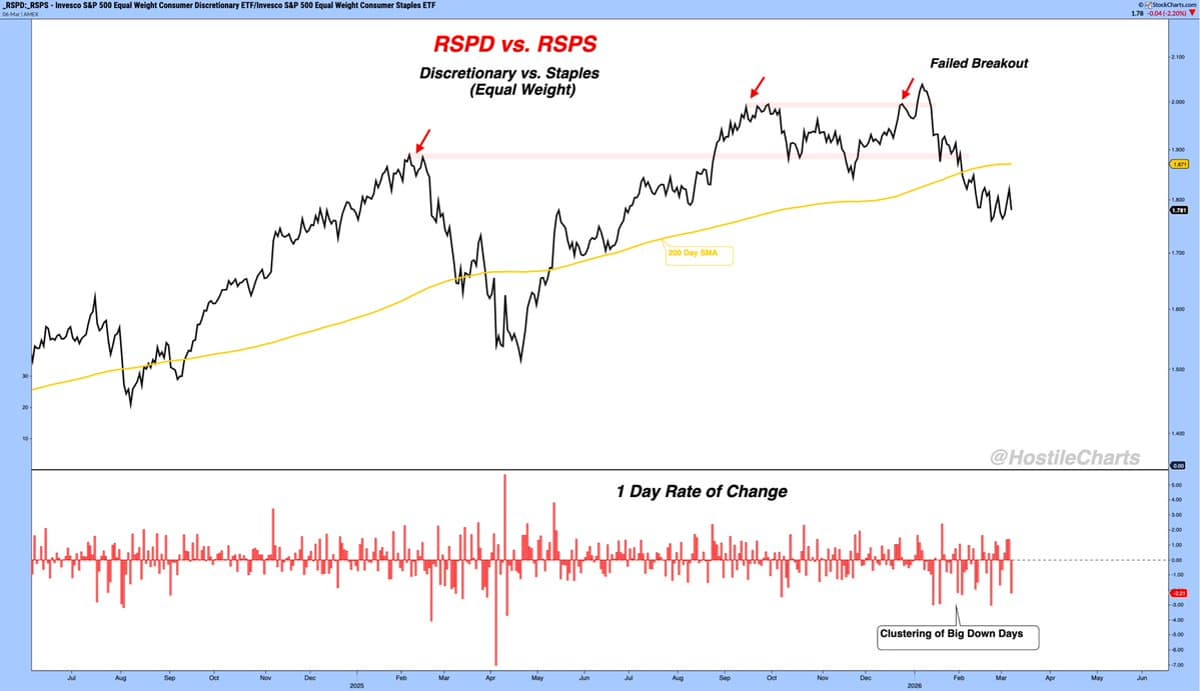
$RSPD vs. $RSPS - So Many charts look like this..... Annoying range.... Failed Breakout..... Successful Breakdown.... Messy Action Below the 200 Day..... https://t.co/uh2qn4kI15

Dragonfly Capital - What to expect from the stock market this week https://t.co/SCdJB4qg8A $SPY $IWM $QQQ $GLD $TLT and more

Sensitivity to OIL price spikes JPMAM Sensitivity to GAS price spikes China is more insulated on both charts than you might have suspected https://t.co/OJm0FMOcmF
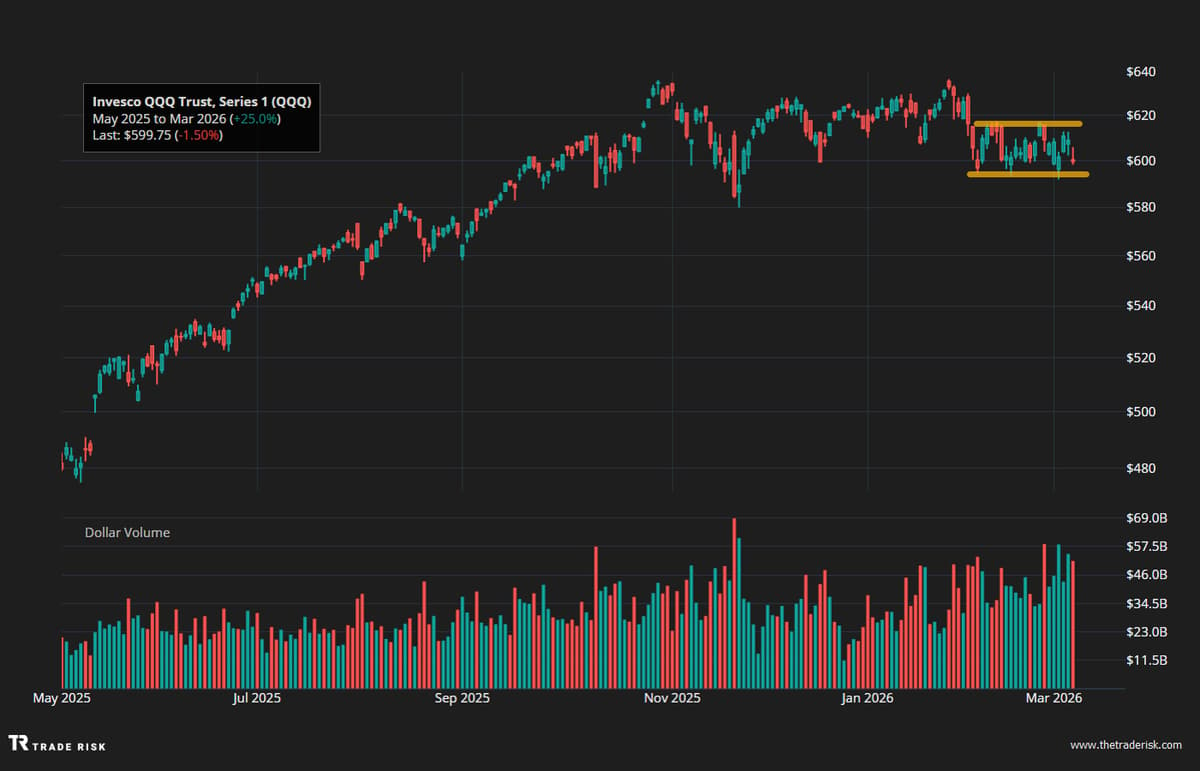
News flow keeps getting worse, yet the Nasdaq 100 keeps on trading sideways. The pressure in this range is building. We discuss timeframes, risks, and positioning heading into next week. 📺 Watch here: https://t.co/nt5IS0fbSr $SPY $QQQ $USO $VIX $IGV https://t.co/YWkFBr5Z2s